

Producer Prices for Final Demand in October jumped 0.6% MoM and 8.6% YoY (6.2% less food, energy and trade.) Futures were little changed…
  …though the 10Y slipped to a cycle low of 1.43%.
continued for members… (more…)
Producer Prices for Final Demand in October jumped 0.6% MoM and 8.6% YoY (6.2% less food, energy and trade.)Futures were little changed… …though the 10Y slipped to a cycle low of 1.43%.
continued for members… (more…)
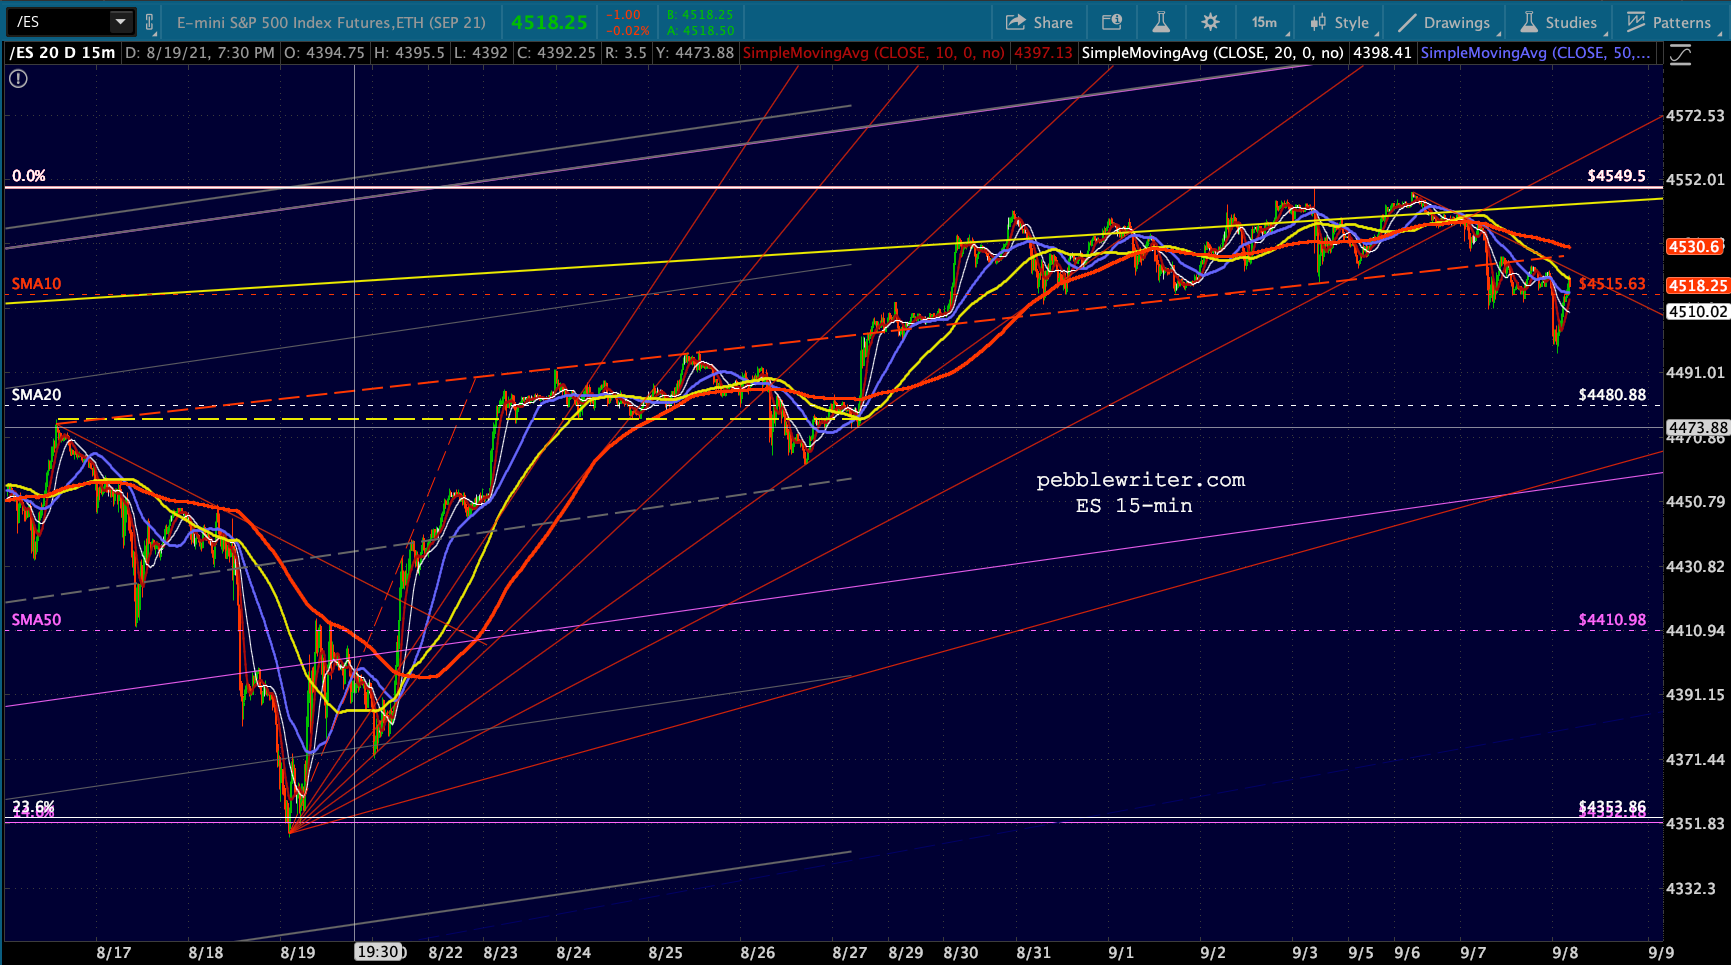
S&P 500 futures are soft this morning, flirting with their first drop through the 10-DMA in three weeks and breaking the dashed red trend line from Aug 16.
 continued for members… (more…)
ES came within 9 points of our next downside target before getting a nice bounce motivated primarily by USDJPY, which was working flat out to save the NKD from a scary, and long overdue dive to its SMA200.
 This bounce will be quite important to the bulls, who are no doubt hoping to avoid a bearish 10/20 cross.
continued for members… (more…)
We start this morning’s post with a peek at the Russell 2000 as it perfectly illustrates the dilemma facing the broader markets this morning.
Up until September 2017, RUT followed a well-defined rising channel shown below in yellow. Like all channels, it was defined by the tops and bottoms along the way. The only problem: The channel was rising only about 5% per year – hardly enough to get excited about. By late 2016, it had become obvious that algos had more influence than discretionary, fundamentally-oriented investors. The algos were, in turn, influenced by certain factors which central banks and their proxies could usually control quite easily. By wagging the tail (the factors) the whole dog (the market) would usually fall in line.
In September 2017, after RUT had been bumping up against the top of the rising yellow channel for over 9 months, the factors went to work and RUT broke out of the yellow channel and rose 21% over the next year. The slope of the new rising white channel was good for about 20% per year.
Everything was going well until September 2018 when RUT topped out at 1742 and plunged 27% in only three months. To make matters worse, the new rising white channel broke down and RUT fell back below the top of the yellow channel from which it had broken out.
It spent the better part of the next year trying to break out of the yellow channel again – failing seven times until Dec 4, 2019, when it finally shot above the channel top and remained there. There was a scare last month when, on Jan 31, it successfully backtested the channel top and bounced 5.5%.
Given yesterday’s carnage, though, it has fallen back to the top of the yellow channel where it faces that same important test all over again. If it holds, all is well and investors can go back to mindless trend following.
Even if it doesn’t, the SMA200 is now up to 1574, a modest 3.3% below yesterday’s close. But dropping through 1616ish would mean breaking down below the horizontal support (which served as overhead resistance between Oct 2018 and Dec 2019.) It could accelerate losses and complicate the rescue mission. RUT is typical of many of the indices and individual equities I chart every day. The Dow, for instance, faces a similar test at 27,700.
 And, SPX and ES completed important backtests (the purple channel top below) in the process of tagging our next downside targets yesterday.
 Given the way the factors are behaving this morning, there is a good possibility that we’ll see additional backtest targets such as DJIA 27,700 tested today. But, that would mean taking a chance on the algos’ ability to rescue stocks from some very risky waters.
Stay tuned.
continued for members… (more…)
In The Matrix, Morpheus presents Neo with a choice between a red pill and a blue pill and explains:
You take the blue pill, the story ends. You wake up in your bed and believe whatever you want to believe. You take the red pill, you stay in Wonderland, and I show you how deep the rabbit hole goes.
Neo chooses the red pill, of course, and suddenly realizes that the world he has known as reality is a virtual reality construct used to pacify humans who serve as organic batteries (for the machines which are really in charge.)

I couldn’t help thinking about Neo’s awakening yesterday as I witnessed Kelly Evans, one of CNBC’s more intelligent hosts, come to grips with the market’s reality: it’s a construct used to pacify investors who might otherwise question its inexplicable moves.
Ms. Evans was clearly shocked at the market’s sudden reversal after plunging in the wake of very disappointing PMI data. She seemed bewildered by the apparent machination:
The president seems to be watching this very closely and to be kind of intentionally — look, I’m just going to call it as I see it — be intentionally coming out with a positive headline every time the market slides the way it did.
Even tomorrow’s jobs report, if it’s terrible, should we expect then some further reports about some trade breakthrough with China? …Is it as simple as the data was terrible and then the president came out and had some positive commentary on China and that was all people needed to hear?
The timeline of events illustrates just how ridiculous Kelly’s suspicions regarding Trump’s intentional intervention are.
By 10:35am, as Trump suggested to incredulous reporters that China should also investigate Biden, SPX had already rallied 25 points. Trump’s comments came 27 minutes after the 10:08 reversal.
It wasn’t ridiculous that Trump would try and prop up the market with another spurious China remark. He does it all the time.
What’s ridiculous is that the market was so easily “rescued” by manipulating the algos into buying everything in sight. I wrote last week [see: The Big Picture] how spikes in oil, gas and USDJPY and especially breakdowns in VIX cause stocks to rally on demand by sending powerful signals to algorithms which are programmed to notice such things (e.g. volatility is plunging, must be time to buy!)
Maybe it was the BoJ. Maybe it was the ECB. Maybe it was the Fed. Remember what Fed Governor Robert Heller argued in a WSJ article in the wake of the 1987 crash, suggesting that the Fed not only had the ability to prop up stocks but should not hesitate to do so.
But wouldn’t it be more efficient and effective to supply such support to the stock market directly? Instead of flooding the entire economy with liquidity, and thereby increasing the danger of inflation, the Fed could support the stock market directly by buying market averages in the futures market, thus stabilizing the market as a whole.
Maybe it was a major bank, brokerage firm or hedge fund caught on the wrong side of a huge trade and just wanted to postpone the plunge until after all those put options expire today.
It doesn’t really matter. What matters is that it has become this easy to force the market to turn on a dime. Sometimes I involuntarily wink when saying the word “market.”
Did I mention that everything reversed precisely at 10:08? See if you can spot the pattern.


The lead factor, in my opinion, was VIX which spiked 7.5% in the minutes following the ISM report. It topped out at exactly 10:08 at 21.44 — only slightly lower than Wednesday’s highs — and was then relentlessly crushed. It made seven successive lower lows in the process of shedding 11.2% by the end of the session.
 Ordinarily, VIX alone would be enough to stave off a significant drop. In this case, though, everything else reversed at exactly the same time — seconds after SPX had registered a 1% loss.
A fluke, you ask? If you’re wondering why futures are higher after this morning’s lackluster jobs report, check out VIX’s latest “breakdown.”
 BTW, don’t bother looking for Kelly’s segment online. I’ve checked, and it’s buried somewhere deep and dark. Welcome to the Rabbit Hole, Kelly.
continued for members… (more…)
Though it is getting a little monotonous, I’ll never get tired of saying that we’re about to tag our next downside target.

The past two weeks of downside have been a great recruiting tool for chart patterns and this website in particular.
A note to prospective members…we’re currently offering auto-renew monthly subscriptions at half-off the first month. To sign up, CLICK HERE.
continued for members… (more…)
In our last update on the Dow, we noted that it had not only fallen through an important trend line but its SMA200 as well. From All Good Things on Oct 11:
DJIA is flirting with breaking below a long-term trend line and SMA200. A failure here opens the door to 23781, another 6.2% lower.
Two months after the breakdown, DJIA is indeed flirting with the 2.24 extension at 23781. Like SPX, it has completed a Head & Shoulders Pattern as well as a Flag Pattern. Also, like SPX, it came up just shy of its .886 Fibonacci retracement yesterday (23881 vs 23781.)
The big question, then, is whether it’s done or whether it’s simply preparing for a more dramatic plunge.
continued for members… (more…)
A quick update on AAPL, which has reached two of our downside targets today…
As we discussed prior to AAPL’s earnings report [see: All Eyes on AAPL] the stock had a gap to close and 200 DMA to backtest.  The danger in reaching both targets was that AAPL would have to descend below the triangle top above which it broke out in August [see: Focus on the FAANGs.] But, as we discussed, this wouldn’t necessarily be all that alarming.
A drop to 200 or so wouldn’t do much to dent bulls’ enthusiasm. Even a drop to the SMA200, currently at 192.17, could be passed off as a base-building exercise.
It’s been almost two weeks since AAPL posted earnings, and it just reached its SMA200, (one day after closing the gap) posting a low today of 191.45 — an 18% drop from its Oct 3 highs. Needless to say, some bulls are getting nervous.
 A quick glance at the weekly chart shows why. If the rising red channel from 2016 doesn’t hold, it’s quite a ways to the first serious support down at the purple channel midline. Maybe it’s time to expand the company’s stock repurchase plan.
 Don’t own any AAPL? Wondering why you should care? Drops through AAPL’s 200-DMA have been a trap door to some big swoons for the overall market.
With our yield curve model and oil/gas charts screaming “short!” I’d give better than even odds that AAPL’s channel and the overall market are headed lower. If AAPL closes below its SMA200, I’d say it almost certain. Stay tuned.
UPDATE: Nov 14, 2018 – 3:45 PM
AAPL closed below its SMA200 and its red channel is failing. As we noted a couple of weeks ago, the nearest significant support is now the .618 Fib at 144.48. (more…)
Want to know where markets are going? Just check Facebook. The stock, that is.
As I pointed out in March [see: Facebook Flops] the stock is a very reliable indicator of overall market direction. And, right now, it’s threatening new all-time highs.
But, its accomplishment raises an important question: does it matter how the stock got to where it is? What about market integrity and price discovery? Do they matter?
As we’ve discussed, each time FB tagged or dropped through its 200-DMA (the red line below,) the S&P 500 swooned — or even underwent a full-fledged correction. The 2015-2016 correction is the most obvious. But, FB’s November 2016 dip was potentially more serious. Not only did the stock drop through its 200-DMA, but it remained there long enough to produce a bearish death cross, where the 50-DMA crosses below the 200-DMA.
The impending death cross could be seen a mile away. So, after a week of the stock lingering below its 200-DMA, the FB board announced a $6 billion stock buyback plan. The stock bounced a few times, finally clearing the 200-DMA on the very same day that the death cross occurred.  What better way to convince investors that the death cross wasn’t anything to be concerned about?
Facebook doesn’t publish detailed transaction reports for stock buybacks; but, it seems likely that the shares purchased under the plan were timed to help the stock clear its 200-DMA. FB ran up to new highs, ignoring the 4.23 Fib extension as it had all the others. A year later, however, it managed to drop back below its 200 DMA. In the process, it completed a bearish Head & Shoulders pattern that targeted 133-140 — another 17-20% drop on top of the 13% it had already shed.

After dropping through the neckline of the H&S Pattern, the stock couldn’t even manage a full backtest before plunging anew. The dreaded death cross occurred on April 13. On the 25th, the company announced a $9 billion expansion of the stock repurchase plan. This was particularly significant, as there was still $4 billion left over from the original $6 billion plan.
The very next day, FB spiked up through its neckline and 200-DMA. Since then, it’s tacked on 25%. Are any shareholders complaining? Of course not. Ditto for the many employees who own shares. So, what’s the problem? All’s well that ends well, right?
I suspect most investors would agree with that sentiment. There has been little outcry, even though 54% of corporate profits — over $5.1 trillion — has been dedicated to buybacks over the past 10 years.
 Prior to 1982, buybacks were prohibited. They were considered a form of market manipulation. After passage of Rule 10b-18, however, corporations were offered a safe harbor as long as they met certain conditions.
Supporters of buybacks say they are beneficial. Over half of all Americans own stocks, even if indirectly through a 401(k.)
Critics maintain that they are a financial engineering trick, inflating EPS even if profits aren’t actually growing. Chrisopher Cole of Artemis Capital figures that 40% of EPS growth since 2009 is from share repurchases.
NYU professor Edward Wolff says they benefit the rich more than anyone else, as the top 10% of households own 84% of all stocks. Yale professor Robert Shiller calls buybacks “smoke and mirrors.”
It’s safe to say that as long as corporate management can borrow money at historically low rates in order to drive their stock higher, the practice will continue. But, it’s hard to look at a stock like FB without wondering whether market integrity is still a thing.
Facebook is only 5.5% of the Nasdaq Composite (COMP), but yesterday’s plunge [see: Facebook Flops] was a good reminder to update our outlook.
In our last update [see: Nov 6, 2017 Update] we identified 7619.37 as our next upside target.
At this point, it’s pushing into the top quadrant of the rising white channel where it will soon reach the top of the rising purple channel — currently at 7260.
It probably won’t stop there, though, as the 1.618 and the rising white channel intersect at 7619.37 at the end of the year. It’s too convenient a target to ignore. And, I fully expect it to reach it unless we get a nasty surprise on the geopolitical front.
As it happened, COMP’s tag of 7619 was delayed by the February correction. It topped out last week and has since retreated 352 points — about 4.5%.  Since COMP reached its important 1.618 Fibonacci extension and the top of a well-formed channel, it’s fair to ask whether there’s more downside ahead.
continued for members… (more…)
