All good things come to those who wait. Or, so the saying goes. It’s not always easy. The past few weeks have sorely tested bears’ patience.
For many weeks we’ve been wondering when the rising channels would break down. It seemed inevitable, as oil and gas were causing inflation problems, USDJPY had reached a turning point, and VIX was threatening to break out. The post from Sep 21 see: [Quad-Witching] is one example:
But, we’ll see what happens this weekend in Algeria. CL and RB are long, long overdue for a correction. Combined with USDJPY running out of steam and VIX due for a breakout, this would not bode well for stocks.

Yesterday, SPX’s red channel broke down and it made a beeline for the yellow neckline at 2780, closing just above it. It was a long overdue backtest. Interestingly, it leaves the 2.24 Fib extension at 2703.62 within striking distance. With CL off nearly 7% and RBOB off 8% over the past week, and USDJPY having reversed where expected, it appeared fairly likely. Had VIX not reversed at our next upside target overnight, SPX might be tagging 2702 on the open this morning.
 Is this another question of “when” and not “if”?
CPI just came out. One comment… Gasoline’s 9.1% increase over September 2017 was greatly muted by last September’s huge spike. October will not enjoy the same benefit. If the Fed is looking for an excuse to pause rate hikes (without appearing to acquiesce to the Inflator-in-Chief) as I believe they are, gas prices must continue falling.

continued for members…
Some of these are from around midnight last night, others from this morning. I’ll be back in a few to sort them out and offer some commentary…
Last night’s bunch:
DXY was still above the channel midline and recent neckline.
 SPX stopped above its neckline.
 VIX came up short of our 24.2 target.
 But, ES had dipped below its SMA200 and dangerously close to its 2.24 Fib.
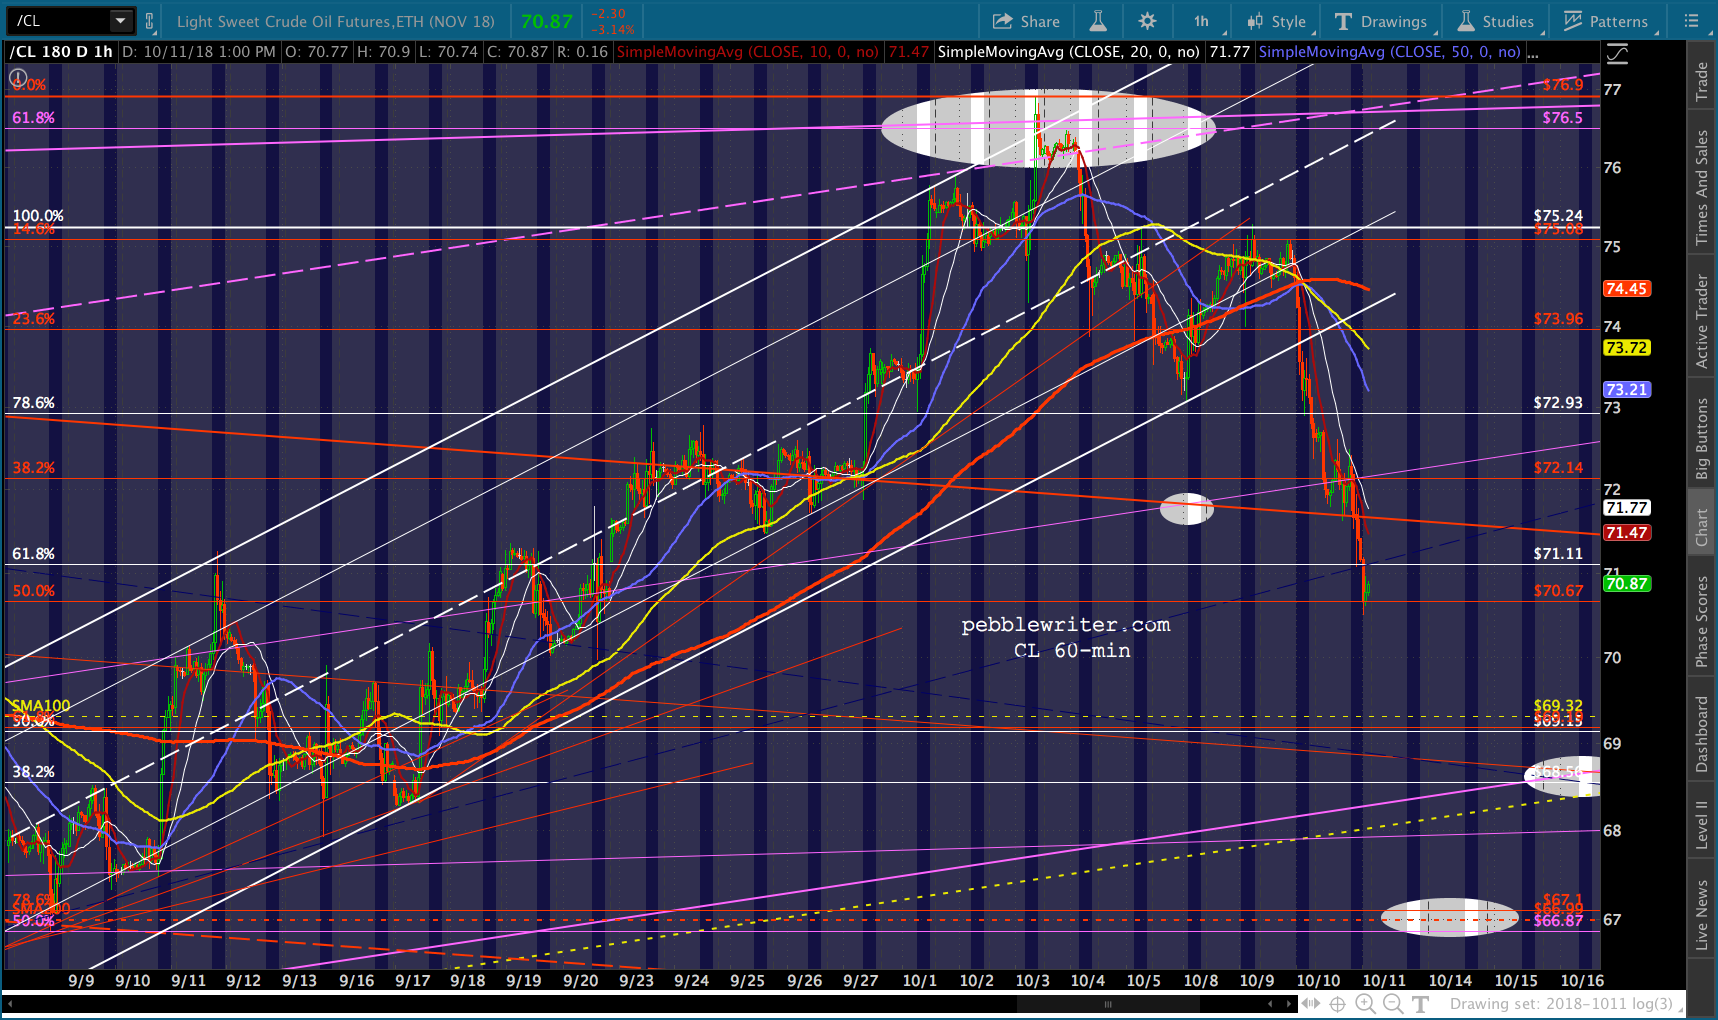
 CL had reached our initial target…
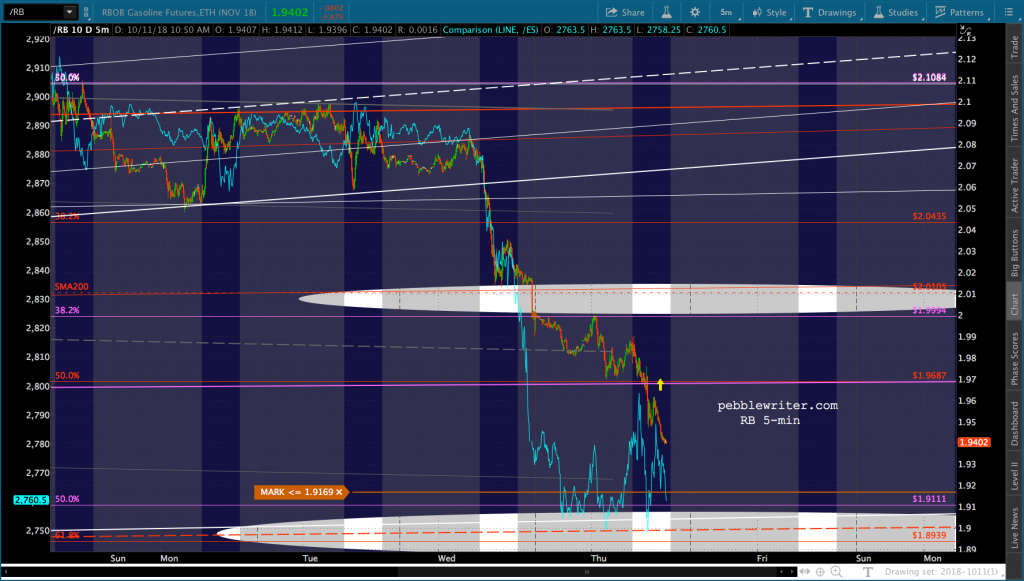
 …and RB had dropped through its SMA200 and was heading further south.
And, where we are this morning:
VIX reversed at the red .886 at 24.2…
 …which rescued ES from a dip below its SMA200.
 DXY tested but didn’t break through that midline again.
 EURUSD didn’t break down, but hasn’t yet broken out for that backtest that’s been in our sights…
 …and, USDJPY drew back from tagging our downside targets.
 RB continues to fall, but a reminder that we have EIA inventory coming out at 11:00AM this morning. API data was terrible.
 And, CL has backtested at our initial downside target.
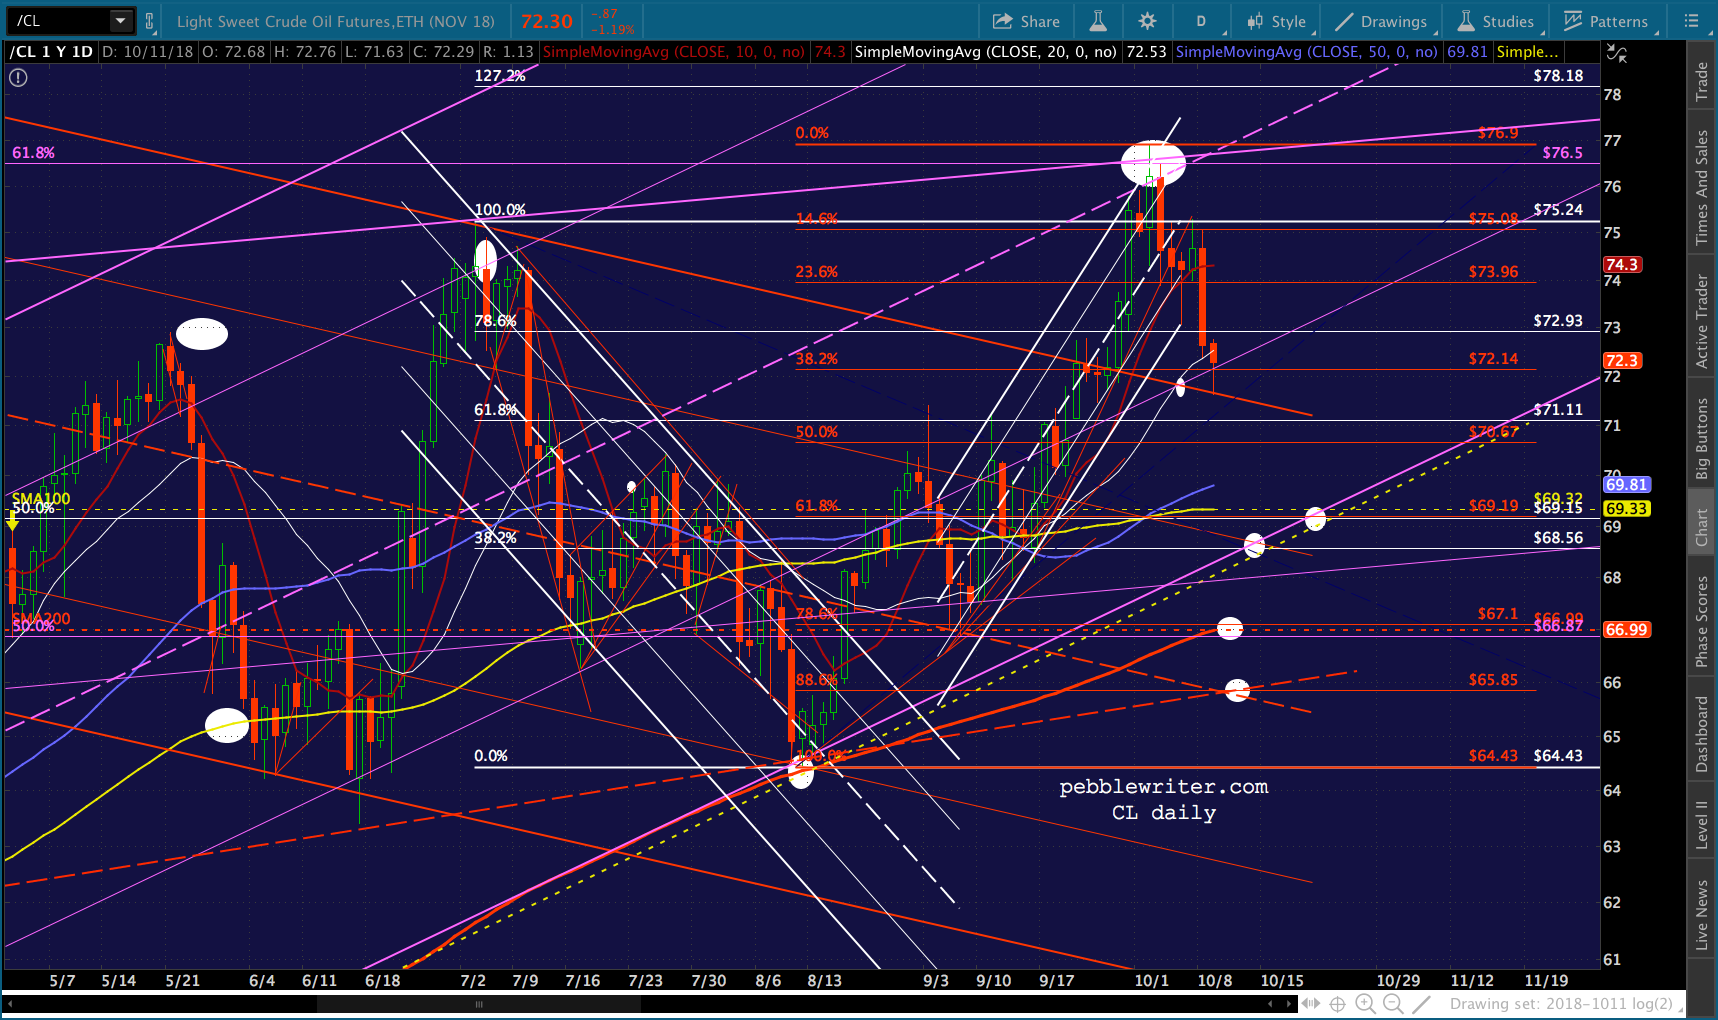 VIX remains a wild card. If it’s done rising, then SPX might hold its neckline. I’m dubious of this scenario, but stranger things have happened.
I think it’s more likely we get a nice bounce this morning followed by another leg down later in the day or tomorrow.
Just heard that Larry Kudlow is swinging by CNBC in a few. I guess Bullard’s Bloomberg appearance will wait for the 2702 tag.
UPDATE: 10:05 AM
ES has backtested its neckline – nice place for the bounce to run out of steam. Note that I’ve added the white target down at 2703.75 to match up with SPX’s 2702.78. In other words, an overshoot.


RB has now backtested the top of the purple channel from which it broke out in late January.

Remember, it was the subsequent failure of the breakout (the purple circle below) which exacerbated the Jan-Feb correction in stocks. Stocks didn’t bottom out until it broke out a second time.
If I were in charge of getting SPX down to 2702, I can’t think of a better way to do it than to drive RB down below this channel top to, say, 1.8939 or 1.8227.

COMP is probably the best argument for further SPX downside.

UPDATE: 1:51 PM
SPX and ES are back below their SMA200s – not a good development for bulls.
 Even DJIA is flirting with breaking below a long-term trend line and SMA200. A failure here opens the door to 23781, another 6.2% lower.
RB continues to sneak down on 1.8939…
…while VIX is likely to top last night’s highs with a move to the .382 and.or red TL.
Nice move for GC today, after almost two months of bottoming. If it can make it back above the SMA100 then the SMA200 and former highs are potential targets. UPDATE: 3:00 PM
Many messages from members today asking what would happen if SPX fell below 2700… As a reminder, SPX is currently following the yellow channel and just tested its midline. If 2700 breaks, the major support becomes the purple channel midline…

…followed by the yellow channel bottom and then the white channel bottom.  The yellow channel is actually bogus — a channel within a channel — but it has worked for quite a while. The “true” channel that includes moves in 2009 is the purple one shown below.
 I could certainly make a case for 2138. But, recently history shows that TPTB are pretty damn good at propping up stocks at major Fib levels.
Note that RB is closing in on 1.8939. I don’t know exactly where it’ll bottom. But, it’s safe to say it should bottom when SPX does, ideally at 2700-2702.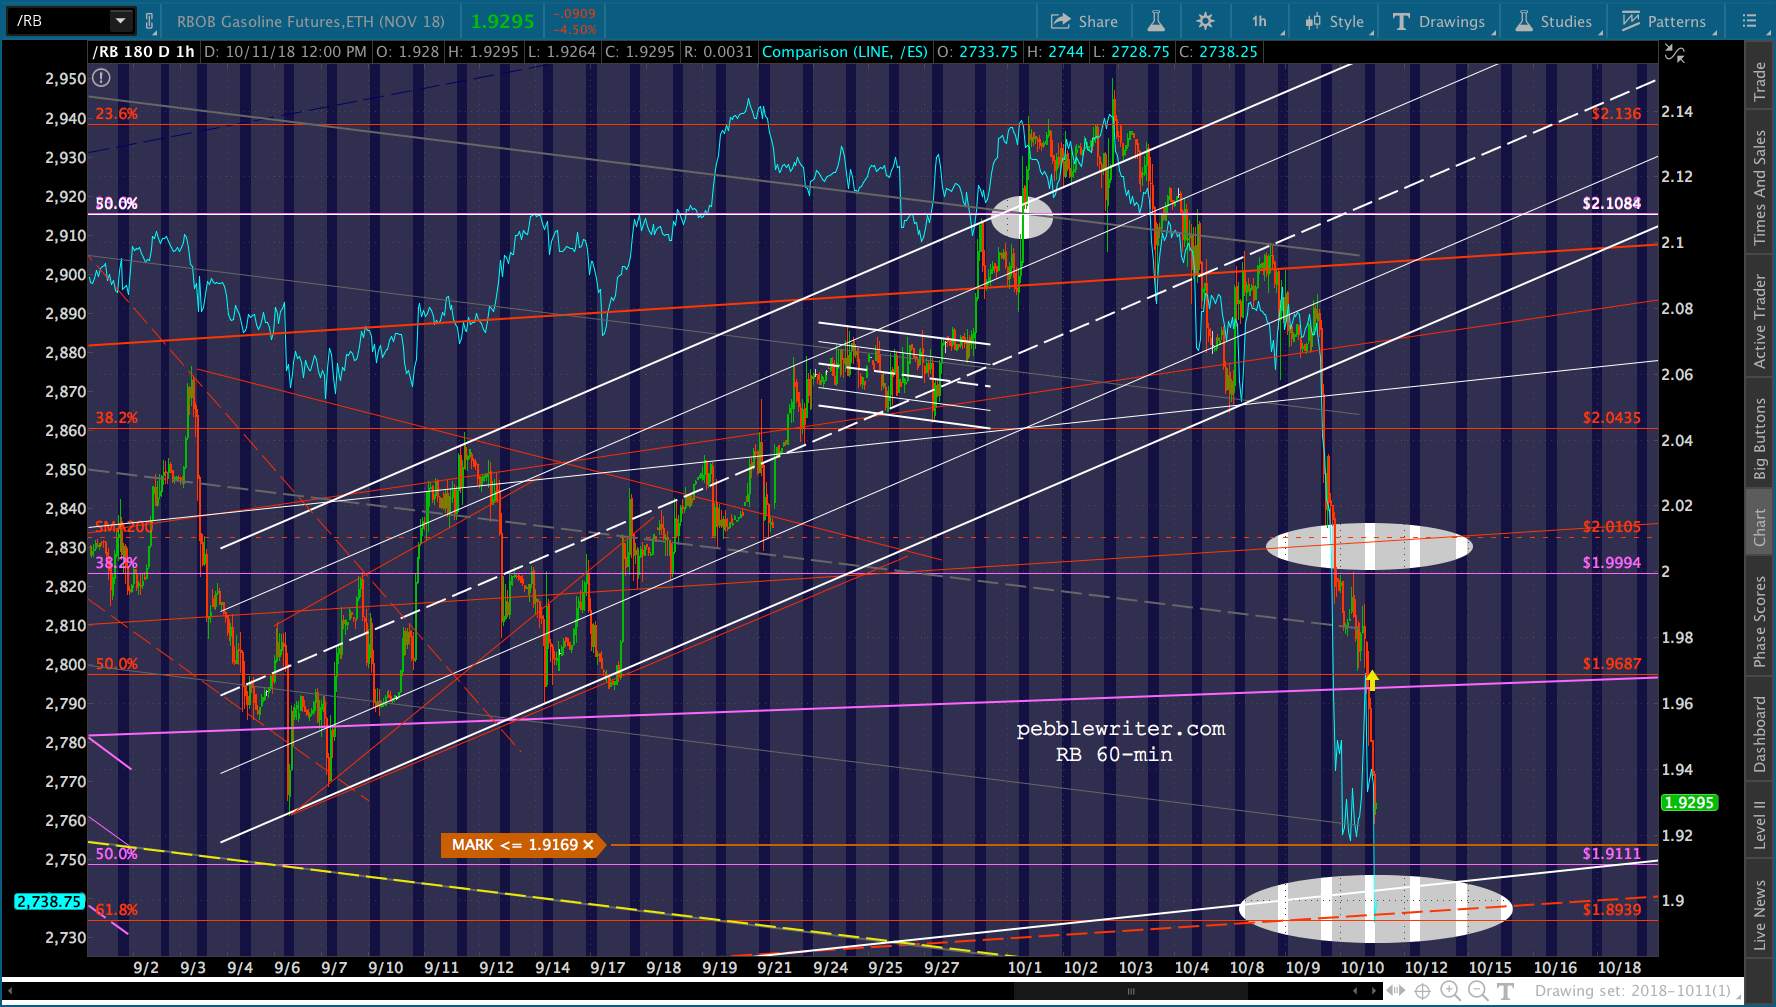 UPDATE: 4:15 PM
EOD…