Tag: AAPL

  • Mixed Messages

    The headlines have been coming fast and furious over the last 24 hours.  First, Trump’s tweet yesterday morning regarding trade negotiations with China touched off a rumor, declared false this morning, that a trade deal was imminent. But, SPX soared yesterday anyway.

    Then AAPL’s earnings came out.  The numbers were underwhelming; and, the company’s announcement that they’d no longer report unit data was very poorly received.

    The chart we put up yesterday prior to the close [see: All Eyes on AAPL] showed substantial downside potential… …which after-hours trading is confirming.Then there was this morning’s payrolls data: a 250K increase with a 3.1% increase in average hourly earnings.  While no doubt  It’s exactly the sort of data the Fed needs to justify further rate increases in the face of the collapse in oil and gas prices — the last piece of the puzzle.

    Gasoline has now fallen over 20% since our Oct 3 short call and tagged another downside target yesterday.Oil is off over 16% and just broke beneath horizontal and channel support.  To be sure, it will keep October’s CPI low and will delight voters driving to the polls on Tuesday.  But, like the employment data, there are repercussions.By the way, I have updated our oil and gas forecasting results, available at the links below.

    Oil Results
    Gas Results

    I hope to post currencies, VIX and gold later today or this weekend.

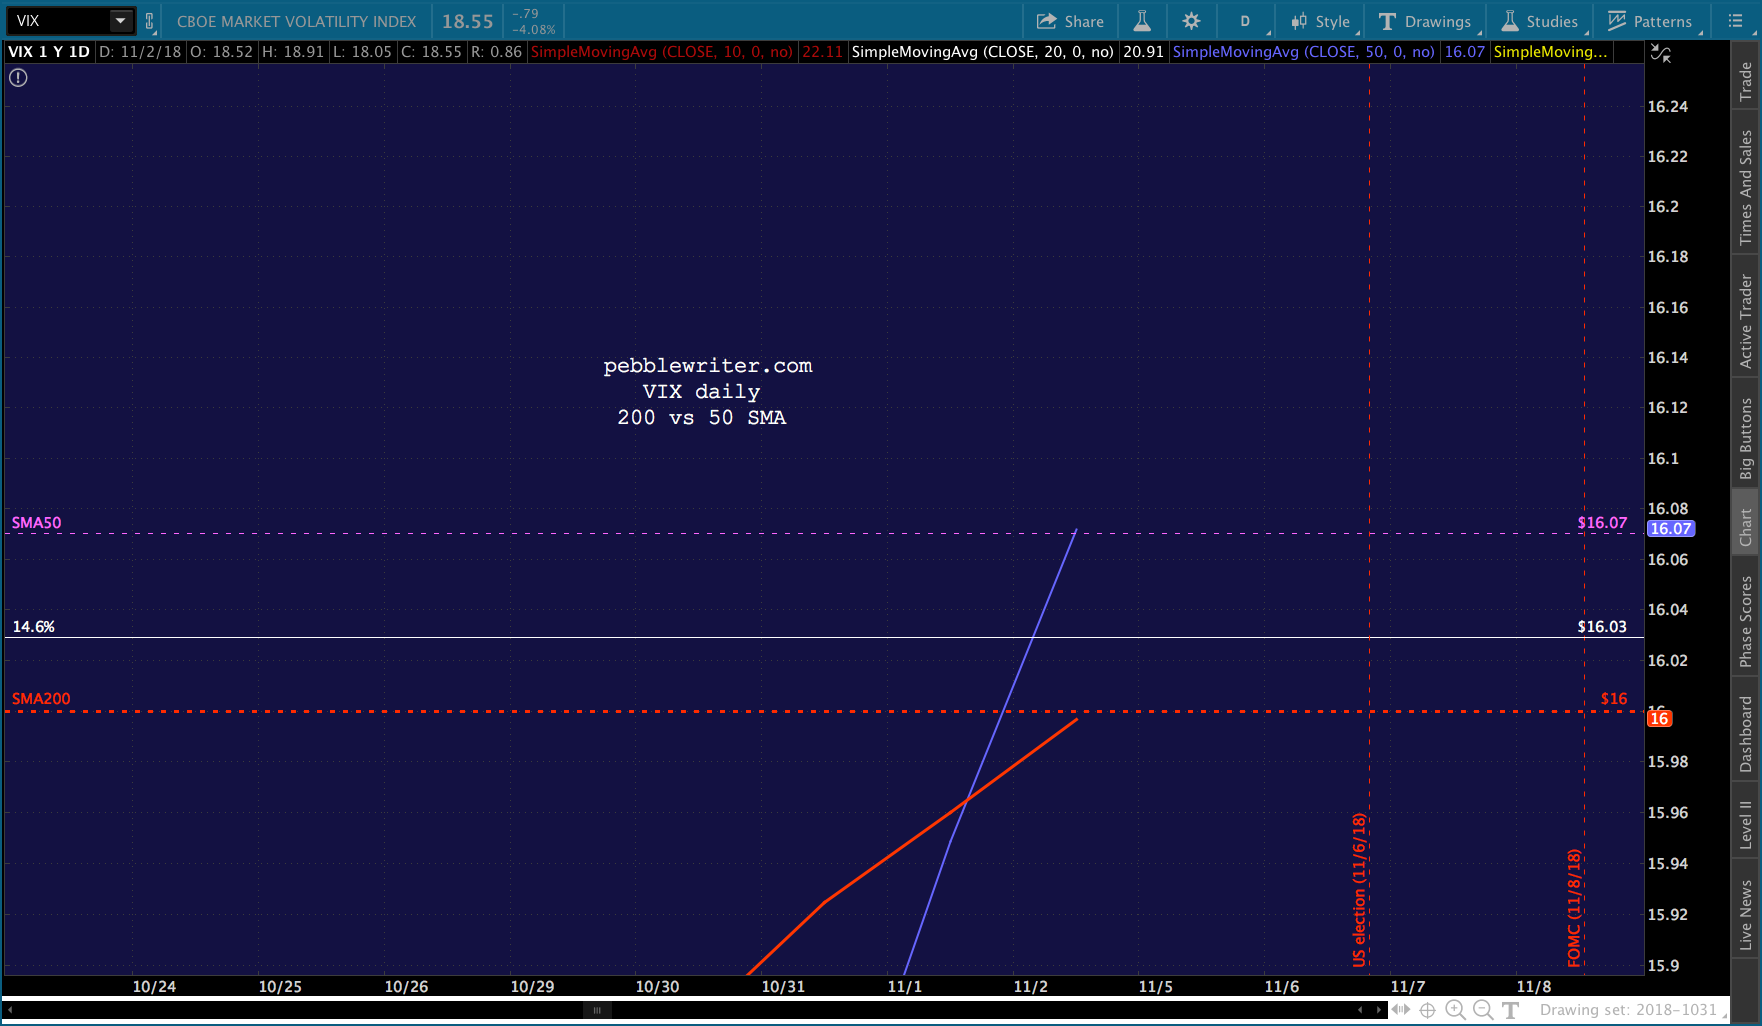
    Futures melted up to backtest the SMA200 early this morning and have since fallen 16 points to the algo-darling SMA5 200.  It remains to be seen how the mixed messages being sent up from Washington and Cupertino will play out.  But, for now, I’m leaving our targets in place.For the moment, at least, VIX’s 50/200 cross is on again.continued for members(more…)

  • Engineering AAPL’s Breakout

    The big news yesterday was AAPL’s market cap reaching $1 trillion.  For chartists, however, the big story was the breakout shown below.

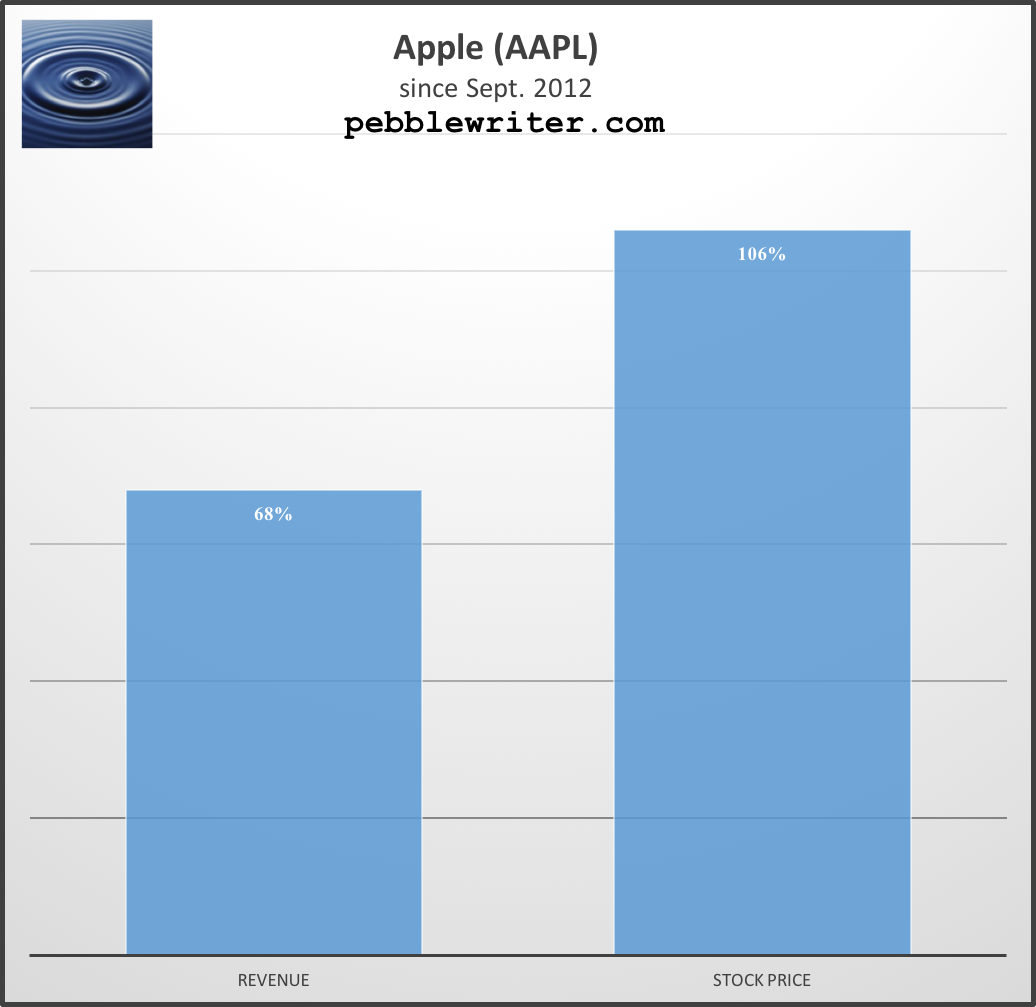
    It’s hard to overstate the importance of this move.  Just a few days ago, the stock had broken below a trend line dating back to April 27 and was retreating from its 2.24 Fibonacci extension.  From a charting standpoint, it was in trouble.Revenues have grown 68% since that first market peak in 2012 — about 9.04% on an annually compounded basis (based on estimates of $263 billion for FY2018.)  The stock price, however, has grown 106%, a compounded annual rate of 12.9%.

    Those who follow AAPL know it has been the poster child for stock buybacks.  The board has approved a total of $310 billion since Apr 2012.  Might this activity account for some of the stock’s success?  Let’s take a closer look.

    $310 billion is a lot of money.  But, consider that the average daily trading volume in AAPL in the 1,600 trading days since the program started was $5.7 billion.  In other words, the entire program comprises about 54 days worth of volume.  Fifty-four out of 1,600 — could it make much difference?When we compare the announcements to stock prices, we can see that most were beneficial.  When we compare them to chart patterns, though, the extent of the benefit is startling.  As they say, timing is everything.

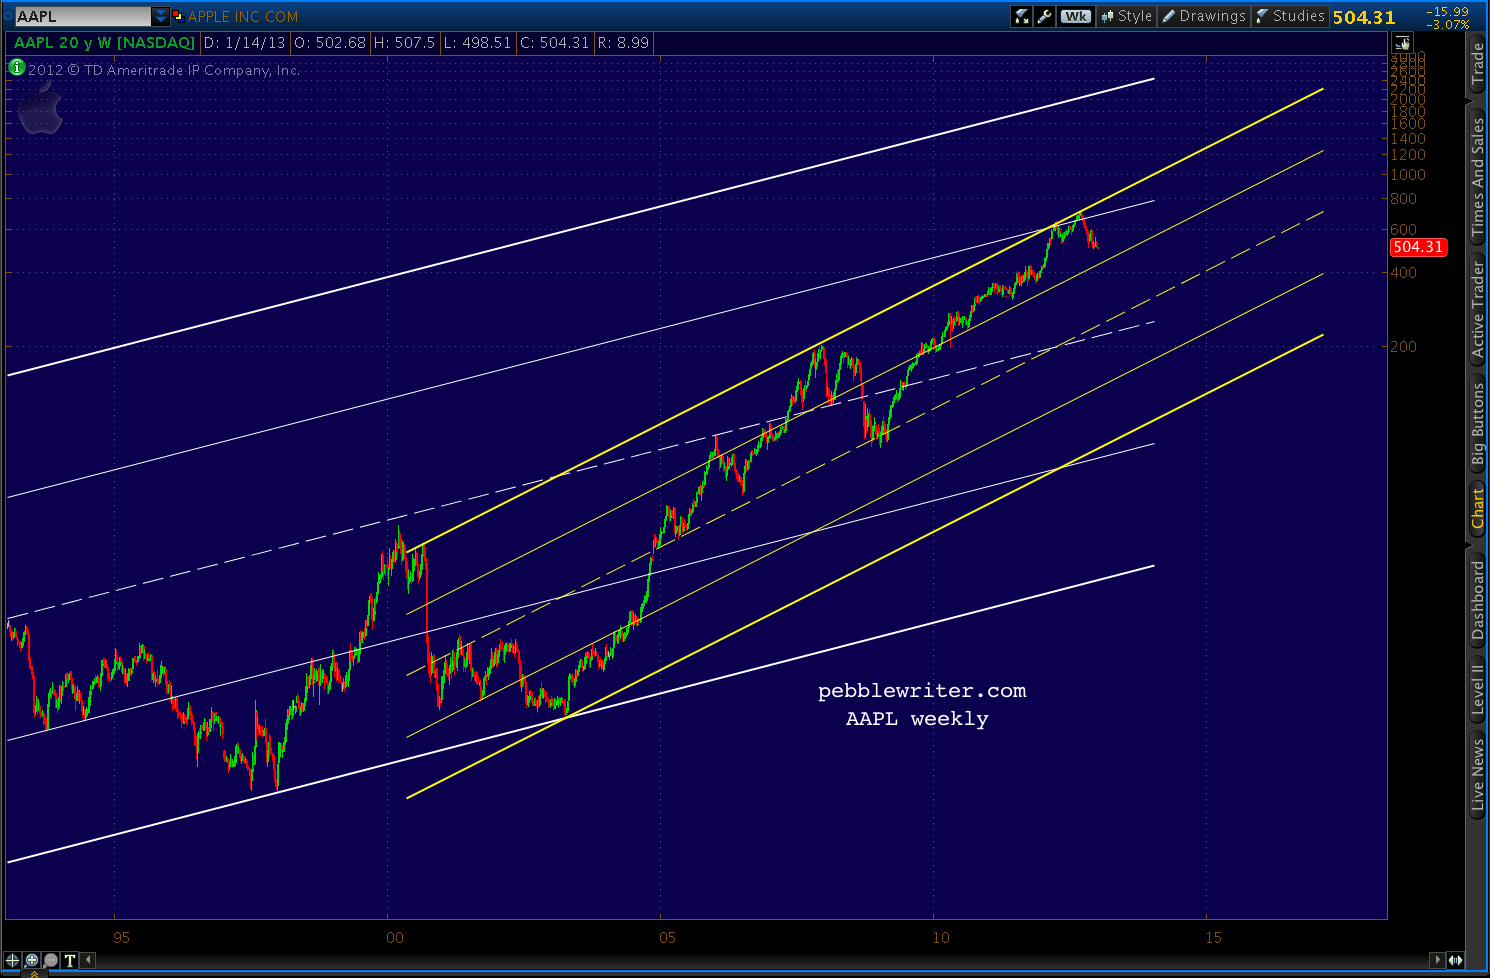
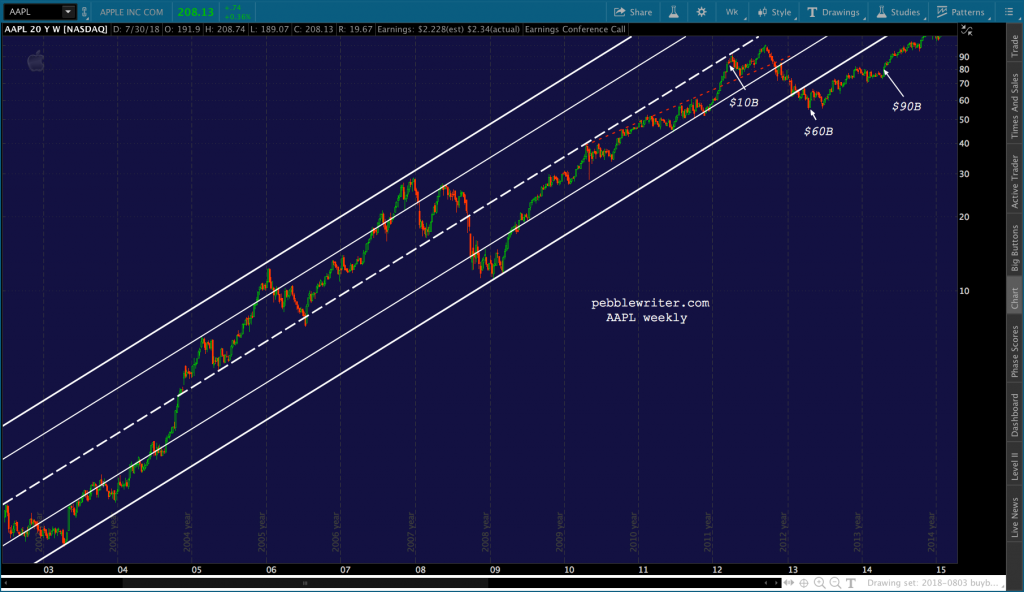
    $10B Announcement (2012):  I don’t know what prompted this first announcement, but it came shortly after the stock had broken above a trend line (red, dotted line below) going back to April 2010.  The company also announced outstanding earnings and the resumption of dividend payments, the first time since 1995.$50B Announcement (2013):  This one is a little more obvious.  Not only had the red trend line given way, but the white channel which had guided prices higher for the past decade had broken down.
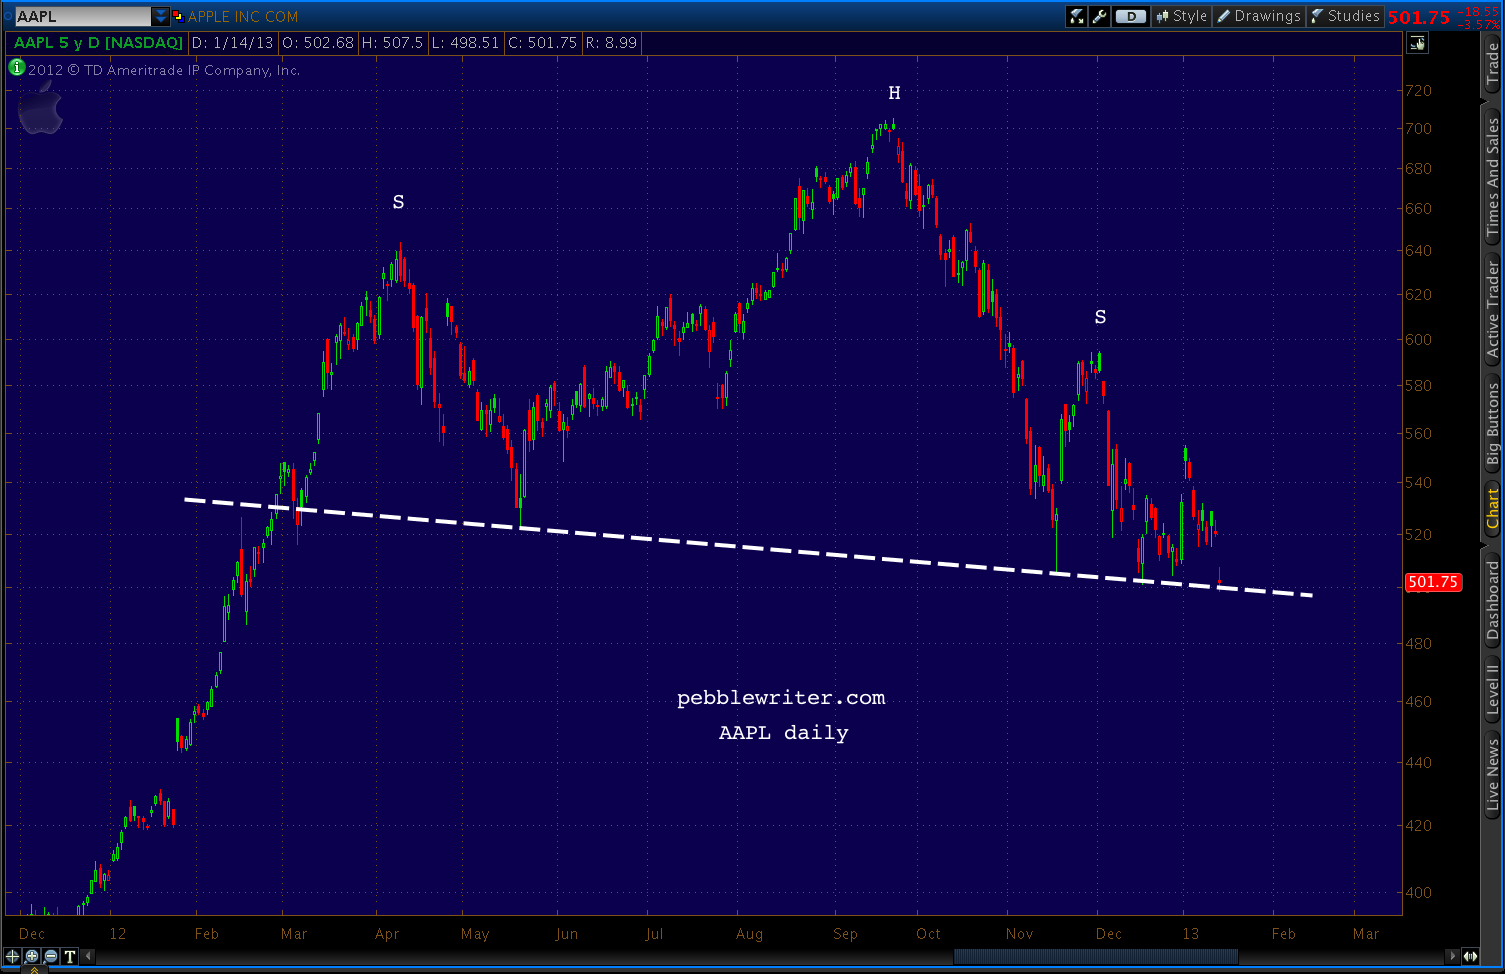
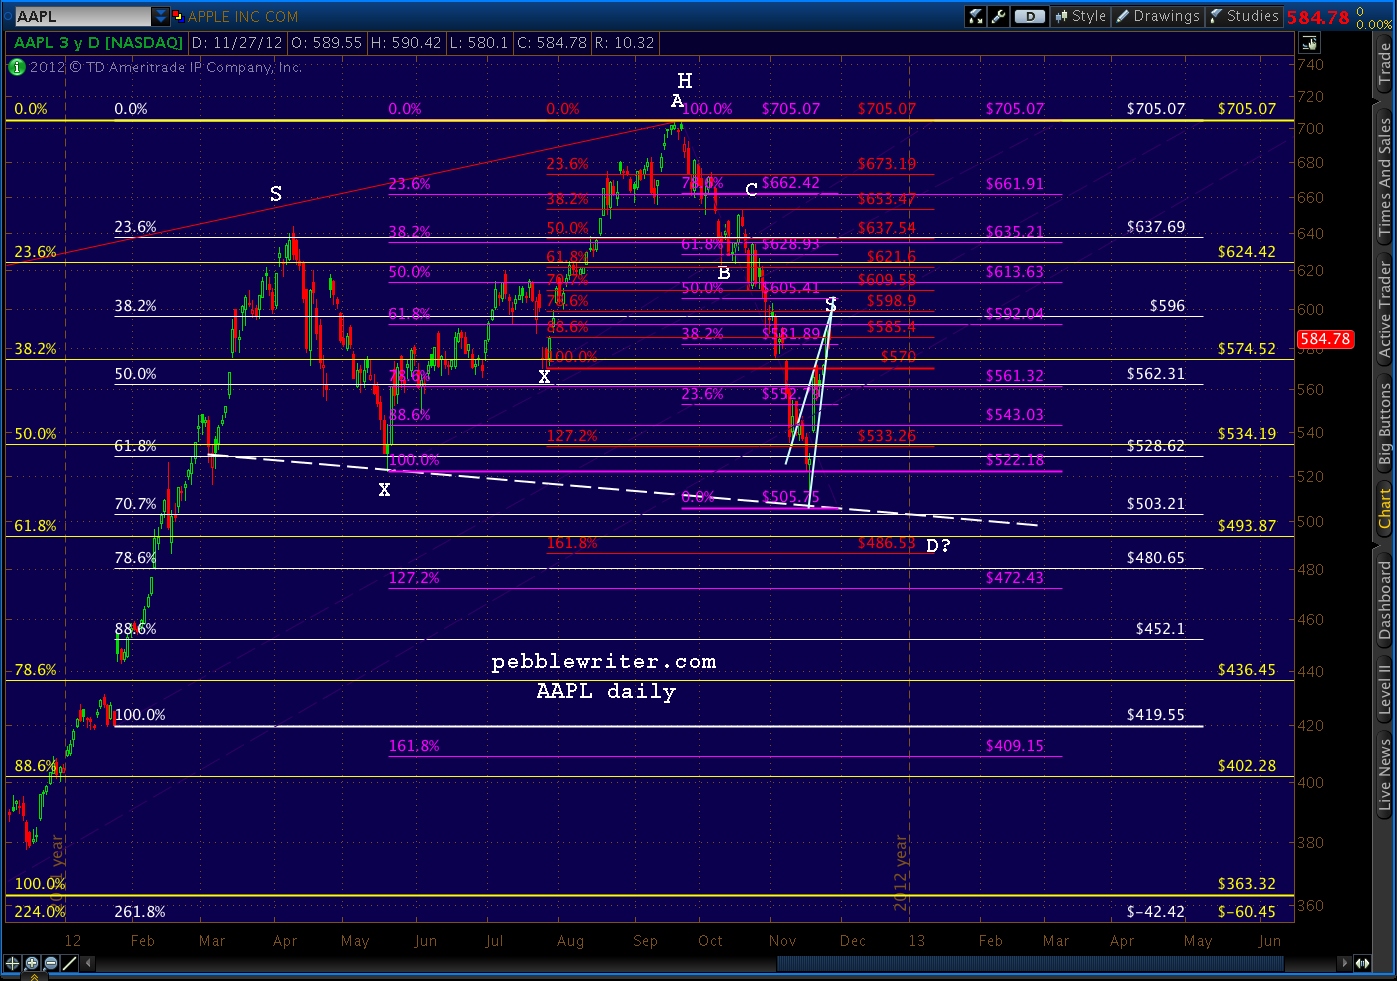
    As I warned in November 2012 [Update on AAPL] and again in January 2013 [AAPL: Flirting with Disaster], AAPL had completed a Head & Shoulders pattern that targeted the June 2011 lows. The losses from the Sep 2012 highs would have exceeded 50%.

    The massive $50B addition to the share repurchase plan held AAPL’s losses to a “mere” 45%.  Unbeknownst to us at the time, it also established the gently rising purple channel AAPL just broke out of.$30B Announcement (2014): In November 2013, Carl Icahn — who had accumulated $2.6B since August — filed a shareholder proposal to encourage Apple to distribute $150B to shareholders.

    In addition to Icahn breathing down its neck, Apple’s stock was having a tough time.  Keep in mind the rising white channel was still broken down.  In addition, a rising wedge (in yellow below) had formed and broken down.

    Last, the stock had reversed just shy of its .618 Fib and been unable to rise above a Fibonacci fan line (yellow, dashed) from its 2012 highs.  Increasing the share repurchase plan by another $30B seemed to help.$50B Announcement (2015):  Fortunately for Apple, someone had convinced them to pay attention to Fibonacci patterns along the way.  Unfortunately for Apple, the action they took in April 2015, when AAPL reached its 1.618 extension and the top of the small, white channel from early 2013 wasn’t enough to stave off the effects of the S&P 500 having reached critical resistance [more on this later.]

    Despite the announcement on April 27, AAPL topped out the next day.  It struggled to stay aloft until late July, but finally succumbed, tumbling 31.6% (compared to SPX’s 12.5%) by the time the broader market bottomed out on August 24.

    $35B Announcement (2016): The 2016 expansion was purely defensive.  Having held horizontal support when the market bottomed out in February, AAPL had failed in its attempt to hold the purple channel midline or break out of the trend line (red) connecting its recent highs.  It was also dipping perilously close to its September 2012 highs (100.72.)

    The $35B addition wasn’t enough.  The company reported its first quarter-over-quarter revenue drop since 2003 and its first year-over-year drop in iPhone sales ever.  The stock gapped down 8%, wiping out nearly $50 billion in market cap in a day.  It would take three months to recover.

    $35B announcement (2017): A rising tide lifts all boats.  So it was in April 2017 when SPX has broken out past important resistance and AAPL needed just enough to hold its 1.272 Fib and purple channel .786 lines.  This was a tweak, and an earnings beat and upbeat guidance — along with the iPhone X launch — helped the stock hold its own when it revisited this level two months later.$100B announcement (2018):  Apple has apprently spent every dime of the $210B previously announced.  That’s six years of timely support, lucky bounces, fortunate developments, $100 million paydays.  Could you walk away from it?  Neither could Tim Cook.

    The $100B just announced couldn’t have come at a better time.  The stock has been struggling with the purple 1.618 extension at 162.39.  It failed to punch through in August 2017, made it through in October 2017, plunged back below it in February 2018, screamed above it a week later, and tumbled back to it on Apr 24.

    Had the biggest share repurchase plan expansion plan ever not been announced 5 days later, the stock likely would have dropped through the 1.618 and the bottom of the rising red channel.  But, we’ll never know.Clearly, it was enough to create a bounce off of those, push through the purple 2.24 extension, and break out of the rising purple channel on yesterday’s Q3 earnings report.  As “luck” would have it, AAPL managed to close 0.53 above the purple 2.618 extension today.

    Effects on the Overall Market

    The AAPL chart below shows SPX’s key Fibonacci levels as they have played out since 2012.   AAPL’s announcements line up quite well with key breakouts and backtests.

    • SPX’s break out past its .786 Fib which marked the 2011 highs (Mar 13 vs Mar 19, 2012)
    • SPX’s break out past its 2007 highs at 1576 (April 23, 2013)
    • SPX’s backtest of its 1.272 extension at 1823 (Apr 24 vs Apr 13, 2014)
    • SPX’s attempt at its 1.618 extension (topped May 20 vs AAPL’s Apr 27, 2015)
    • SPX’s break above the trend line from 2015 highs (Apr 26, 2016)
    • SPX’s break out past a smaller pattern 1.618 (Apr 24 vs May 1, 2017)
    • SPX’s recovery after dipping below its SMA200 (7th time was a charm – May 3 vs May 1)

    The same info from SPX’s point of view:

    Since investors (algos) have come to rely on Apple’s buyback announcements every April, we may as well put these on our calendar.

    In Conclusion

    It seems clear to me that the timing of Apple’s buyback announcements played an important role in the stock reaching its recent highs.  If the company published the actual transactions, I suspect we would find that they were instrumental in overcoming resistance and holding support.

    From an earnings standpoint, this sort of financial engineering is clearly beneficial.  Borrowing money to buy back shares increases EPS and shifts dividend expense (non-deductible) to interest expense (deductible.)

    Is it a good thing that AAPL has managed to break out and achieve a $1 trillion valuation?  I doubt there are many shareholders who would complain.  Employees who own stock or whose employment prospects are enhanced by Apple’s success are probably happy, too.  So, what’s the problem?

    In a Harvard Business Review article Profits Without Prosperity, William Lazonick makes a pretty good argument that buybacks represent stock manipulation.  By driving prices artificially higher, corporate executives increase the value of their stock awards and options — about 83% of their compensation.

    He further argues that funds going toward repurchases could be better spent on innovation, employee (the other 99%) compensation, and productivity improvements.  Although I can find no fault with Mr. Lazonick’s conclusions, I’m a chartist – not an ethicist.

    My goal is to accurately forecast price movements.  So, when I consider the effects of Apple’s repurchase program, I think about price manipulation and market integrity.  Equities are subject to substantial price manipulation from many sources, exacerbated by the fact that only 10% of trading volume is conducted by fundamental, discretionary traders.

    As the largest component of the stock market (4.25% of the S&P 500) and the largest component of the FAANG stocks — which contributed over 100% of the S&P 500’s gains during the first half of 2018 — AAPL will continue to exert a great deal of influence.

    Of course, influence works in both directions.  Some feel that Apple has reached a plateau in terms of innovation.  At some point, a slightly different screen size and slightly faster processing speed might not produce an increase in sales.

    And, competitors certainly haven’t conceded the race for market share.  Since buybacks were first announced in 2012, Apple’s share of smartphone sales have actually dropped from 23% to 12.1%. I have owned Apple products ever since my first Titanium Powerbook in 2001.  I enjoyed the “oohs and aahs” it drew from passersby.  My family uses Mac computers and iPhones exclusively.  And, I can’t imagine ever leaving the Apple environment.

    But, I only recently upgraded from my iPhone 6 (not waterproof, as it turns out!) out of necessity.  I could have lived with it for another year or two, no problem.  I’ve owned the laptop and Mac Pro sitting on my desk since 2013 and see no need to upgrade.  Of course, I could be an outlier.

    But, Apple reported Wednesday that iPhone sales increased just 1% year-over-year.  The average price of an iPhone increased substantially, from $606 to $724. But, with real retail sales and wage growth stagnating lately, I question whether a 20% increase is sustainable.

    Bottom line, Apple’s share repurchase plan is a force to be reckoned with.  It has helped propel the stock to historic levels — and, beyond.  Now, all Apple has to do is deliver.


    Related posts:

    Update on AAPL: Nov 27, 2012
    AAPL: Flirting with Disaster
    AAPL: Is it Safe?
    Update on AAPL: Jul 31, 2013
    Update on AAPL: Aug 19, 2013
    Update on AAPL: Dec 23, 2013
    How Exposed is AAPL?
    AAPL: Still Tasty?



  • How Exposed is AAPL?

    The longstanding rumor is that earnings will disappoint.  The more recent rumor — which has kept the stock on the rise all day and into the after-hours — is that the company will greatly increase the share repurchase plan and dividends.

    I have no special insight or inside knowledge about its earnings, unit sales, or plans to return our money to us (a bribe, to continue owning its stock?)  But, if it does disappoint and the stock takes a hit, just how exposed is it?

    Short answer, a lot.

    A drop below Friday’s lows could do quite a bit of damage — which is why Apple will probably announce a pretty impressive addition to its repurchase program.

    If it does, the stock will remain above its SMA200 and be on its way to new highs in no time.  It’s working on an IH&S that targets 226ish.GLTA.

  • Update on AAPL: Jul 31, 2013

    It’s not often I get the chance to plug a future competitor.  As some of you know, my son Kyle is helping me out this summer.  He will graduate in December with an Economics major and Personal Financial Planning minor from Texas Tech University in lovely Lubbock, TX.

    In addition to performing many rather thankless duties for me, he has spent a fair amount of time learning the ropes of charting and technical analysis.  I asked him his opinion on AAPL the other day, and am pleased to present his analysis.  FWIW, I think he did a very nice job.

    It wasn’t the easiest of assignments.  Since our bottom call on April 19 [see: Is it Safe?], the stock quickly rallied to our upside target (a nice 20% gain), then promptly gave back almost all of those gains.  After all is said and done, he feels bullish about the rally continuing – a forecast with which I agree.

    I hope to lure Kyle back after he graduates for more of the same.  Though, he seems pretty excited about the financial planning field.  Those of you in the biz who would like to chat with this bright young lad about his career plans, feel free to drop me a line.

    *  *  *  *  *

    AAPL rose sharply following its earnings release last Tuesday.  EPS was $7.47 on revenue of $35.3 billion. Both numbers beat Wall Street estimates. Analysts had been expecting EPS of $7.34 on revenue of $35.18 billion.

    It shot up 25 points, breaking through the midline of both the rising purple channel and a large falling channel (in white below) from the 705 high.  It backtested the white channel midline, then shot up yesterday to complete a Bat Pattern (yellow) at the .886 of the drop from 465 on May 7.

    The completed Bat Pattern could pay off with a drop to backtest the white channel midline around 430-433 (the last Bat Pattern – from 469.95 on March 25 – fell much more sharply, retracing .886 of its rise.)

    Such a pullback could ultimately be bullish, as it could form the right shoulder of another IH&S (red) that targets 525 – only a few points away from the 1.618 extension (522.39) of the 469-385 drop beginning March 25. This target intersects with the top of the white channel around August 5-12.

    But, given that the recent low was slightly higher than the April lows, a large IH&S Pattern has already completed.  It could go ahead and play out now.

    The current rising purple channel doesn’t intersect with the top of the white channel until lat August/early September, about the time it passes through the latest Bat Pattern’s extension to the 1.618 at 513.26.

    Both of these bullish scenarios assume that AAPL is able to beat its former highs of 465 and 469.95.  Many potential harmonic patterns on the way down from 705 have been unable to.  In fact, each successive high has been lower than the last.

    But, for now, we’ll remain bullish with a target of 514 by late August and 570 before the end of the year.

    GLTA.

  • AAPL: Is it Safe?

    Owning AAPL shares these past seven months would have been about as much fun as having your annual cleaning done by Nazi war criminal with a penchant for pain and a disdain for novocaine.

    It might seem like it’s been in a free fall, but AAPL’s tumble from 705 has been very aptly guided by a well-defined channel, a few chart patterns and, to some extent, harmonic patterns.  The channel that’s been eating away at AAPL is shown below, along with two recent Head & Shoulders Patterns that helped it on its way.

    But, it’s the chart patterns and the harmonic patterns that suggest AAPL is due for a substantial bounce.  Whether it turns into something more than that will depend on whether it break free of the falling channel from hell.

    This is the set of major channels I’ve used for the past several months of charting AAPL.  Note that the purple channel broke down a few weeks ago, prompting the latest plunge.

    But, AAPL should find support at the .75 line of the white channel around 380-385.  This is an equally well-defined channel that dates back 20 years.   Because channel placement is as much an art form as science, I like to have confirmation from other sources.

    In this case, the harmonic picture is also quite bullish, at least in the short term.  There are quite a few potential patterns from which to choose.  But, note how the overlapping of several key Fibonacci retracements in the 391-395 range.

    This group, seen better in the close-up below, includes the purple .786, the white .618, the yellow .500 and the red .886.

    AAPL pushed down through them like they weren’t there yesterday, prompting many to wonder if it was heading much lower.  But, the channel lines mentioned above should provide the bounce that will bring them back into focus.

    As to the purple channel, it’s done.  I’ve added a new, red channel that should take over going forward.  If we get the bounce I expect at 380-385, it will have been proven.

    Where does AAPL go from here?  There’s still the not-so-small matter of the large H&S pattern that completed back in December (in white, above).  Recall that it targeted around 305.

    If the large white channel shown above should fail, that’s a distinct possibility.  The falling white channel from 705 has shown remarkable staying power. And, the next lower gathering of key Fib lines is at 307-317.

    But, I suspect the big white channel will provide a significant bounce before any new lows occur.  The top of the falling white channel is currently around 435 (though obviously dropping daily), and at 380, AAPL will have nearly met the price target of the latest H&S Pattern to complete.

    If the overall market rebounds Friday as I expect, look for AAPL to perk up and participate.  A H&S pattern that’s brewing on SPX could easily take prices up to the 430 range.

    If the overall market continues past 1597, AAPL could finally break out of its funk and — more importantly — that falling white channel.  Another backtest of the broken purple channel at 466ish would be a great initial objective.

    Stay tuned.


  • AAPL: Breaking Out?

    AAPL has bounced nearly 50 points since its Jan 25 low, leading many to wonder whether the worst is over.  When I started this post about a week ago, all the talking heads were talking “breakout.”  We’ll give the old crystal ball a polish and see whether that’s likely.

    When I posted that AAPL seemed to finding support back on the 24th, it was because of the long-term channel (in purple, below) that’s guided its upside since the year 2000 [see: That All You Got?] The top of it, by the way, is up around 1775.

    AAPL bottomed the next day at 435 (one point from our Nov 27 forecast), and obviously still hasn’t broken that channel.  The channel top, by the way, is currently up around 1880. [note: these long term charts are as of Feb 6.]

    As we’ve noted before, there are other long-term channels at play, too.  Note the white channel casts a rather bearish pall, while the yellow channel promises at least a bounce here.  So, which to believe?


    GETTING HERE

    We’ve been very fortunate in forecasting AAPL over the past several months, calling several significant tops and bottoms with decent accuracy.

    Nov 8:  Harmonics Are Your Friend:  

    It looked like AAPL was about to bottom out, followed by a sizable bounce.

    “AAPL should get a brief bump higher as SPX does — perhaps to 600 or 620.  Of course, if it stalls there, it will have formed 5/6 of a huge H&S pattern… “

    It bottomed 6 sessions later when the S&P 500 dropped down to tag our 1344 target  [see: Charts I’m Watching Nov 15.]  From there, we were looking for a bounce to 600.

    Nov 27: Update on AAPL:

    As AAPL approached our 600 target, I anticipated a reversal and completion of a Head & Shoulder Pattern that would bounce first at the neckline before plunging below.

    “A reversal here could quite likely spell a return to the channel bottom — which will be around 434…

    …it’s easy to imagine a scenario where prices drop to [the neckline at] 500 into the end of the year, but can’t quite seal the deal on the H&S pattern…

    If, on the other hand, AAPL breaks down below [the neckline], look for a back test followed by a more serious plunge.”

    AAPL topped out two sessions later at 594 and plunged to the neckline at 501 where it failed to “seal the deal,”  bouncing for two weeks before finally falling below the neckline on Jan 15.

    It back-tested the neckline for a week before taking a “more serious plunge” down to 435, one point from our original Nov 27 target.

    GOING FORWARD

    The purple channel has done its job so far.  The big question is whether it can continue to stave off the damage of the completed Head & Shoulder Pattern.  H&S Patterns commonly back test their necklines.  Back tests can even exceed the neckline, as has AAPL’s in several cases.

    As we’ve discussed many times, AAPL has been in a fairly tight price channel all the way down from 705 (below, in white.)

    The upper bound of this channel intersects with the H&S neckline at about 498-500 around Feb 19 (there is some wiggle room, depending on exactly how the channel is drawn.)  This likely represents the extent of any short-term upside.

    As for the downside, the white channel midline intersects with the purple channel at about 450-452 around Feb 20.  The white upper bound intersects with the purple channel bottom  465 on Mar 18.

    But, note the large red falling channel.  It’s dicey to consider it well-established, since the “top” consists of only one tag.  But, it looks to me like it has potential over the medium-term.  Today, AAPL is testing its 25% line; and, a close above 473 or so would be positive — arguing for the more bullish of the two scenarios above.

    The daily RSI recently poked up through the white midline and the yellow 75% line, but appears to be backtesting both.  This would be consistent with a dip to 450, where AAPL could back-test the white price channel midline and the purple channel bottom (the purple circle).

    From there, the top of the yellow RSI channel beckons — which probably corresponds with a return to test the neckline around 500.  As noted above, this could occur as soon as Feb 19 if prices are to remain in the white channel.

    And, what if prices break out of the white channel?  Keep an eye on the RSI.  A break above the neckline would probably require a break out from the yellow RSI channel.  While, remaining in the yellow channel probably means a period of consolidation until early May, when the purple channel and neckline intersect at about 490.

    One other issue often discussed is the expiration of the 30-day wash sale period.  The biggest volume spikes in the past few months were the plunges of Nov 16, Dec 6, Dec 14 and Jan 24-25.  So, the only remaining relevant buyers who might rush back in are those who sold in the 435-465 range on Jan 24-25.

    Since the stock has gained a few points since then, these sellers might be expected to believe the worst is over and that it’s safe to re-enter at these levels — especially since the rest of the market is setting new highs.

    SUMMARY

    My best guess at this point is a test of the purple channel bottom around 450-455.  If it bounces, it has potential to the white channel top around 495.

    But, it’s important to note that AAPL just closed a huge gap.

    60-min RSI shows support coming up from a channel midline (white) as well as a rising channel bottom (purple.)

    If the channel bottom breaks down, the H&S target is way down around 304 — only a short hop from the yellow .618 at 317 and the white .786 at 307.

    GLTA.

  • Because We Said So (wait, what’d we say?)

    Just as we were getting a tad nervous about simmering currency wars, the G-7 announces there are no wars — everything is fine.

    Then, a G-7 official announces that everything is fine except for the Japanese — who are obviously sort of fighting a little war (see Brainard’s endorsement of same…)

    From Reuters about 30 minutes ago:

    But, really, everything is fine…except that by now the markets don’t know which way is up anymore.  Hopefully by the time the pub crawl lands in Moscow, they’ll have their story straight.

    The USDJPY, which had fallen to its channel midline following the Japanese Finance Minister’s comments that the yen’s fall had, perhaps, been a touch more than anticipated, rose on Brainard’s comments, fell on the first G-7 statement, and rose on the second.

    The pair remains in our target area, but I wouldn’t put any money on it staying there – or anywhere for that matter.  With the press releases flying, who knows where it’ll land when the music stops?

    The EURUSD is suffering from it’s own case of vertigo. In a now familiar refrain, the Germans and most northern EZ countries are just fine with the euro’s strength, while the more fragile economies of France, Italy, Spain, Portugal, Greece, etc. are taking it on the chin.

    The equity markets have been all over the map, albeit in a tight range the past week. SPX is testing 1518 for the 6th time in less than three sessions.

    Apparently, the market can’t accept our assertion that it’s time to sell off.  I don’t know why… Goldman did.

    Speaking of Goldman, Apple CEO Tim Cook is speaking this morning at their Tech Conference.  Apple will offer a live audio feed HERE.

    As discussed yesterday, I’ll add an intra-day long to cover any push above 1518.57 — which might be expected after the little IH&S pattern on the 5-min chart.

    continued for members(more…)

  • That All Ya’ Got?

    AAPL soars, market soars.  AAPL plunges, market yawns.  Sure, makes sense to me.  One can only guess as to how much effort went into propping up the markets this morning in the wake of the earnings miss.

    Have you ever heard so many laudatory comments about the stock everyone loved to hate only months ago: NFLX?  Gotta love it.

    Regardless, AAPL has gone exploring spelunking lower Fib levels and the rest of the market is up, which presumably means we’re presently on the right side of the market.

    AAPL should firm at 450.85 this morning — the 1.618 of the Crab pattern dating back to Nov 16 at 505.75 (light blue.) Personally, I’m an enthusiastic buyer at these levels (with stops, of course.)  I previously set the large white pattern Point X at 354 on Oct 4, 2011.

    But, moving it to the June 20, 2011 310.50 level (just as legitimate, if not more) means AAPL just tagged the .618 retracement of the 310-705 move.


    But, the biggest reason of all to be short-term bullish on AAPL is the purple channel — the bottom of which AAPL just tagged. The stock could certainly fall below it, but this sucker dates back to the year 2000.  I have a hard time believing the channel will fall after what amounts to a minor estimate miss.

    Does the company have problems?  Sure.  I worry about the obvious decline in customer service and a slowing product cycle.  But, it also has the means, the manpower and the motivation to fix what’s ailing the stock price.

    Stay tuned.

    UPDATE: 1:15 PM

    The markets have sold off from their highs, but seem to be finding RSI support.  APPL is, doing the same.  For those who find the bounce idea compelling, here’s another chance.


    UPDATE:  1:50 PM

    Watching to make sure the price channel and RSI channel both hold on SPX…

  • AAPL: Flirting with Disaster

    Not since the summer of 1666, as young Zack Newton sat pondering gravity, has so much attention been paid to a falling apple.

    Should we care about AAPL’s deteriorating powers of levitation?  The $200/share drop since its September highs, especially on the heels of a new dividend and share buyback program, has been unnerving.  But, if you invest based on fundamentals, it’s a solid company selling at 11 times earnings and a 62% 5-year CAGR — which happens to be on sale.

    If you pay attention to chart patterns, however, AAPL is flirting with disaster.  It’s a mere point or two from completing a Head & Shoulders pattern that targets the low 300’s. [To read about how H&S patterns work, click HERE.]

    Even if you don’t give a darn about chart patterns, know that many other investors do.  The four tags of the white trend line (the neckline) in the past month are ample proof.  So are the many previously completed patterns that weighed on AAPL.

    In January 2008, AAPL completed a H&S pattern that saw share prices drop from 200 to 115 in a few short weeks.

    Buyers at 115 were rewarded with a rebound to 190, then punished by a plunge to 78 as the rebound completed a right shoulder in a much larger H&S pattern.

    Not every pattern plays out, of course.  Consider the pattern below — a well-formed pattern that targeted much lower prices.

    Instead of a big drop off, AAPL found channel support before much damage was done.  Prices rebounded to new highs where they formed a new pattern (in white) which did play out.

    Like any other chart pattern, H&S patterns don’t occur in a vacuum.  Channels and harmonics often influence the ultimate outcome.

    The channel that saved the day in 1995 is still with us, though it most recently offered resistance to higher prices instead of a floor.  It’s the white channel in the chart below.

    The much smaller, steeply rising purple channel, on the other hand, has kept prices rising — putting AAPL back on track after two significant sell-offs.  It’s currently around 445 — within a few points of the Crab Pattern 1.618 extension of the failed mid-November rally.

    If the current H&S pattern plays out and AAPL drops below the purple channel support, there’s another, less bullish channel that could come into play — seen in yellow below.

    The next lower channel line is in the vicinity of the purple line referenced above: 430 or so.  But, if gravity takes hold, mid-line support doesn’t show up until around 300.  Ouch.

    There are a dozen or more other patterns that could easily influence AAPL’s future (consider, for instance, the grey channel I’ve sketched in — the mid-line of which marked this morning’s lows.)  There are also many fundamental events that could strengthen the price.

    The company’s current share buyback scheme, for instance, is only $10 billion — about the average daily volume at $500/share.  But, with $120 billion in cash on the books and virtually no debt, the company could easily expand it to a more meaningful level.

    If this most widely held stock were to crash, could the rest of the market be far behind?  I think there’s little question it would. Such an outcome would spell disaster for the bullish story line that TPTB have been working so diligently to construct.

    Might they join company insiders in supporting the stock here at 500?  It would be a lot cheaper than another round of QE and, in the end, probably more effective.

    Stay tuned.

    UPDATE:  1:00 PM

    This morning, AAPL reached the downside targets we identified back on November 27 [see: Update on AAPL: Nov 27, 2012.]   My thoughts at the time were that AAPL (then at 590) was about to reverse and retreat to the 500 area where we were likely to get a bounce before breaking down to 472-493, with 486 being the sweet spot.

    Here’s the chart I posted back then, showing 486 as the (Crab Pattern) 1.618 extension of the 570 – 705 rally between July and September.

    AAPL did, in fact, reverse at 594 a few sessions later — forming a now-obvious right shoulder.  It bounced not once but twice at 500ish before completing the Crab Pattern this morning.

    The chart below shows the actual price moves overlaid on that Nov 27 forecast.

    With this morning’s plunge, AAPL also tagged the .618 of the 354 – 705 rally (from the Oct 4, 2011 low) and the 1.272 of the small Butterfly pattern discussed above.  The fact that it did so without a comparable sell-off in the general markets is potentially significant.

    I certainly won’t discount the possibility of a bounce off the 1.272.  But, a close below 500 does significant damage to the upside case.

    continued for members(more…)

  • Charts I’m Watching: Jan 14, 2013

    ORIGINAL POST:

    The dollar is making a stand at the upper end of the target range I charted Friday, but hasn’t yet broken out of the steep falling channel.  While there was a turn at the .618 Fib that would justify a .786 completion (a Gartley), the more obvious Point B was at the .382.

    In a perfect world, this would signal DX has further downside potential to the .886 for a Bat Pattern completion — though, obviously, not every corrective wave has to be a harmonic pattern.

    The EURUSD similarly reached a common turning point at the 1.272 extension of the latest move down from Dec 19 (or Jan 2, take your pick.)

    But, as can be seen, the rally from last week features no potential Point B whatsoever.   It’s hard to call this a Butterfly Pattern in the absence of an actual pattern.

    Furthermore, the tails on the daily candles offer an even more aggressive upper bound for the rising wedge we’ve been charting for the past several weeks.

    Equities are pointing to a soft opening, but nowhere near what one would normally expect with horrid AAPL news on the tape — much less the approaching budget showdown.

    Regular readers are well aware of the importance of the 500 price level for AAPL.  As we’ve discussed many times, the completion of the H&S pattern could have dire consequences for AAPL and the entire market.

    continued for members(more…)