I took the day off from tree-watching to develop a better view of the forest. Here’s what I came up with.
First, recall that harmonic patterns are what brought us to this point in time. They occur on a regular basis, and are believed to play out successfully about 70% of the time. Here’s one of the first ones I posted about last May, a Gartley pattern that came within 1.5% of predicting the 2011 pattern high. It called for 1381, and we topped out at 1370.
Some investors are mystified by harmonic patterns. But, they’re really just a series of failed breakouts that retrace at Fibonacci levels. Prices start with a move from a turning point called X to another turning point called A. From A, prices attempt to retrace the just completed move, but fail — typically making up only 38.2% to 88.6% of the distance. This is point B.
Prices then reverse again, trying to retrace the just completed move. Again, they fail, only retracing 38.2% to 88.6% of the distance — our point C. Here, they reverse again and try to get back to the starting point X. In some harmonic patterns, such as Gartley and Bat patterns, they fall short — retracing only 78.6% to 88.6% of the original XA leg.
In others, namely the Butterfly and Crab, they zip past X and establish D at an extension of the BC and/or XA leg. The retracement that establishes B typically tells us whether we’ll stop short of or extend beyond X.
When they reach point D, harmonic patterns reverse. Here’s an updated look at that first Gartley from May. Note how prices reversed at the .786 Fibonacci retracement, falling first to the .50 level before rebounding to the .618 level at 1230 on Aug 31.
The primary target for a Gartley pattern is the .618 retracement of the AD measurement. In the case of SPX, that means 935. Gartley’s don’t always reach their targets, and many traders just play the reversal and grab a few points without worrying about the long term targets. But, for forecasting purposes, we assume the .618 retracement unless other factors come along and exert greater influence.
It’s always helpful to have confirmation, such as trend lines, other harmonic patterns, technical indicators, chart patterns, candles, correlated instruments and even fundamentals. In the case of SPX, we have many. Let’s start with Fan Lines.
Fan lines are nothing more than trend lines drawn between important turning points (highs and lows) in price. They’re pretty easy to see from looking at a chart. For SPX, some of the most important emanate from the Oct 2007 high of 1576, intersecting with important turning points over the last year or two. I’ve labeled them on the above chart with letters A-G.
Like all trend lines, they often go on to influence future price movements. Fan line B started off as a trend line connecting the opening prices on October 11 and 15, 2007. It then remained irrelevant until early January 2011, when it influenced several days in a row. Then, on Mar 16, it halted a 90-point slide from the Feb 18 high.
In so doing, it achieved elevated status — a potential influencer of future price movements. It played such a role on Aug 31, putting a lid on a powerful 130-point advance. Because it stopped both a powerful decline in March and an even more powerful advance in August, it joins the fan line Hall of Fame — and it hasn’t even retired yet.
The best fan lines mark major “steps” in price action. In declines, they serve as support to a certain point; then, when prices finally push below them, they serve as resistance. In price advances, the order is reversed. Fan lines 1, 4 and D are great examples — along with B, of course.
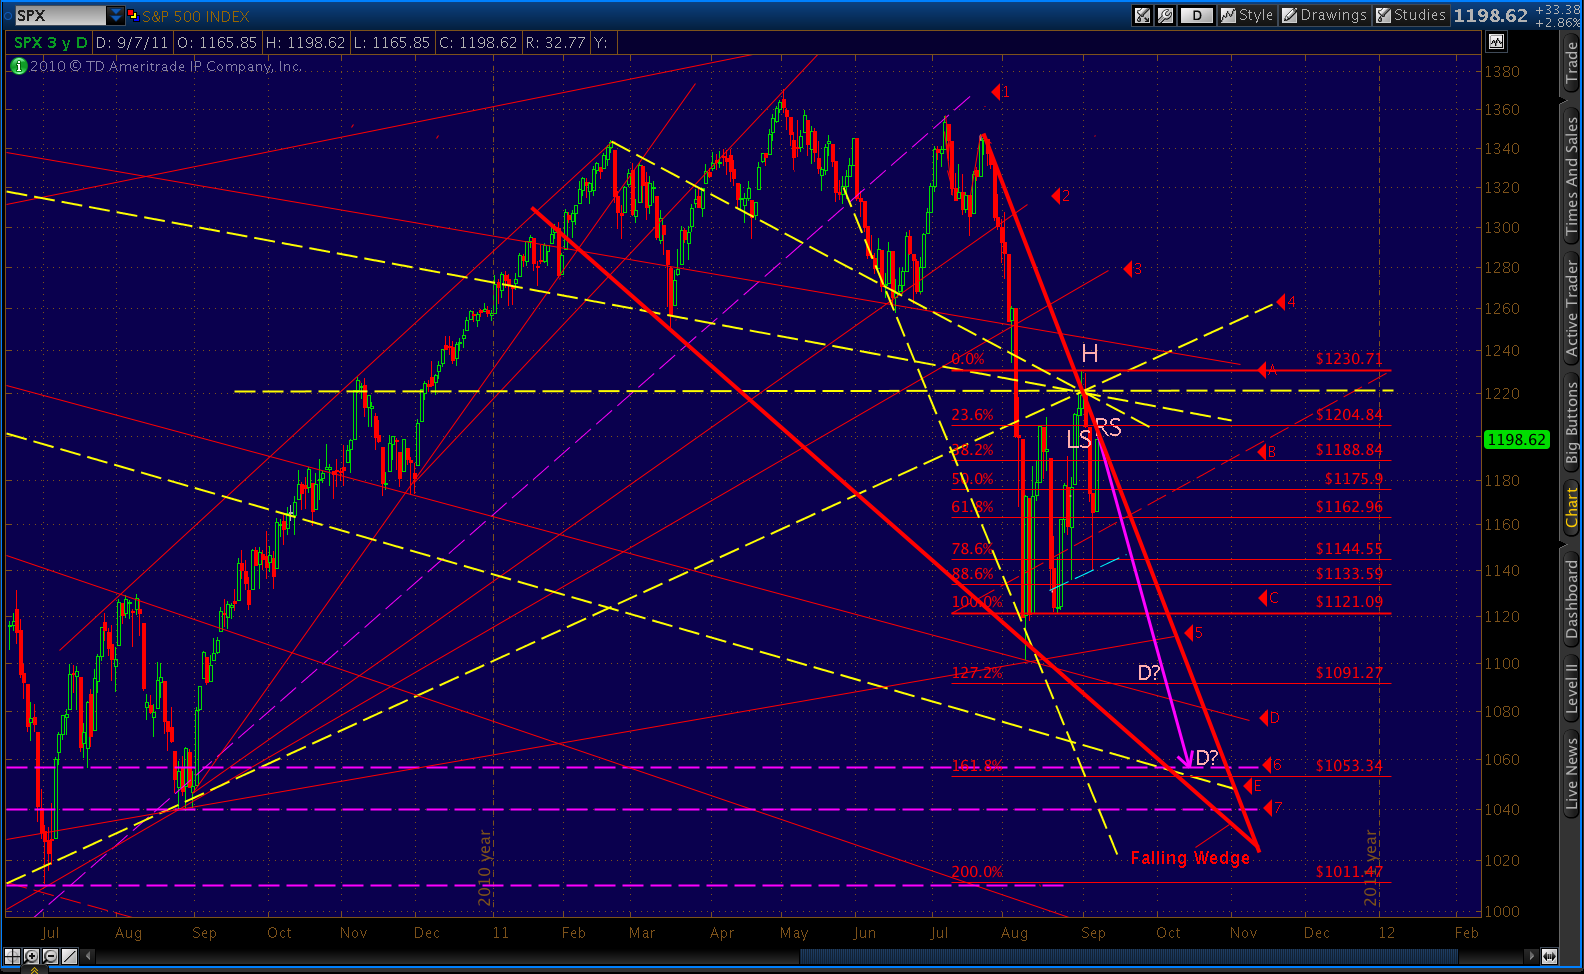
I’m always very interested in intersections of important fan lines, as they frequently mark major turning points. Fan lines 4 and D intersected on Aug 31 at what was also: (1) a trend line from horizontal support (from 3 years ago, no less); (2) a trend line from the Feb 18 high; (3) a trend line from the Jul and Aug 2010 lows (#4); and, (5) a channel from the July highs. A five-way intersection draws my attention every time — especially when it’s confirmed by other elements.
Let’s assume for the moment that Aug 31 marked an interim high at 1230. What kind of confirmation might we have? For starters, the channel SPX has followed since the July highs passed through the closing price of 1219 on Aug 31. Tomorrow, Sep 8, it passes through 1200 or so.
We’ve also established four of the five necessary points for a Butterfly pattern, with Aug 31’s 1230 high being point A and today’s 1199 high very close to a perfect point C. Point B was a .786 retracement. At 1203, C would be a .707 retracement. The final point D would optimally be a 1.618 extension of AB, or 1056; although, a 1.272 extension at 1091 would also be acceptable.
It’s pretty obvious that a Butterfly point C at 1199-1203 would also serve as a great right shoulder in a Head & Shoulder Pattern. Depending on where it crosses the neckline, such a pattern would have a target of around 1053 — almost identical to the 1056 Butterfly target.
Zooming out, we can see that both the 1053 and 1056 targets remain within the falling channel. In fact, they are located right at the intersection of the channel, fan line E and horizontal support at 1056. That’s three fan/trend lines combined with a Butterfly and H&S; target — another one of those nifty intersections.
While we’re at it, it’s worth mentioning a potential falling wedge setting up on the daily chart. It terminates in 1030 area; though, we usually don’t reach all the way to the apex before a breakout.
Of course, if we do head down towards 1056, we’ll complete a very large H&S; pattern that indicates a downside of 820. The neckline is essentially trend line #5. This target, even lower than the Gartley target of 935 mentioned above, is completely consistent with my view that we’ll break 666 within the next six months.
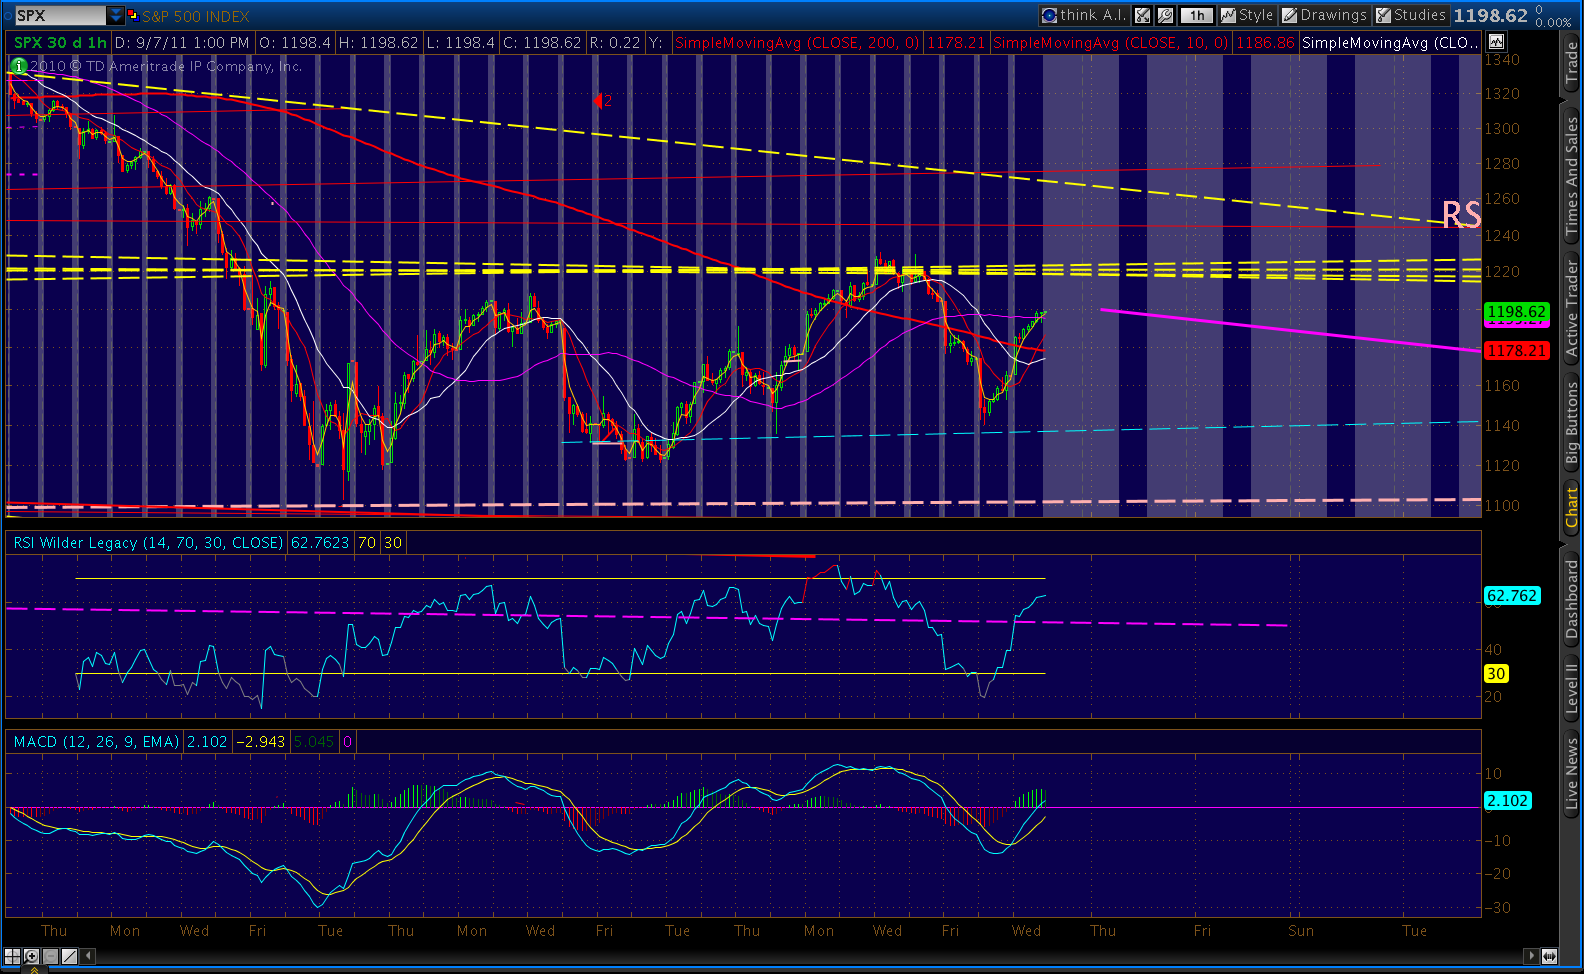
A couple more things… I find it interesting that we’ve reached the vicinity of the downward sloping trend line on the daily RSI, and other technical indicators are possibly turning negative. The daily histogram looks to be setting up for a lower high, while the 60-min is pretty clearly topping. The put-call ratio and bullish percentage might also be rolling over. While many of these indicators could still go either way, they appear to be on the cusp of a change, indicating a coming reversal.
If we break out of the channel, the short term bearish case gets a little dicey. But, it all depends on where we close for the day. Although the Butterfly looks fine with point C at the .707 Fib level, it would work just as well with a high of 1210 (the .786 level.) So, again, we’ll see if we can close at or below the channel upper bound. We’re in a very ripe bear flag pattern, and it should play out in the next day or two.
We appear to be finishing wave 2 of 5 of 1 down. If so, wave 3 down should be more powerful than what we’ve experienced thus far. If we clear the channel, it will likely mean we’re in wave 4 of 1 down, with a 5 of 5 to come.