EOD: 11:15 PM
I have a feeling tomorrow’s going to be a busy day, so this is my last post for today. CPI and initial claims come out at 8:30am (5:30 for us on the left coast), existing home sales, Philly Fed and Leading Indicators at 11:00. I know things are supposed to be quiet the day before OPEX, but tomorrow could be quite the exception.
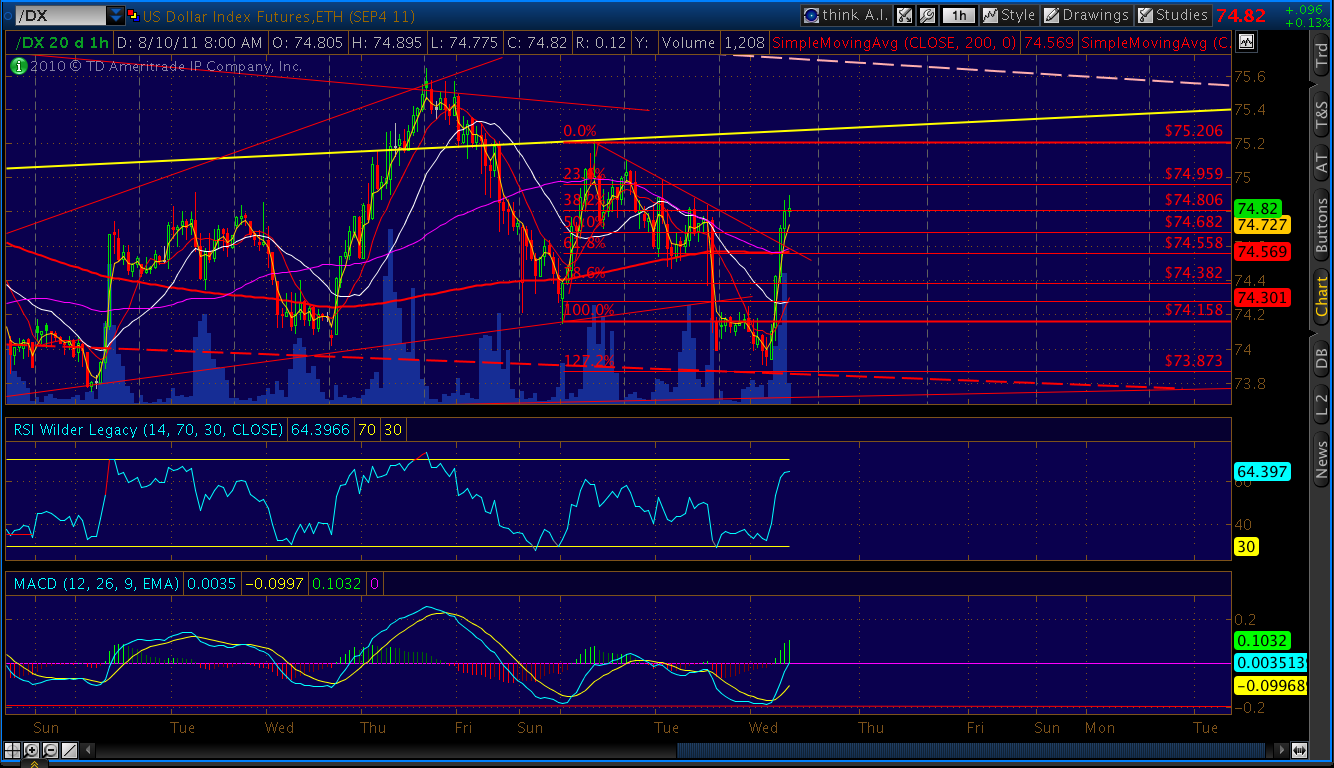
My crystal ball tells me CPI will follow the PPI path and be a little higher than most would like — a problem if you’re counting on QE. Initial claims and home sales might be the counter-argument. The dollar is firming nicely as stocks sell off tonight, so at least someone agrees with me.
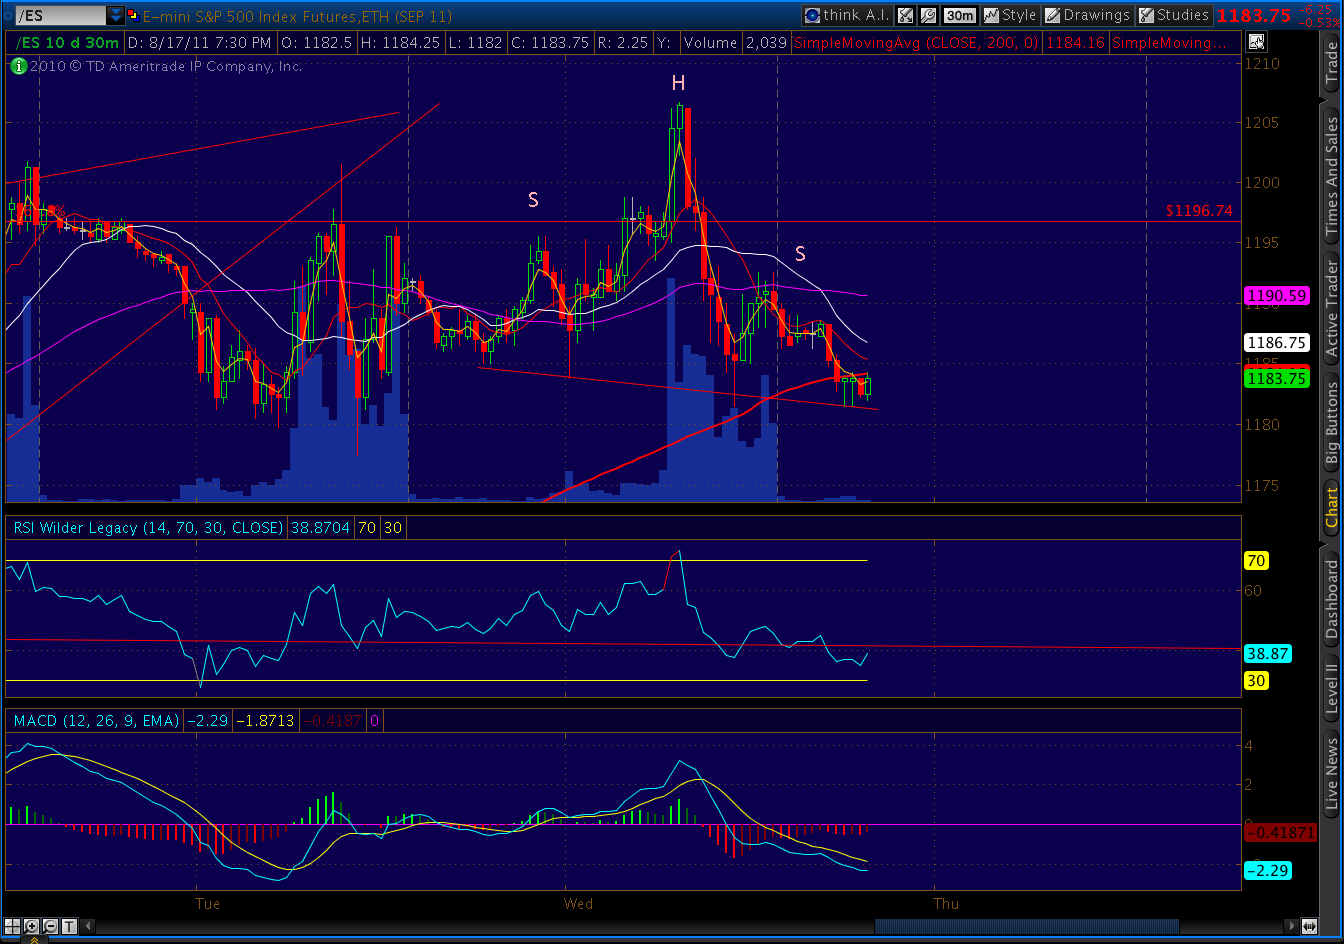
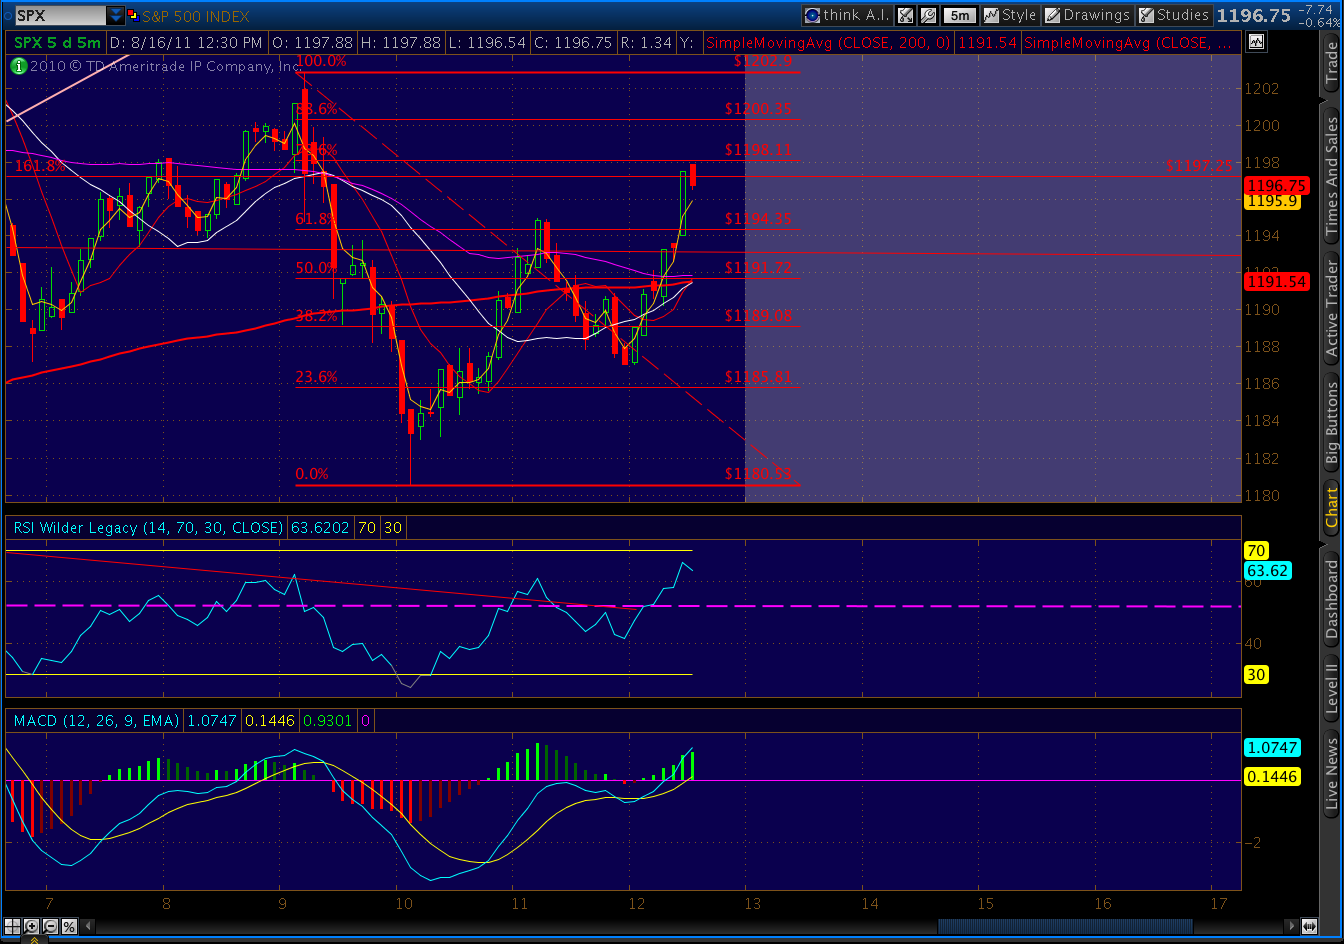
A small H&S; pattern just completed on the futures that indicates a downside of 1157 (1160 on SPX.) I still view this past week’s rise as a rising wedge that’s being backtested. The backtest is obviously taking a little longer than usual, but the case is still intact. As discussed last night, my initial goal on the downside is 1070.
UPDATE: 8:50 PM
Gold’s fundamental picture has been frustrating. It’s hard to reason with irrational zealots, and I think that’s where gold is, now. Virtually anything that happens seems to be a cause for it to go up.
Stocks down? Gold is the safe haven. Dollar’s down? Gold is the better currency. Inflation/QE coming? Gold is the best hedge. No QE? Stocks will fall and gold will protect you. One of those arguments no doubt makes sense while the rest will prove to be utter BS. But, they can’t all be right.
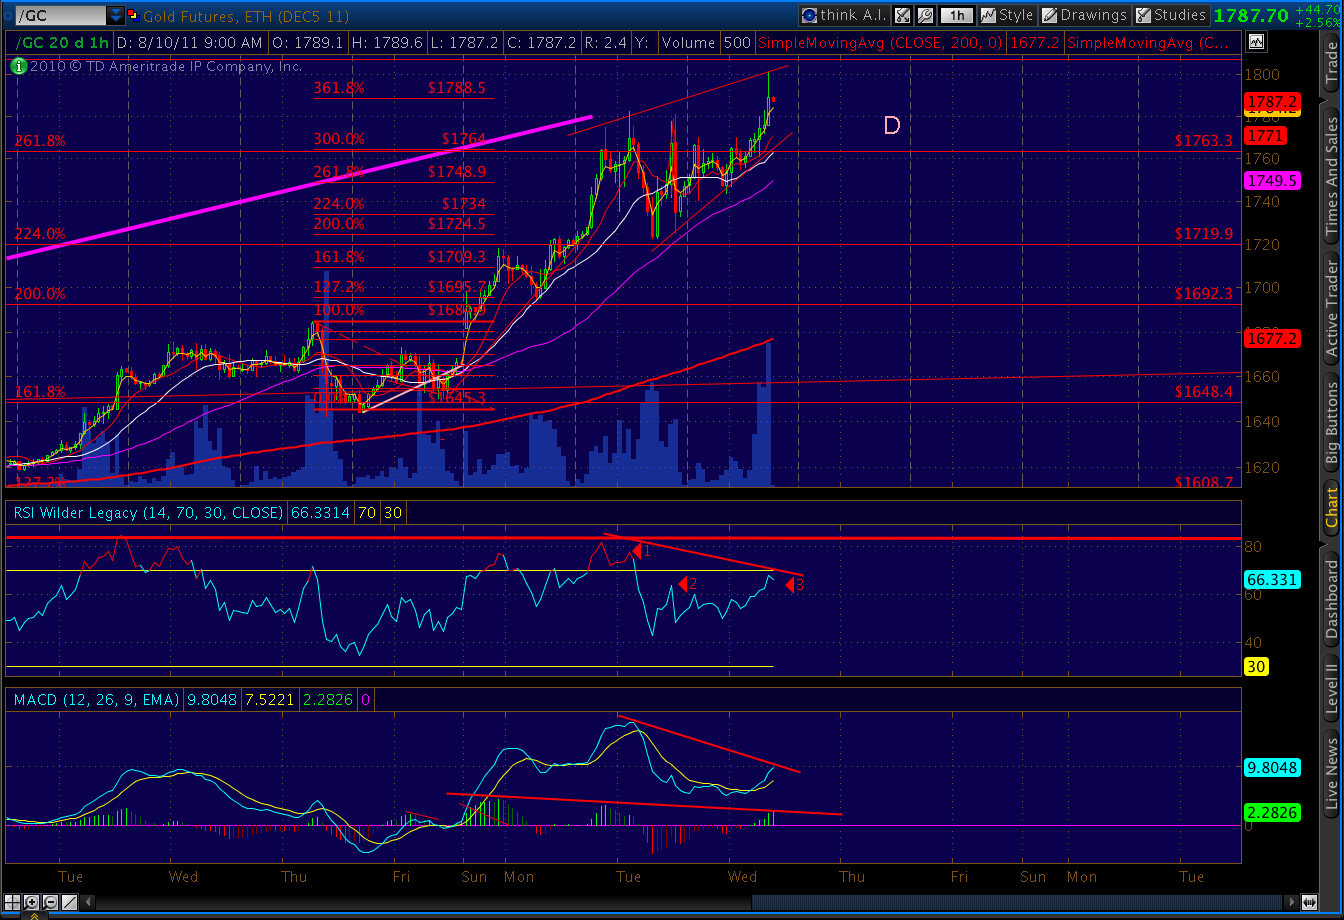
Seemingly, gold’s only kryptonite is margin increases, another one of which is likely on the way (see the yellow asterisks on the chart below.)

From a tech standpoint, I’m heartened by the narrowing range of the rising wedge. We’re still in backtest mode and have gobs of divergence with MACD and RSI. Something’s gotta give.

UPDATE: 2:15 PM
What’s behind Target’s fall from this morning’s ebullient highs? TGT had a great earnings report, right?

Maybe analysts are actually poking around, trying to make sense of the numbers. They’re right here, for anyone to see. But, many investors and far too many money managers can’t be bothered. The thought process goes something like…
Sales were up 5.1%. That’s pretty good…but, wait, same store sales were only up 3.9%. Hmm… that’s not so great…but EPS were up AN AMAZING 11.5%! [call broker to double the order]. Wait, I don’t get it… net earnings were only up 3.7%, from $679 million to $704 million.
Drilling down…drilling down….wait, what’s this? Credit card expenses were $15 million versus $138 million last year!?! That’s a huge frickin’ drop. It accounts for ALL of the increase in net earnings FIVE TIMES OVER! [call broker, cancel that order].
Credit card delinquencies have been falling nationwide, but the numbers are still pretty staggering. In July, annualized write-off rates were 7.43% at BofA, 6.64% at Citi and 4.78% at Chase. AMEX had an industry best 2.8%.
Target’s rate this time last year was 7.8%. So, how is it they’re currently running 1.0%? Perhaps the most telling note in these financial statements is the one we tend to skip right over: “unaudited.”
I’m not blaming Target for doing what almost all public companies do. They’re trying to reward shareholders in an economic environment that’s increasingly challenging. Given this morning’s increase in PPI, a crappy employment picture and disappearing consumer confidence, this may be as good as it gets.
But, the next time your broker pounds the table about great corporate earnings and wonderful buying opportunities, take a closer look. Like Target and Staples, there’s usually more than meets the eye.
UPDATE: 11:00 AM
I answered a question yesterday as to how OPEX might affect my market outlook for this week. Just noticed that the equivalent week in 2008 was also an OPEX week and ranged from a high of 1418 on 1/14 to a low of 1312 on 1/18. It was a holiday weekend, and when the market reopened on 1/22 it fell to 1274 before recovering to 1310. Food for thought.
UPDATE: 10:00 AM
The Staples results are typical of the kind of reporting sleight of hand being played on Wall St. The headline is that profits were up 36%, and EPS jumped from 18 to 25 cents.
Only when you read all the way to the end of the article do you find out that the 1.7% increase in North American sales was 0.1% before foreign currency benefits. The 15% increase in international sales was actually a 0.1% decrease before foreign currency benefits. And, $21 million of the $46 million increase in earnings was the result of a tax refund. The stock’s currently trading at 14.5, up from 12.5 a week ago.
The headline could have read: Myopic Investors Duped Again
UPDATE: 9:35 AM
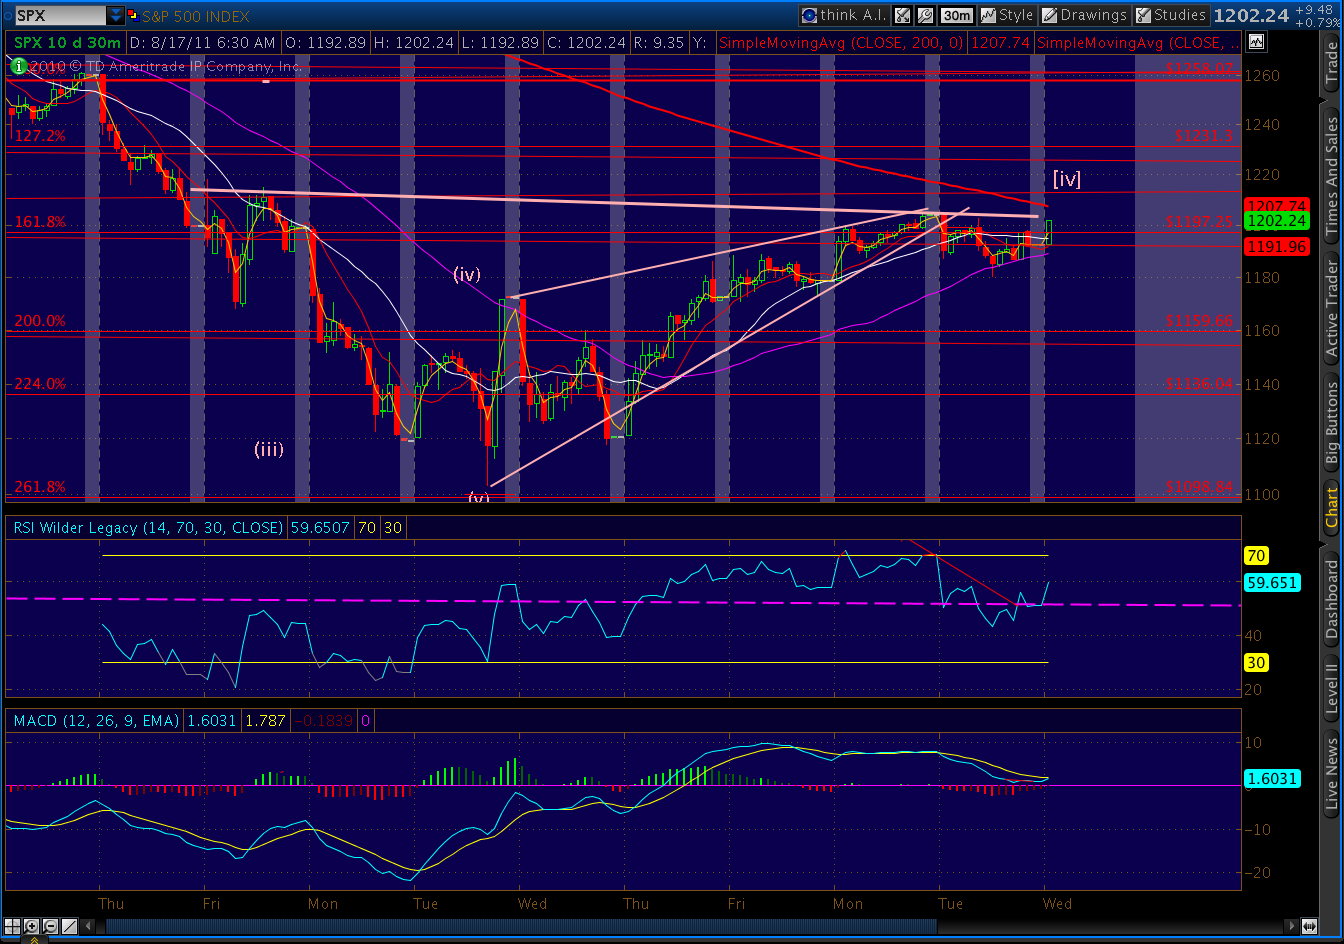
It’s ugly as these things go, but I would be remiss in not mentioning it. There’s a large inverse head & shoulders pattern near completion — seen here on the 30 min chart. If it plays out, it would indicate potential to 1308.
ORIGINAL POST: 9:25 AM
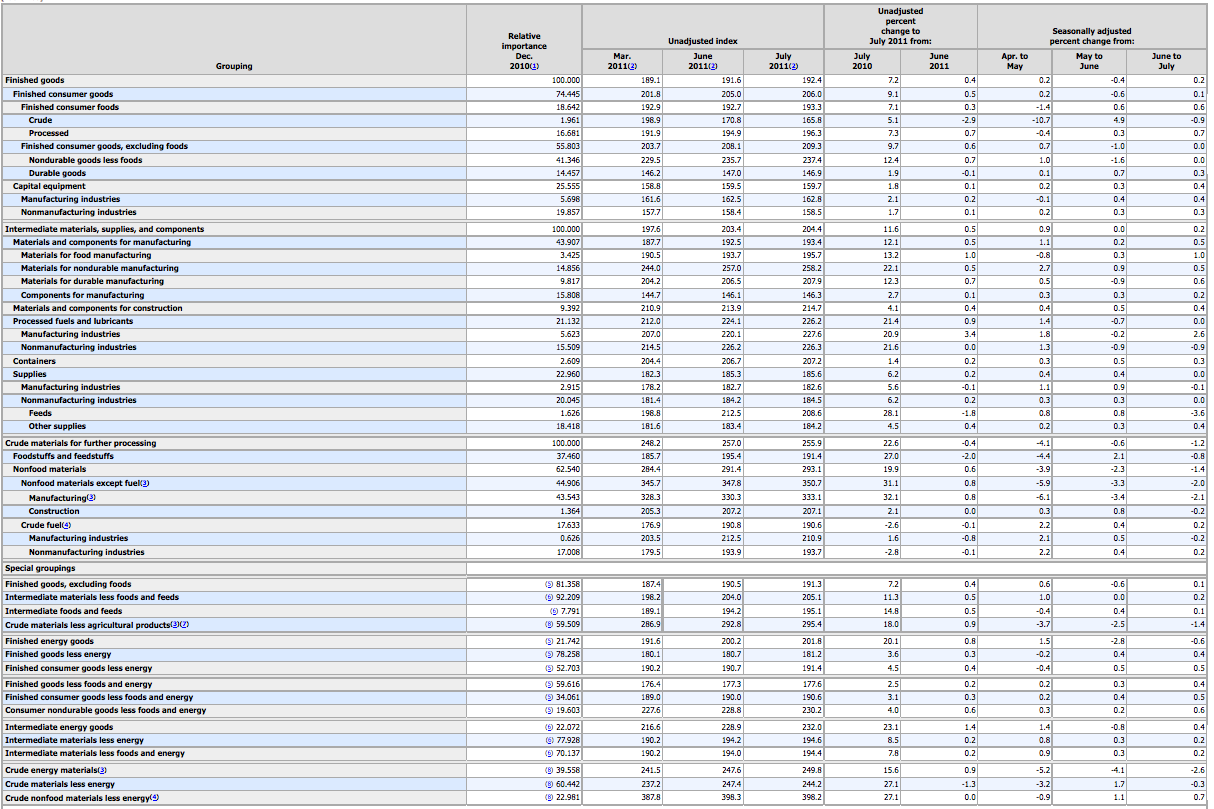
PPI reported this morning. Bottom line: a whopping 7.2% y.o.y. increase in finished goods prices might make QE that much tougher a sale. The monthly increase was .2% (versus .1% expectations) and the core increase was .4% (versus .2% expectations.)
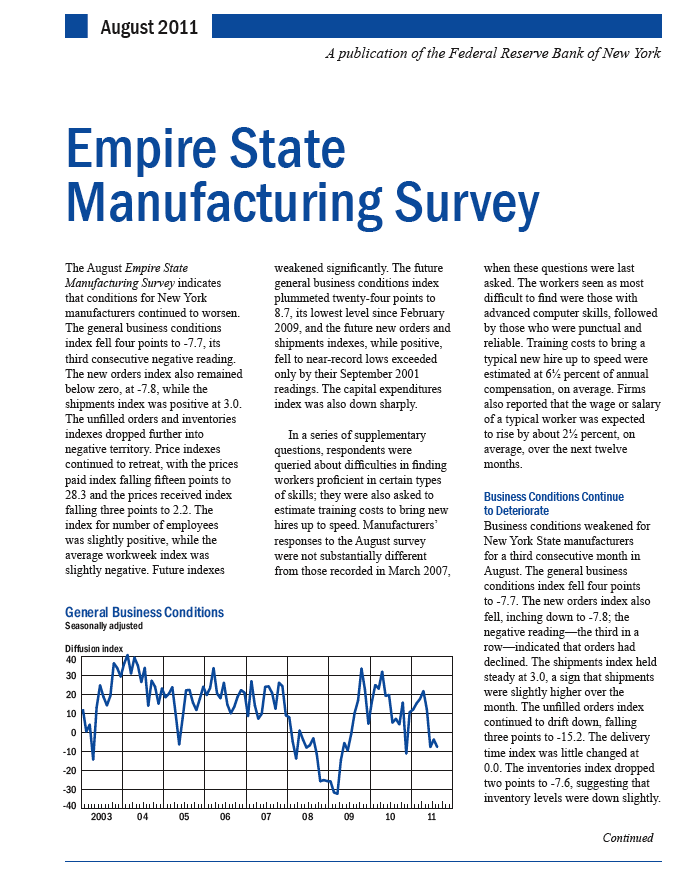
That 7.2% pales in comparison to an 11.6% increase in intermediate goods prices and a 22.6% increase in crude goods prices. Apparently, manufacturers are having a great deal of difficulty passing increased commodity costs along down the processing food chain. This reinforces the data reflected in the Empire Mfg report just out.
It’ll be interesting to see if higher prices pass through to CPI due out tomorrow.