Few stocks exemplify the current excesses of the stock market better than TSLA. In our last posted update on Jan 30 [see: TSLA on Autopilot?] we noted that it was approaching the top of a channel and a potential Fibonacci reversal point at 653.26 [131.15 post-split.] We noted at the time:
If it reverses here, the nearest support is at the 10-day moving average at 550, with 521 [104.20 post-split] being the nearest strong support and the previous high of 389.61 [77.92 post split] the next most likely.
That weekend, ARK Invest said it estimated Tesla shares would be worth about 7,000 (1,400 post-split) by 2024. And on Monday, Argus analyst William Selesky boosted his 12-month price target on the shares from 556 to 808 (161.6 post-split.)
With such bullish tailwinds, TSLA gapped past the 2.24 extension on the open Monday morning and broke out of the channel, reaching the 3.618 extension at 190.29 the following day before running out of steam. By Mar 18, it had plunged to its 77.92 previous high, shedding a stunning 64% in 6 weeks.
Since Mar 18, TSLA has soared an astounding 750%, surpassing even Selesky’s revised Aug 31 target of 566 following several sessions reminiscent of February’s blow-off top. Is there an end in sight?
With May contracts in the rear view, we wondered whether oil markets would revert to some sense of normalcy. A steep contango continues, however, with June contracts assuming the role of the panic stricken expiration month.
Futures tested our initial downside target yesterday, the Fib 2.24 extension at 2728.79, and bounced overnight… …as oil and gas prices bounced sharply off our downside targets……and VIX collapsed after tagging our backtest target.The question, as is often the case, is whether the relief rally can continue once equities’ cash market reopens. And, will SPX ever get to test its own critical support?
More fun and games from the market-rigging department…
If SPX’s rally has impressed you, check out the Nikkei. Since its Aug 26 lows, NKD is up a whopping 13.8% — more than twice SPX’s impressive 6.0%.Do what I did and google “Japan” and “economy” for the past month and you’ll see nothing but negative stories including this one which confirms a “worsening economy” even before the effects of the recent 25% increase in the consumption tax have been absorbed.
So, why the 13.8% rally? Unlike the Fed, the Bank of Japan makes no secret of the fact that it buys stocks. In fact, the BoJ and the government pension fund are the two biggest owners of stocks in the Nikkei 225.
Thanks to negative rates, investors pay the BoJ to hold their cash. So, it costs the bank nothing to buy up everything in sight. All they have to do is make sure the stocks never decline in value. This is accomplished in two ways: (a) buying more stocks (throwing good money after bad); and, (b) by manipulating the currency (the yen carry trade.)
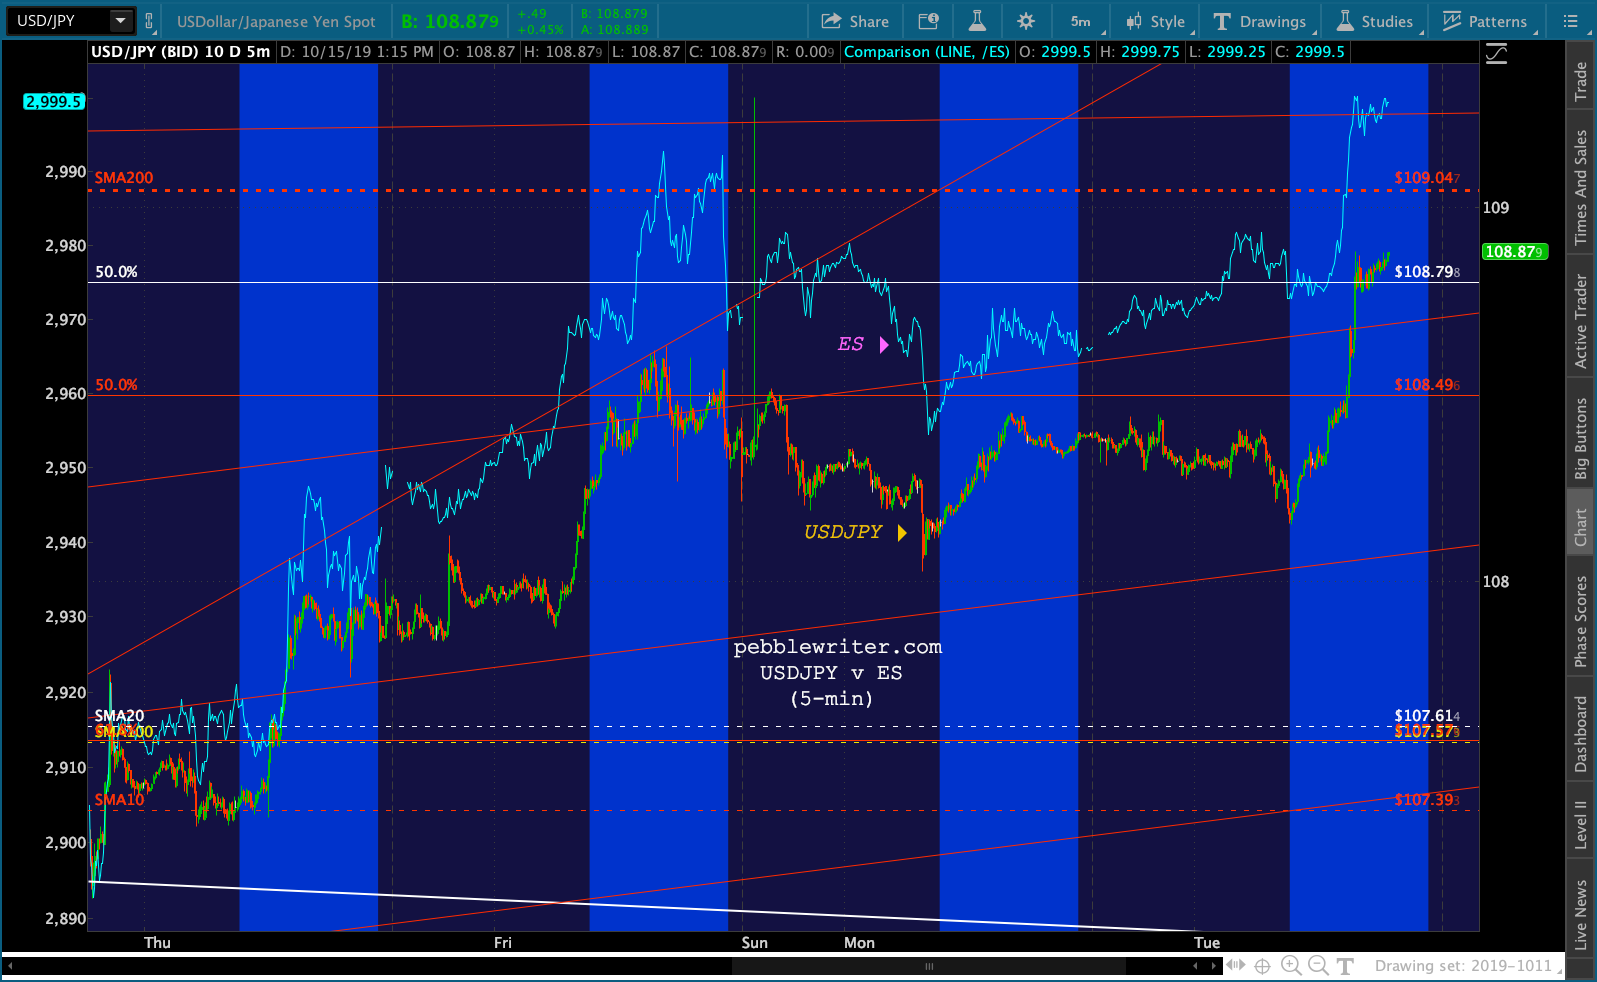
Lately, the yen carry trade has been working overtime. At some point the yen could theoretically get too cheap; so, the USDJPY is reset lower most nights when the low-volume futures markets are more easily propped up.
When the cash market opens, though, the USDJPY takes off. I’ve highlighted the period between 6:30am and 4:00pm in the chart below. The effects on the NKD are immediate. A few nanoseconds later, the S&P 500 futures join in. The algorithms which drive 90% of all US equity volume watch USDJPY like a hawk.
What happens if, for some reason, the USDJPY can’t be driven any higher or is busy resetting when extra assistance is needed? We’ve written often about the benefits derived from hammering VIX futures. Another favorite of central banks is oil futures.
As the chart below shows, it works exactly the same way as the yen carry trade. The only difference is that higher oil prices reverberate through the real economy, affecting nearly every business and consumer in fairly short order. So, the manipulation requires a little more finesse. The Fed has its own trading desk, presumably with the ability to dabble in the futures market. Their cost of funds is essentially zero as they can print money any time they like. Imagine how fun it will be when interest rates go negative and investors pay them to drive stock prices higher.
In our last dedicated post six months ago, we discussed the critical resistance DJIA faced: the neckline of a large H&S Pattern.
…it’s important to note that like SPX and COMP, [DJIA] is backtesting a point of potentially strong resistance — the neckline of a large Head & Shoulder Pattern that never completely paid off.
DJIA’s reversal had occurred 500 points short of the indicated target and was thus susceptible to another leg down following the backtest that, ideally, would align with a significant channel line or Fib level.
But, the White House had other ideas. Mnuchin planted a story with the Journal that the China tariffs might be lifted. Combined with the ongoing beatdown on VIX, DJIA sliced through the neckline like it wasn’t even there. Of course, it was careful to observe the neckline in the midst of a backtest once it was recast as support (which involved a second busted H&S.)
Since then, DJIA has ignored a potential triple top and pushed to new highs which just so happen to mark two significant points of overhead resistance. I know, I know…fool me once and all that.But, this time might just be different. We’ve been following an analog for the past two weeks which has been quite accurate so far. If it plays out, DJIA might have already peaked and could be facing a significant decline.
First, a confession. In 2004 I sat next to a guy at a Sundance Film Fesitval screening who was very excited about his company that would someday be able to play movies on your computer or even your cell phone. “Why won’t this guy shut up?” I asked myself as I scanned the theater for an empty chair.
Netflix: Looking for more subscribers?
The “guy,” of course, was Reed Hastings. At the time, they were barely profitable, having just posted their first net profit ever (a whopping $7 million in 2003.) The stock was hovering around $5/share.
I couldn’t, for the life of me, figure out how they’d ever compete against Blockbuster — which had turned down an offer to acquire the company for $50 million a few years earlier.
The 2004 annual report cover, to the left, illustrated the problem. Why wait for a movie to arrive in the mail when you could run down to the local Blockbuster and grab a copy (along with some tasty Goobers) right now?
Reed was obviously on to something and soon figured out online delivery — though he still hasn’t cracked the eGoober challenge. A $10,000 investment in the common at that time would be worth around $1 million now. Live and learn, right?
* * *
The stock is under pressure this morning as subscriber growth fell short of Street expectations and the company’s guidance. But, I’ll leave that to my fundamental brethren to suss out. My concern is that the stock will test critical support.
Last year we took a look at the chart and noted that at 400.48, it looked particularly vulnerable. From Netflix: Watch It! on July 16, 2018:
A quick glance at NFLX’s daily chart shows it has significant downside potential. The most obvious downside target is the 100-DMA at 338.73. But, the 200-DMA is approaching the white channel midline and should cross it at around 298-300 on or about August 6. It makes for a nice downside target if the SMA100 doesn’t hold. Should the SMA200 and channel midline fail, the bottom of the white channel is currently around 200 and (obviously) rising.
The stock soon tested then failed at the 100-DMA, but bounced just before reaching the midline and popped out of the falling white channel. It thus postponed the midline/200-DMA test until October 11 where it bounced yet again before plunging through to the channel bottom which, by then, was up to 230.
There are a lot of things that could happen to the stock, which has traded as low as 313 in after-hours. But, the critical level to watch is 295-300 where it would drop through the 200-DMA and test the channel bottom as well as backtest the broadening wedge (aka megaphone pattern.)
Anything lower would be very problematic for a stock which has been locked in the same rising channel for 6 1/2 years.
One note to those focused on the fundamentals. The observations I made last year still apply:
As an aside… I’ve been mystified as to the value ascribed to the company based on its ability to produce original content. What about the risk? Anyone who has worked in film or television can tell you that most productions don’t turn a profit.
I don’t want to get into production. There are passionate, talented filmmakers out there and I would pollute the craft.
Netflix has clearly hit some home runs with House of Cards, Stranger Things, etc. And, theoretically, producing content in-house can lower acquisition cost and diversify revenues.
But, extrapolating an unending string of popular and profitable productions is just plain silly. Some would say borrowing $1.8 billion to fund said productions is downright reckless.
Think New Line, which followed up the hugely successful Lord of the Rings trilogy with the expensive flop The Golden Compass. Investors would do well to remember that beta works in both directions.
* * *
It’s been ages since we offered a discount on memberships. For the next several days, quarterly subscriptions – normally $399 – will be discounted to only $299 for the first quarter. That’s 3 months for less than the price of two on a monthly subscription.
There’s a lovely English figure of speech which suggests the ridiculousness of something happening: “when pigs fly.” In German, the same sentiment can be expressed by the expression “ich glaub mein Schwein pfeift” which means “I believe my pig whistles.” DB is surely trying, but it’s having a hell of a time whistling a happy tune.
We last visited the stock on March 13 [see: When Push Comes to Shove] when it was threatening to break out of a small consolidating triangle after breaking down below our previous short signal at 11. From the Mar 13 post:
A breakdown from a falling channel is incredibly bearish, but a move back above the bottom of the falling channel (around 9.50) would be net positive. To get there, it will need to break above the red TL and will then face its SMA200, now at 10.32.
A long position with very tight stops would make sense for those willing to roll the dice. However, if it can’t retake the channel bottom, then it remains a dead bank walking and a good short.Obviously, shorting it in the hopes that the ECB lets it fail would entail some risk. No doubt the ECB is trying to figure out a way to restructure it in such a way that it’ll survive and, ideally, not take the rest of the world down with it. Until then, I think it’ll remain on life support.
As it turned out, the triangle broke down and not up. The stock spent 6 weeks being propped up around $8/share before finally breaking down again and shedding 28% in a nifty little falling channel.
* * * Deutsche Bank has been a terrific source of trading ideas which have paid off nicely
over the years. While the stock has lost 32% since our initial forecast in Sep 2016, our
long and short trade ideas have totaled 237%. CLICK HERE for forecasts and results.
* * *
It finally bottomed at 6.49 in June and bounced back up above 8 where it collided with overhead resistance and is currently backing off in the wake of the latest restructuring news.
Make no mistake about it, DB is in a world of hurt. Given that it’s the 15th largest bank in the world with over $40 trillion in derivatives, its demise could devastate the financial system. Can this pig whistle? If so, is it just whistling past the graveyard?
PPI just confirmed what CPI declared yesterday: Despite official White House discourse, there is inflation.Of course, it’s very clear that food, energy and trade services are the primary drivers. Without them, PPI is as low as it was in Aug 2017.As a reminder, when Aug 2017 PPI was announced, the 10Y was about 2.1% versus the current 2.5%. WTI, shown below in purple, had doubled in the previous year and was on its way to a near tripling in price, eventually driving the 10Y to 3.248% as CPI topped 3%.We were reminded yesterday that the deficit has ballooned since then. We’re on pace to top $1.1 trillion in fiscal 2019, putting the new total public debt around $22.7 trillion. This is obviously not a great time to be ramping up interest rates.
Yet, if oil and gas prices were to continue rising, this is exactly what would happen.
While the algos are happy to track rising oil and gas prices, the handful of carbon-based traders out there who have done the math know that this is not a sustainable path.
The Fed can pretend that food and energy prices aren’t relevant to their policy decisions. But, they know full well that the consumers who are expected to keep the economy humming have to buy food, gas up their cars, and fork over their soaring rent payments (not owner’s equivalent rent.)
As a chartist, I’m often struck by how similarly the stock market acts at important tops and bottoms. By “important tops” I’m speaking of those which precede large corrections or even crashes. So, with apologies to Tim Knight’s excellent Slope of Hope…
In 2000, SPX retraced a Fibonacci 88.6% of its initial drop before falling off a cliff. If you were to draw a trend line (TL) between the two tops, it would take on the slope of the yellow line below.The 2007 top was completely different: no big retracement, no place for a trend line with a similar shallow a slope to connect, just a setup for a gag featuring a roadrunner and a coyote.
But, in 2011, we saw the pattern all over again: an 88.6% retracement and a very similar TL.What many didn’t realize at the time was that the TL from 2007 TL was simply making a return appearance.Isn’t it interesting, then, that the slope of the line between the Sep 21, 2018 high and today’s high (and passes through the 88.6% Fib retracement) is exactly the same?The Big Picture…
Is it possible that all the bad economic and earnings news we’ve had these past few months is just…bad news?
This is day 8 of our membership promotion, running now through the end of the month for members and non-members alike. We’re offering a 25% rebate off the first month of Monthly and Quarterly auto-renew subscriptions. Annual memberships are available at a very substantial discount (rewarding those who act quickly!)
Remember, the annual pricing is available to current members. If your current membership hasn’t expired yet, we’ll tack your new subscription on to your current expiration date. This can be especially valuable for those who took advantage of a special last year which offered a discount on the first year of a auto-renewing annual subscription.
To sign up for a new monthly or quarterly subscription, CLICK HERE. For details on an annual subscription, drop us a line with the subject line “sign me up!”
* * *
After SPX’s break out on the back of a 37% plunge in VIX, it’s no surprise that the VIX has kept it within striking distance of new all-time highs.
In dropping that 37%, VIX completed a deep retracement of its rise from 9.97 — the lowest it’s been since 2007 — to 16.28. The .886 retracement is considered the last stop before prices drop through the previous lows. Imagine: risk being considered lower than at any time since 2007!
Yesterday, VIX spent the entire day dancing around that .886, with a dip below it every single time SPX started slipping. The message to algos was that VIX was about to drop to new lows and, therefore, stocks should be bought.It was enough to keep SPX from completing a simple retracement from its .886 to its .786, or any meaningful dip until the final minutes of an otherwise nonsensical session.Today’s a new day, as CL is closing in on our 48.35-48.45 target and investors are no doubt anxious to express their disappointment with the lack of details provided for the fantastic, big-league tax cuts “revealed” yesterday.
Despite the slight bump in futures overnight, our downside targets remain intact – starting with 2384.
After allowing a six-session slump (that saw SPX nail our downside target), The Powers That Be can be forgiven for insisting on an overnight ramp job.Last night, it was USDJPY pushing through horizontal resistance, VIX getting clobbered through three separate moving averages, and oil continuing a nice bounce off our 48.63 target. It should be enough to get SPX up over its SMA10 on the opening bell.
Since the bounce is mostly about oil’s “recovery,” we’ll focus today on what to expect over the next few weeks.
Oh, and for those of you who clicked on this post expecting to get their Debbie Harry fix, HERE YOU GO.


 By Mar 18, it had plunged to its 77.92 previous high, shedding a stunning 64% in 6 weeks.