The dollar index continues its tear, surpassing both its 2017 and 2020 highs this morning. This is consistent with our forecast [see: Apr 11 Update on Currencies] that the Fed would need help from a rising dollar to attack inflation without having to resort to sky-high interest rates that would further accelerate the growth of the country’s national debt. At 103.928, DXY hasn’t seen these levels since 2002 in the midst of the 54% dot com crash.
  While beneficial to the inflation outlook, the dollar’s strength hasn’t been very healthy for alternatives such as silver, which just reached our next downside target.
 continued for members… (more…)
Category: Charts I’m Watching
-
Update on Currencies: Apr 28, 2022
-
Stocks’ Broken Record
Yesterday marked the fourth time in the past two months that SPX tested the same important Fib level. The failure to maintain a trend is becoming…well, a trend.
 Will SPX keep playing the same old song or is it finally time for this trend to be broken?
continued for members…
-
Update on RUT: Apr 26, 2022
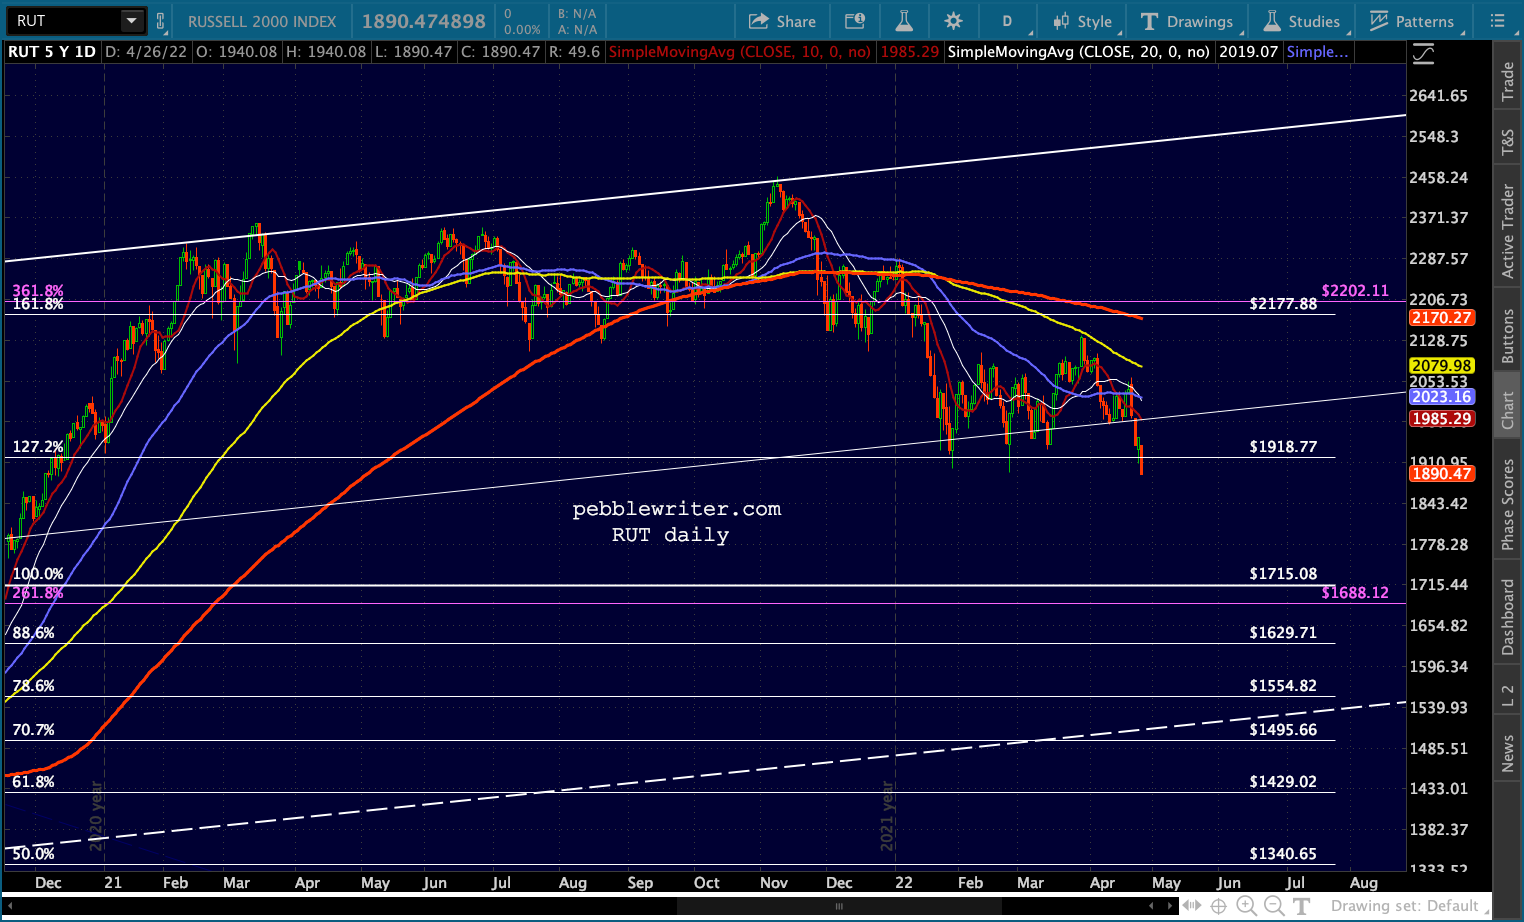
In our last update [see: Nov 30, 2021 Update on RUT] we noted that RUT had fallen by over 10% and dropped below its 200-day moving average – both bearish developments.
Yet, it had bounced repeatedly at a key Fibonacci level, the 1.618 extension at 2177.88. By repeatedly, I mean seven separate times where it dropped below 2177.88, then recovered back above it. To complicate things, it had closed that day just above another important Fibonacci support level at 2202.11.
 In the end, we left members with the simple advice:
If it drops through 2177, then I’d get short with tight stops muy pronto with a new target of 1918.77 (a 22% drop.) Otherwise, watch out for head fakes.
It should come as no surprise that RUT did eventually break down and reach 1918.77, but only after criss-crossing 2177 eighteen more times and rallying 9% into the end of the year. How’s that for headfakery?
 RUT has now tested its new best friend 1918.77 over and over and over again. Its latest tag occurred earlier today. It closed at 1890.47, within 0.5% of its two previous cycle lows.
Now what?
continued for members… (more…)
-
Charts I’m Watching: Apr 26, 2022
ES closed back in its falling white channel following its midday recovery, keeping our target price and date unchanged.

Note: The current forecast page has been updated with targets for SPX, ES, COMP, VIX, USDJPY, EURUSD, DXY, GC, SI, BTC, CL, RB and the 10Y.
continued for members… (more…)
-
Update on COMP: Apr 25, 2022
Almost five months ago, we noted that COMP was nearing an important turning point: our 16,158 target. From Close Enough on Nov 19:
COMP is probably no more than a day or two away from a very significant top.

We identified two downside targets: 12,813 and 10,122. COMP topped out at 16,212 the very next session and reached 12,813 on Feb 24. And, again on Mar 14. And, again today.
 What the heck is going on? After three separate attempts, is 10,122 still on the table?
continued for members… (more…)
-
Back on Track
ES assiduously followed a well-defined falling channel ever since the top in March – with the exception of last week’s breakout. As we pointed out, that breakout was a head fake. ES not only reentered the channel in Friday’s meltdown, but came very close to breaking down below it in the after-hours.
 If it can remain in the channel, our next downside target is looking very good. If not, we’ll get there a lot faster than expected.
continued for members… (more…)
-
Not a Coincidence
Stocks were rejected at the 200-day moving average following an aggressively hawkish comment by Fed Chair Powell that a 50 bps rate increase was “on the table” at the Fed’s May 3-4 meeting. The Fed watches charts too, folks, so this was hardly a coincidence.
 continued for members… (more…)
 -
More of the Same
Futures are keying off the exact same factors as yesterday. USDJPY is creeping higher and VIX is threatening a breakdown.

Traders continue to face an array of headfakes and misdirection as ES backtests its 200-DMA yet again.
continued for members… (more…)
-
Charts I’m Watching: Apr 20, 2022
Forget the fundamentals. Between USDJPY’s breakout and VIX’s smackdown (19% over the past two sessions), the bears are getting pummeled by algos.
 As a result, ES’ falling white channel has been busted – meaning at least a delay in any additional downside.
 continued for members… (more…)
 -
USDJPY: Off to the Races
We published USDJPY’s next highest target months ago with the caveat that it would mean completing a large IH&S that targeted much higher levels and was, thus, far from certain. With inflation already rising sharply, would the BoJ willingly inflict even higher prices on Japanese citizens and businesses just to keep the yen carry trade going?
 Wonder no more. In the past month, USDJPY has completed three separate IH&S Patterns. Unlike other central banks which are acting to reduce inflation, the BoJ is guaranteeing even more. It will certainly mitigate stocks’ downside potential to some extent, but at what cost?
continued for members… (more…)