

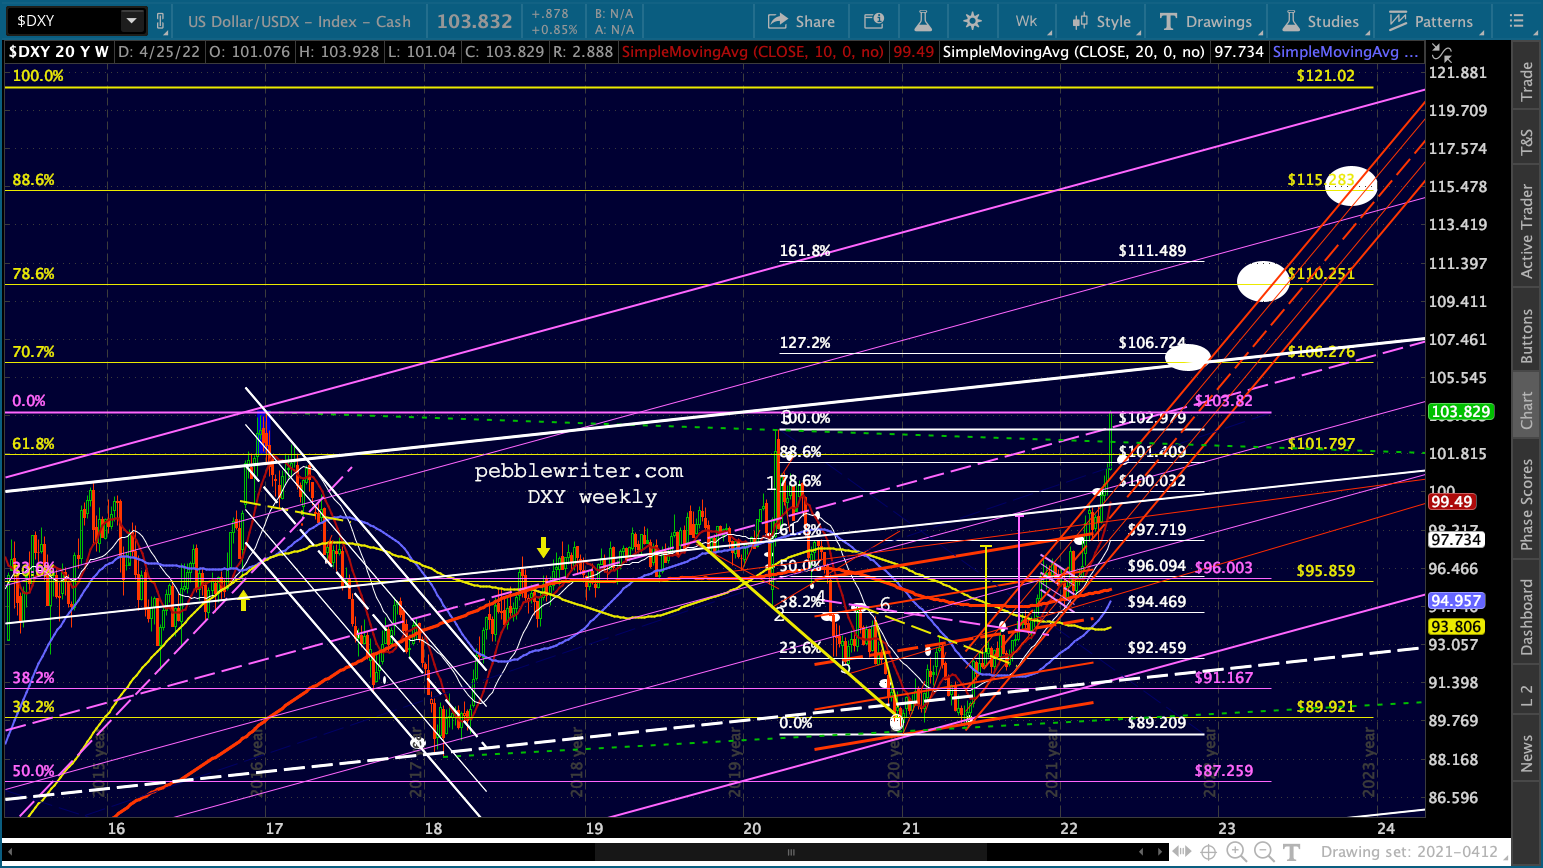
The dollar index continues its tear, surpassing both its 2017 and 2020 highs this morning. This is consistent with our forecast [see: Apr 11 Update on Currencies] that the Fed would need help from a rising dollar to attack inflation without having to resort to sky-high interest rates that would further accelerate the growth of the country’s national debt. At 103.928, DXY hasn’t seen these levels since 2002 in the midst of the 54% dot com crash.
  While beneficial to the inflation outlook, the dollar’s strength hasn’t been very healthy for alternatives such as silver, which just reached our next downside target.
 continued for members…
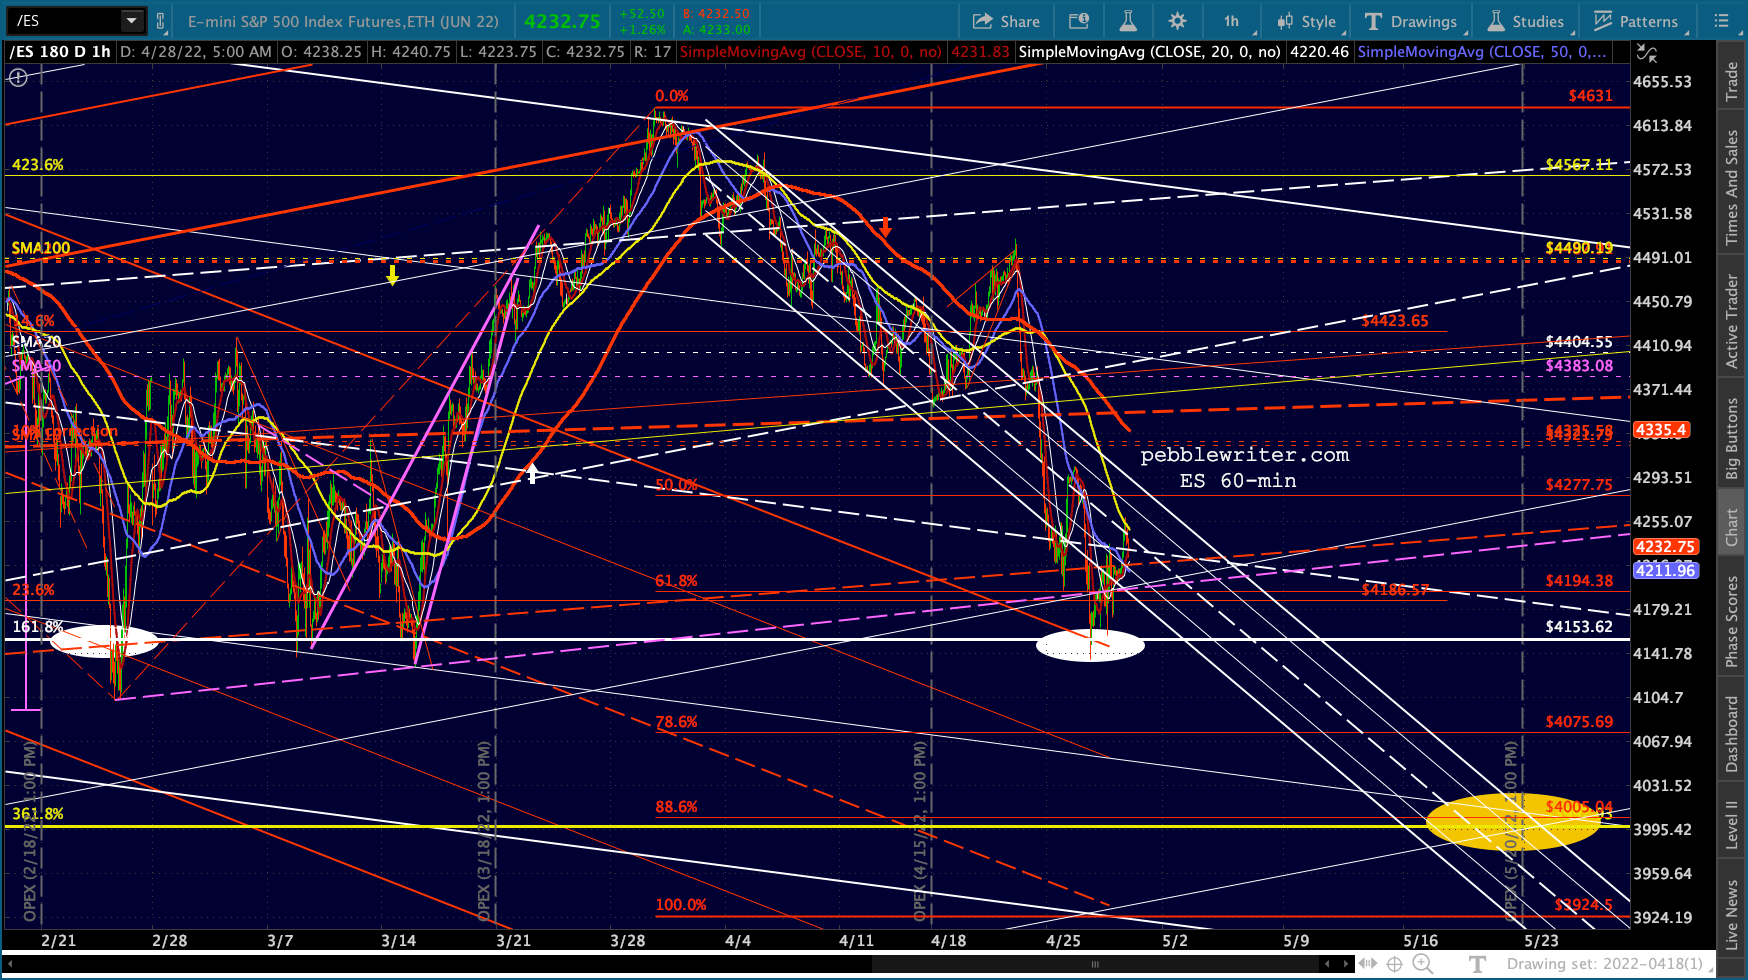
So far, futures are fulfilling our expectation of a time-killing bounce here. Look for a flag pattern/channel to form on ES.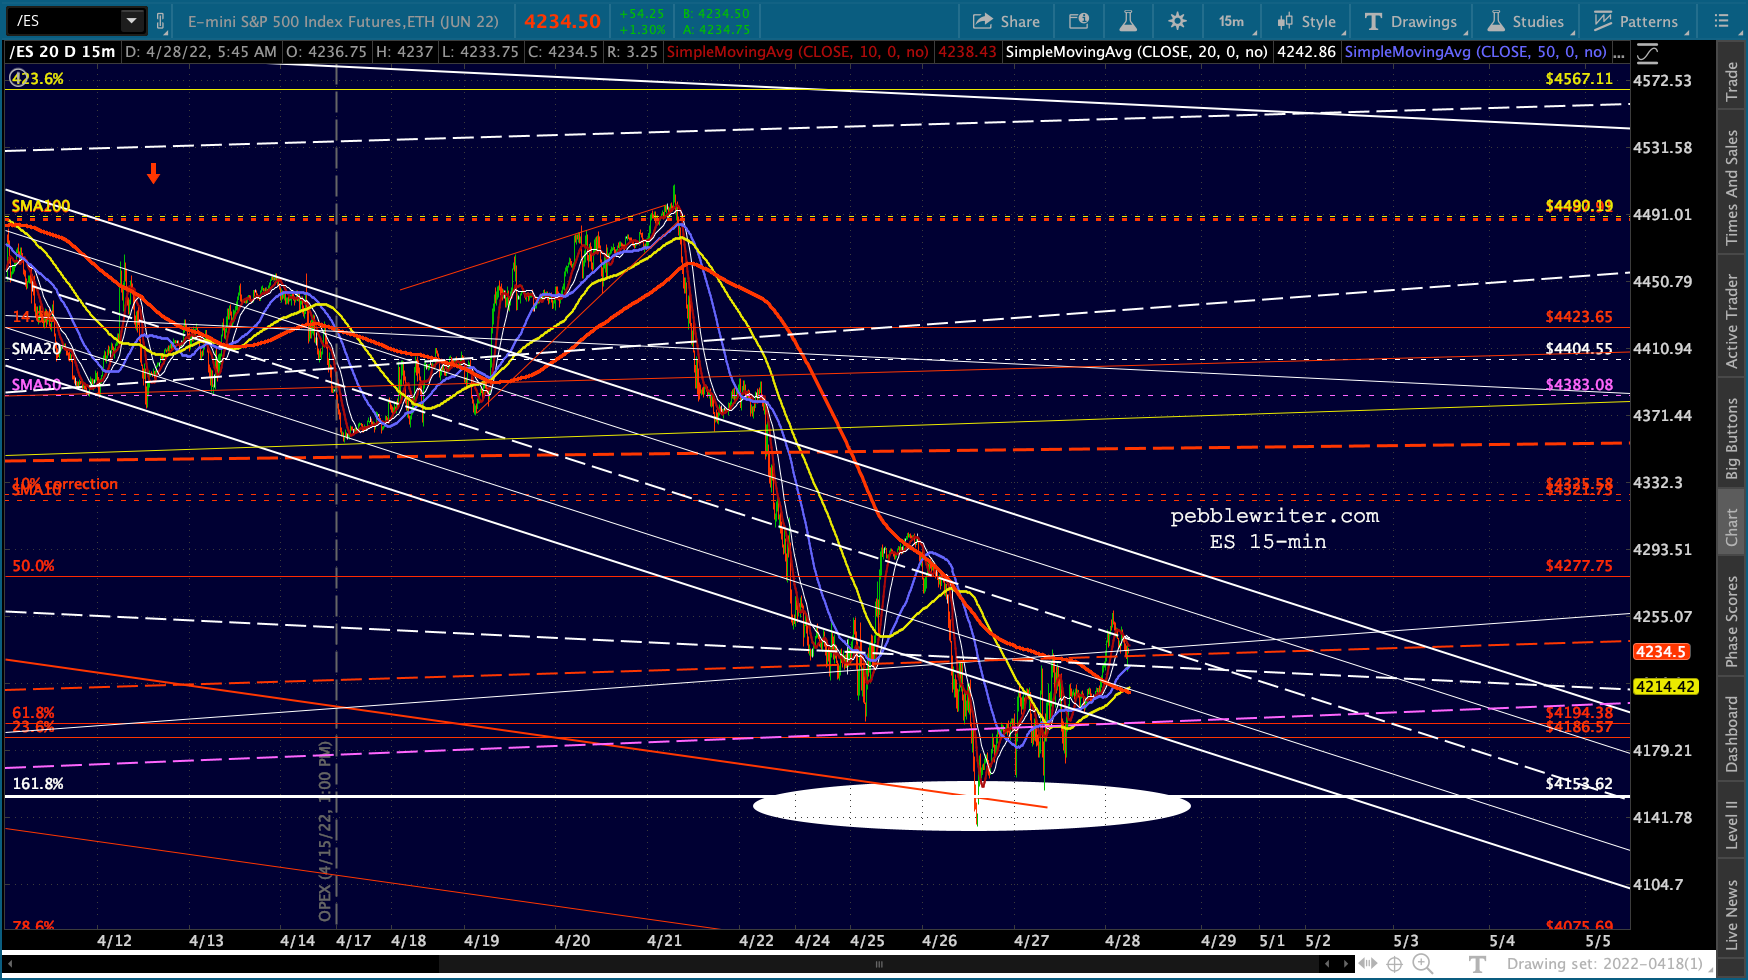
 Note that COMP, which closed below its neckline yesterday, should be rescued back above it on the strong open.
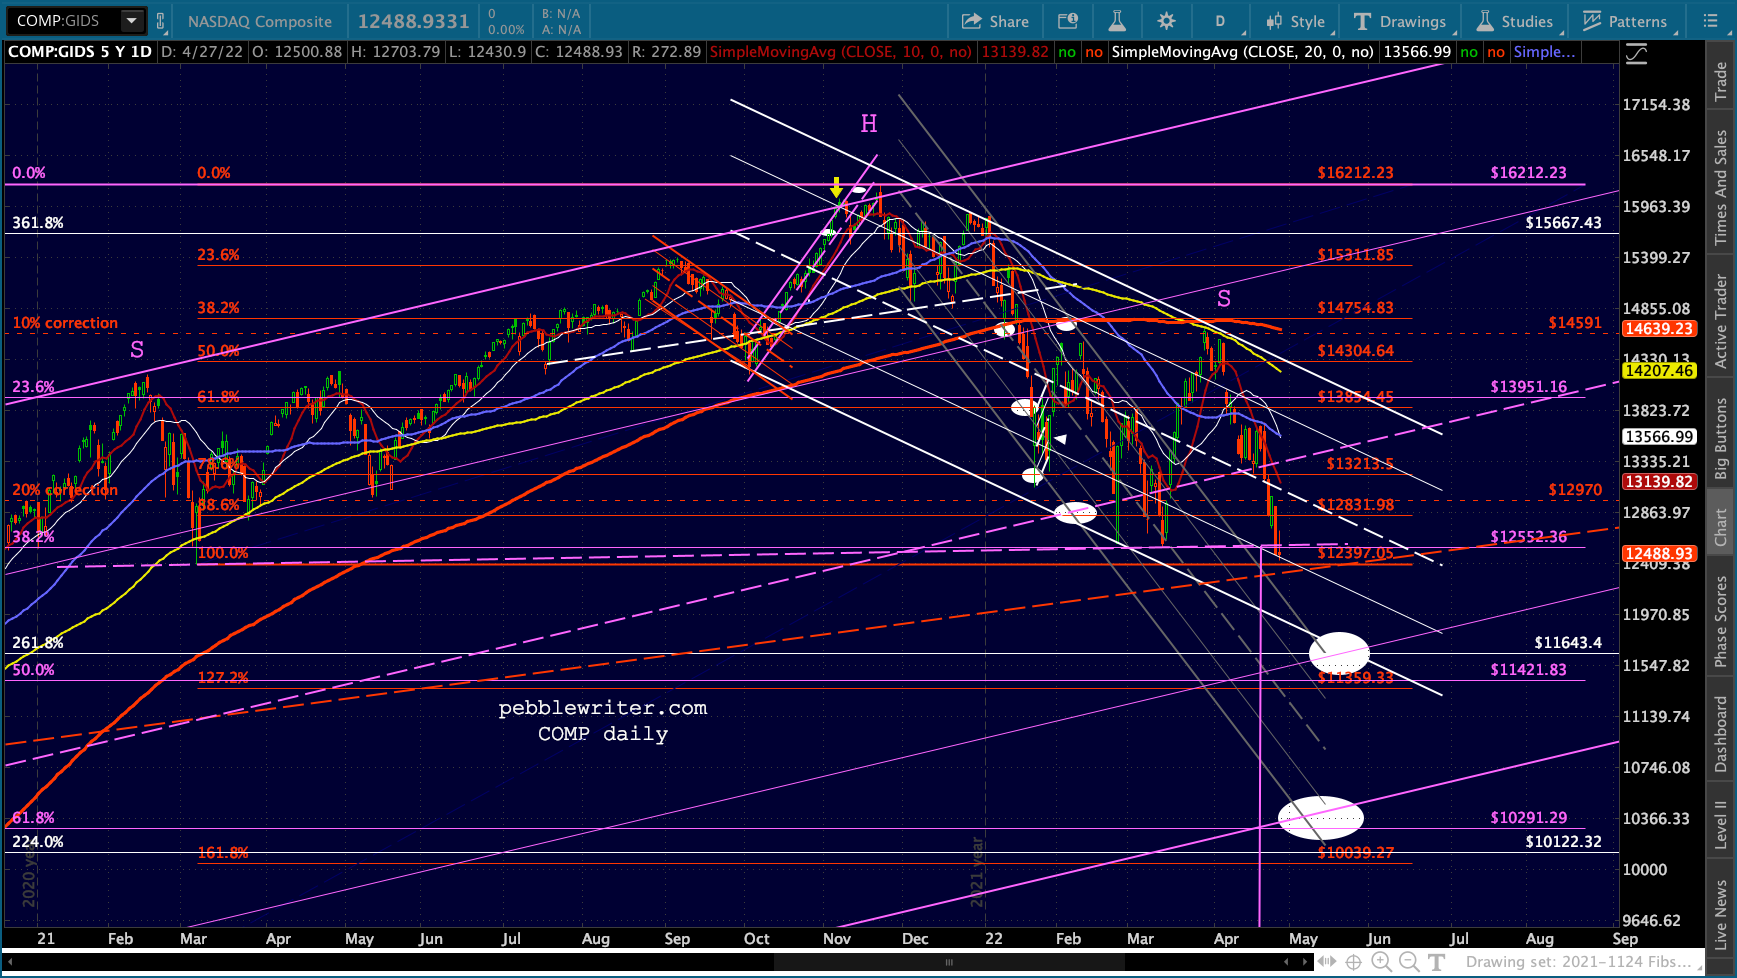 If VIX can hold the rising white channel midline, this bounce should fade after the open.
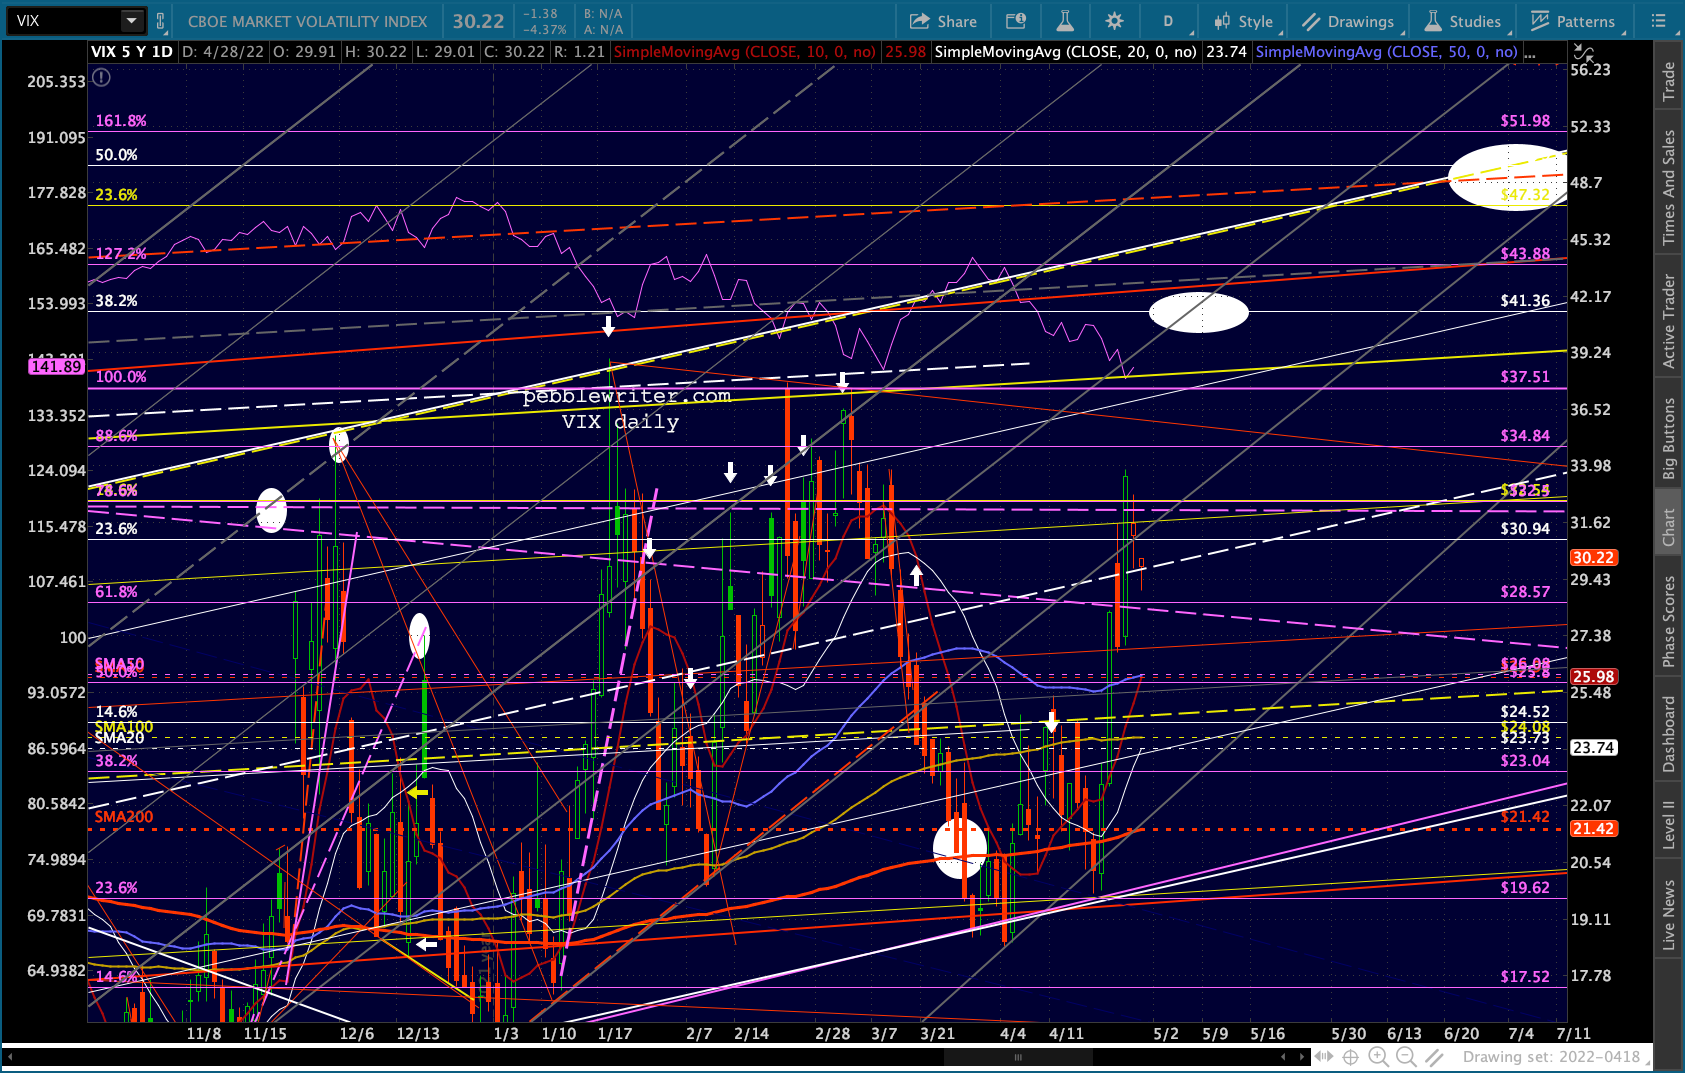 While we’re talking about VIX, note that while the .382 Fib looks like the most likely next upside target, it isn’t at the top of the rising white channel. In fact, the channel doesn’t reach another major Fib level until the white .500 at 50 in late July or early August.
This hints at a multistage downturn for stocks: a leg down now, probably to correspond with the initial rate hike next week, followed by another one a few months from now.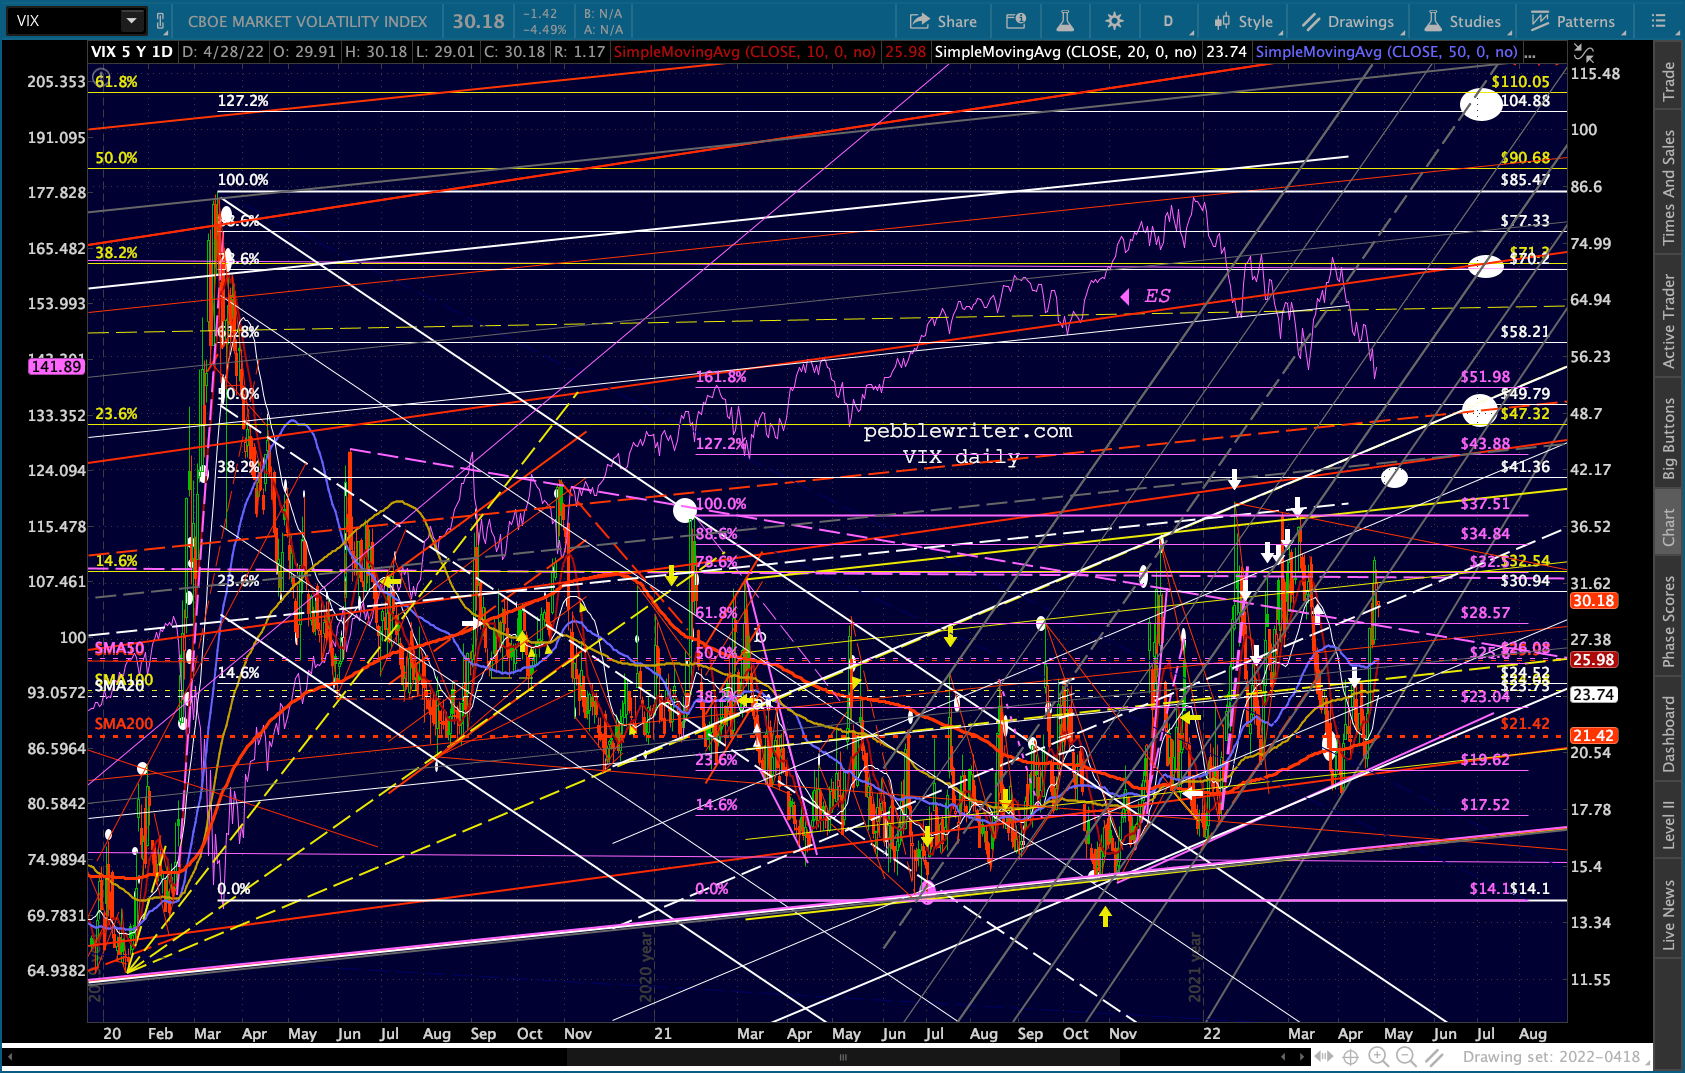 Now, on to currencies. DXY’s pattern makes a lot more sense when seen on a larger scale. The entirety of the past 20 years is captured by the rising white channel – which could also be considered a flag pattern.
 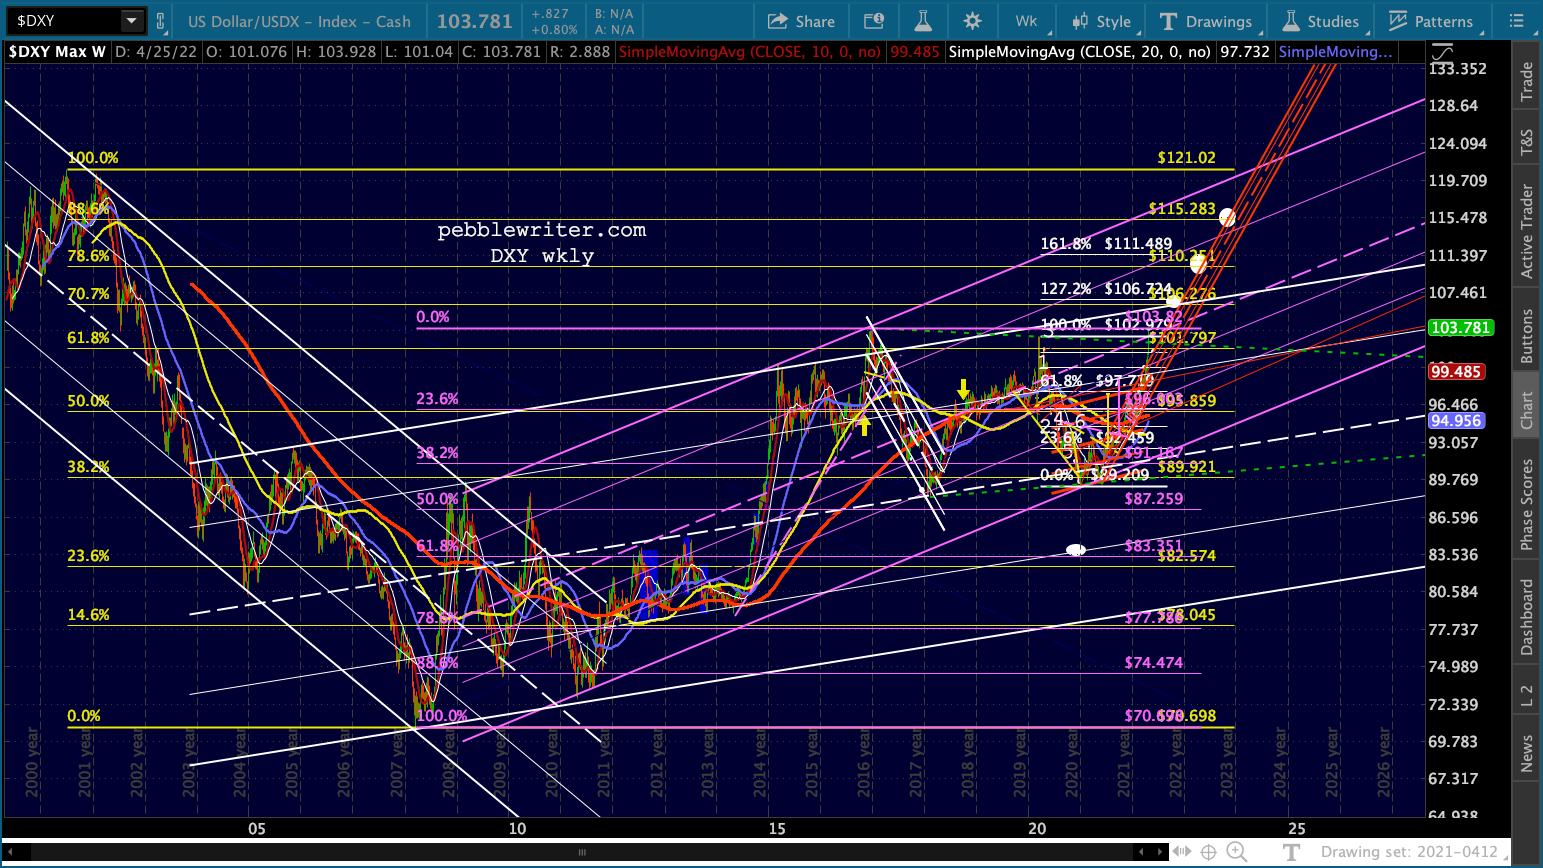 But, the rise since the GFC is better captured by the rising purple channel – especially since DXY (briefly) broke out of the white channel in Dec 2017 and broke down below the midline in Dec 2020 and May 2021. The Dec 2020 lows helped establish the rising purple channel, so there’s every reason to believe that DXY will depart the white channel in the very near future – especially since the euro is in a world of hurt.
 We’ve been bearish on the EURUSD for a long time – well before the Ukraine situation arose and Europe’s disastrous energy situation was revealed.
Russia has Europe over a barrel and it’s now much harder to imagine any other outcome than a massive resumption/acceleration of euro printing. There should be a brief respite as we exit cold winter months. But, without a solution in sight, the longer term picture looks bleak. 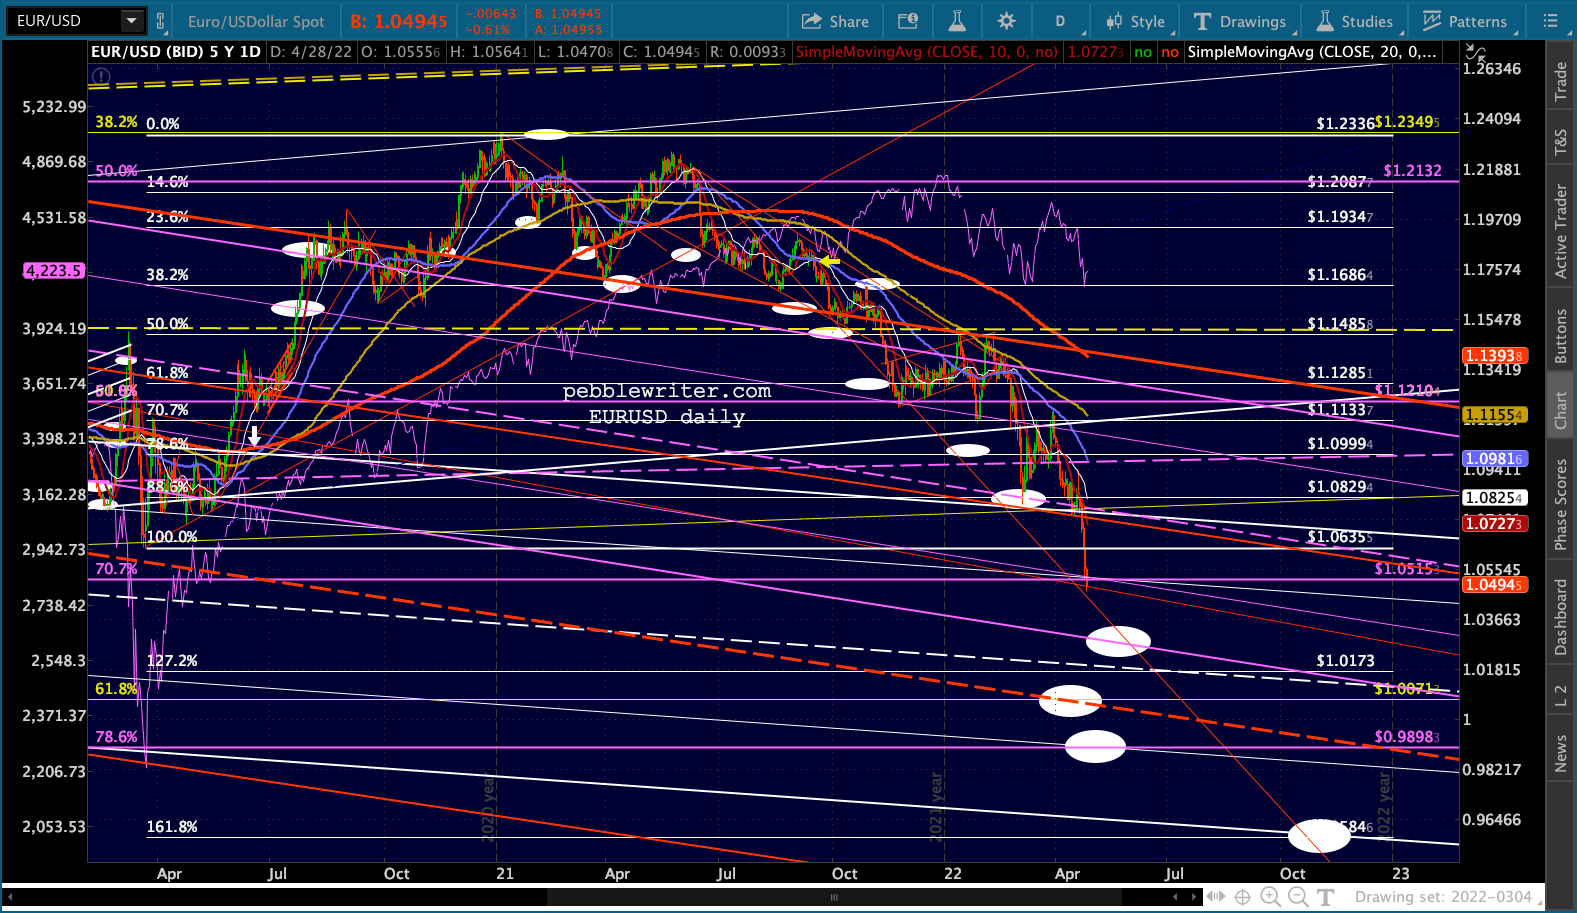 Remember, EURUSD has redefined its path over the years too. The only rising channel from the 80s that still makes any sense at all is the purple one. Its .382 line is down at .86ish and its bottom is at .72ish.
The yellow channel is in there just because its midline fits so extraordinary well, forming the neckline of a large H&S Pattern that targets .7850.
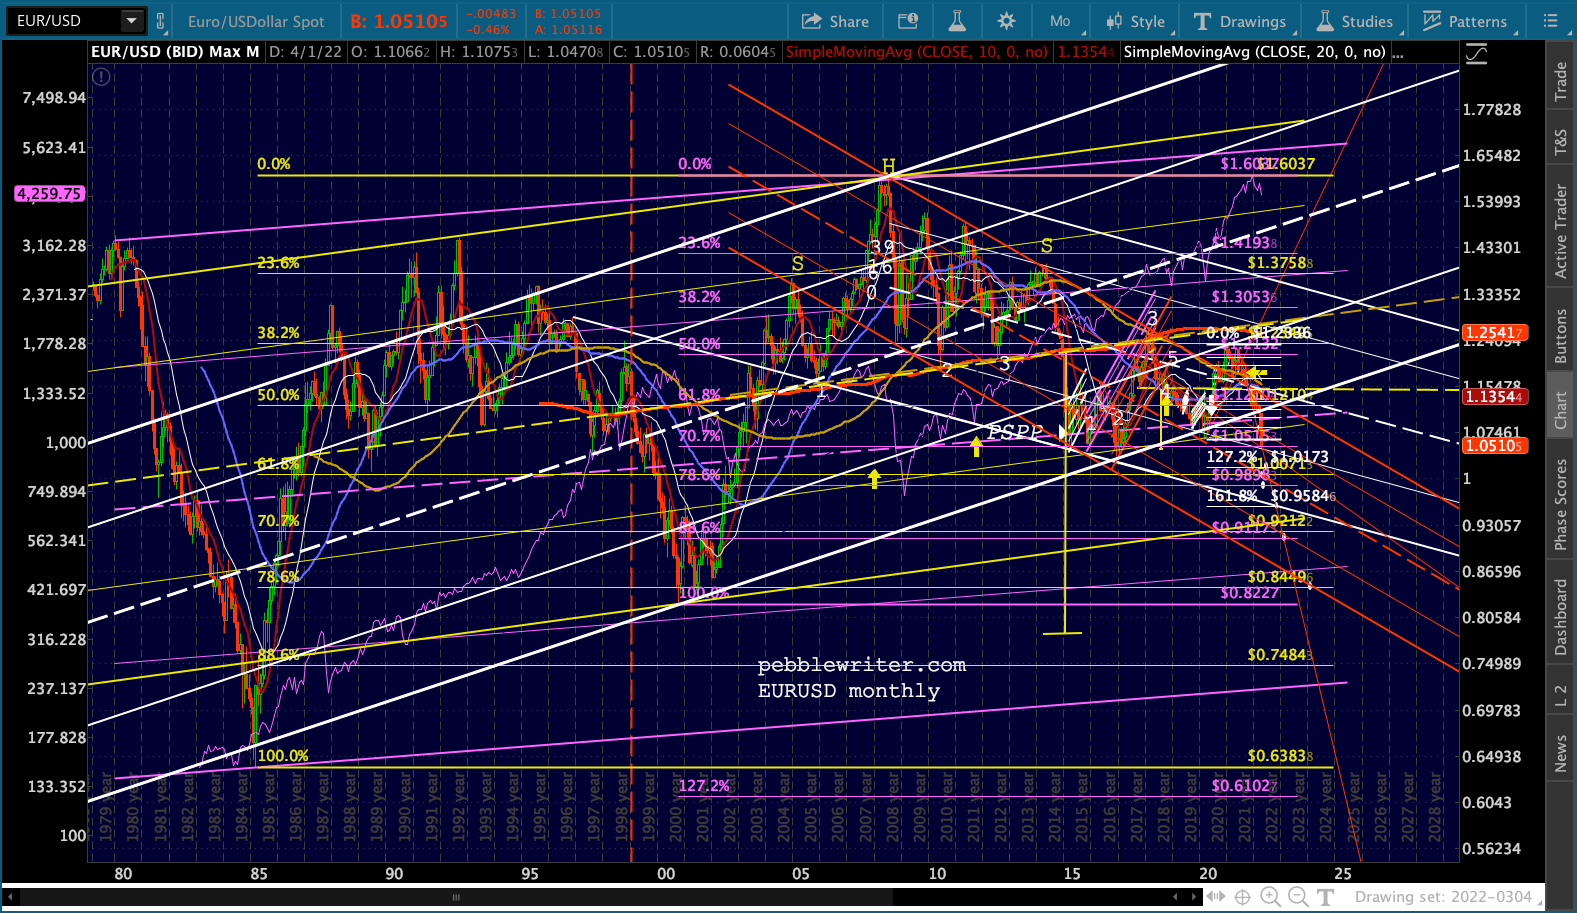 There are other bearish targets: The falling white channel bottom is around the white 1.618 at .9584. The yellow .707 is at .92, and the yellow .786 is at .84, with the yellow .886 at .75. Bottom line, there are so many logical targets that are well below parity that I think the euro is going to be in for a rough road ahead.
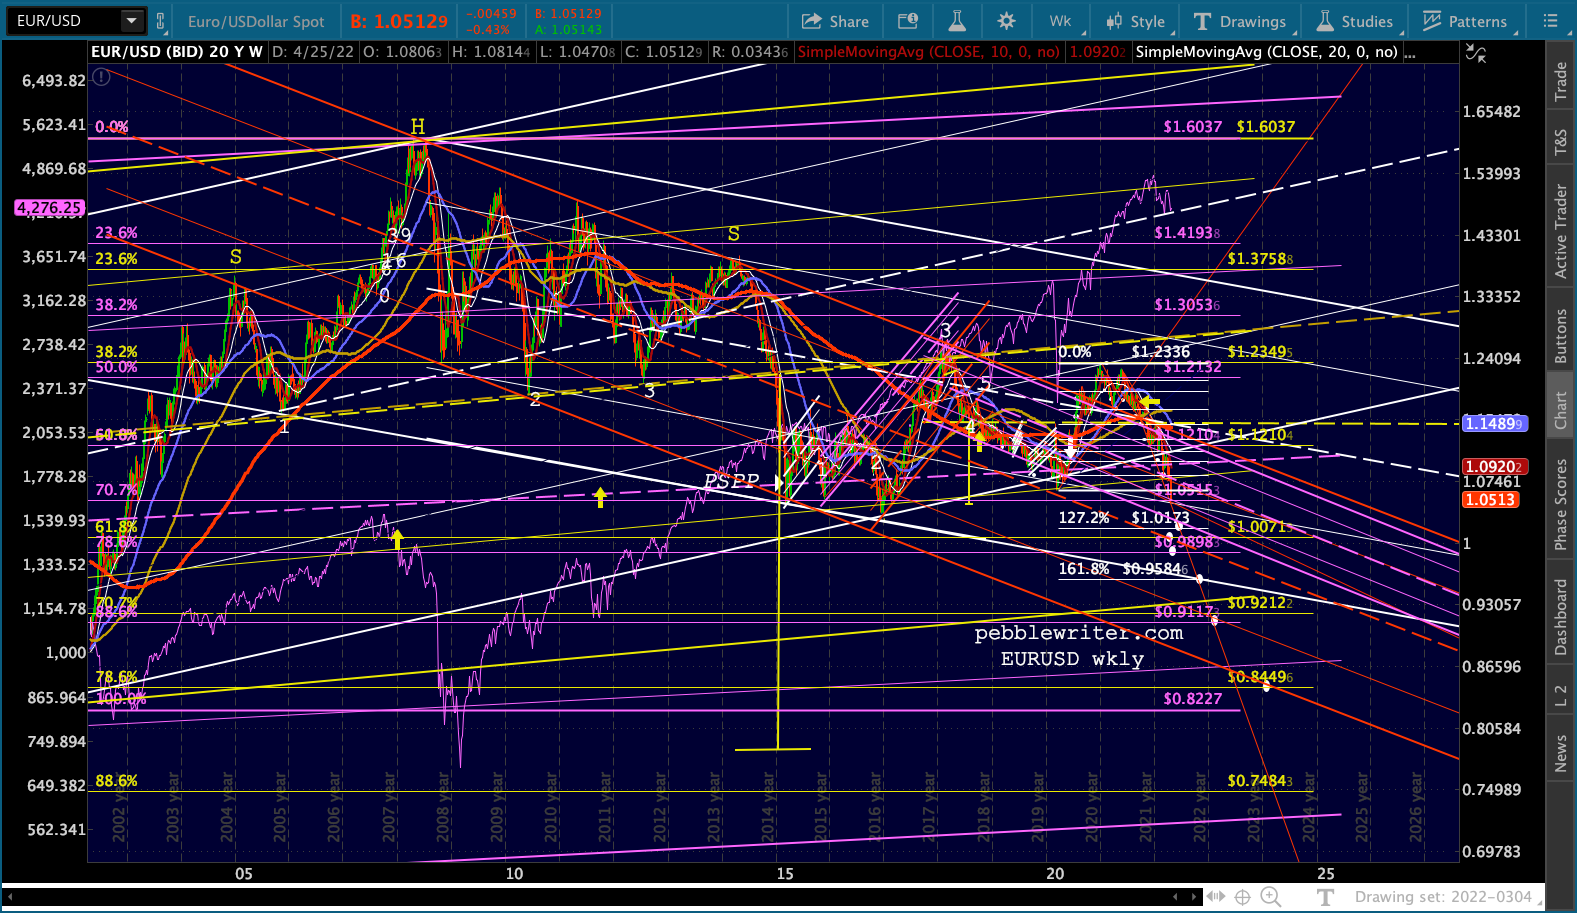 The USDJPY chart is pretty straightforward. It’s coming up on the intersection of the purple channel midline, white flag pattern top, white .786 and purple 1.272. It should at least pause here.
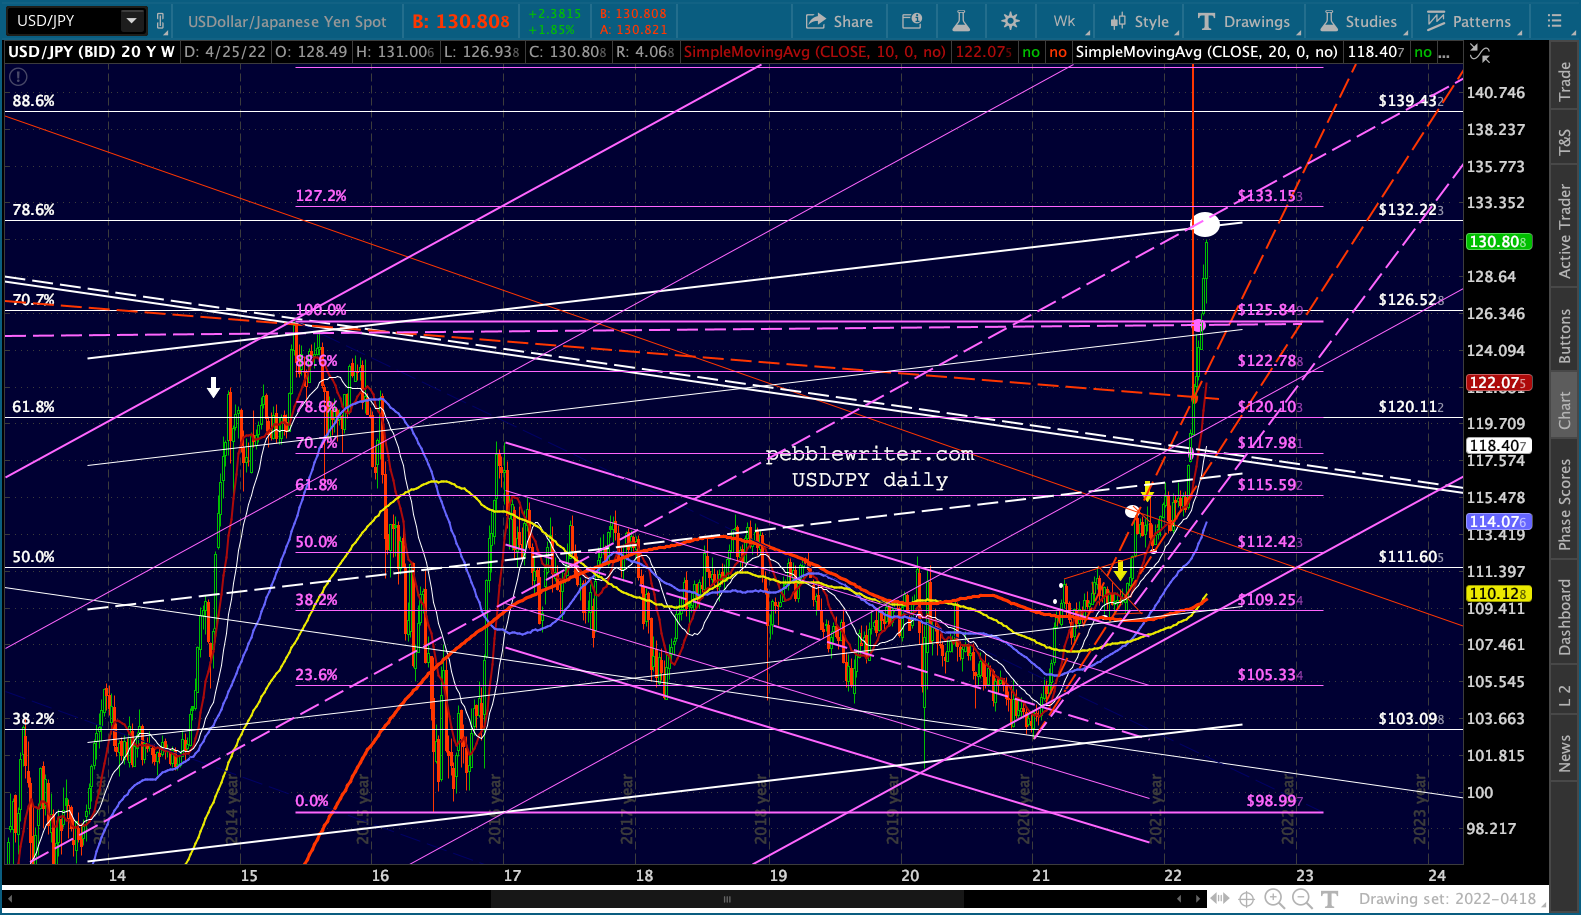 But, if it doesn’t, there are plenty of upside targets including the important whie .886 and 1.000 at 139.43 and 147.65 as well as teh 1.272 at 167.25.
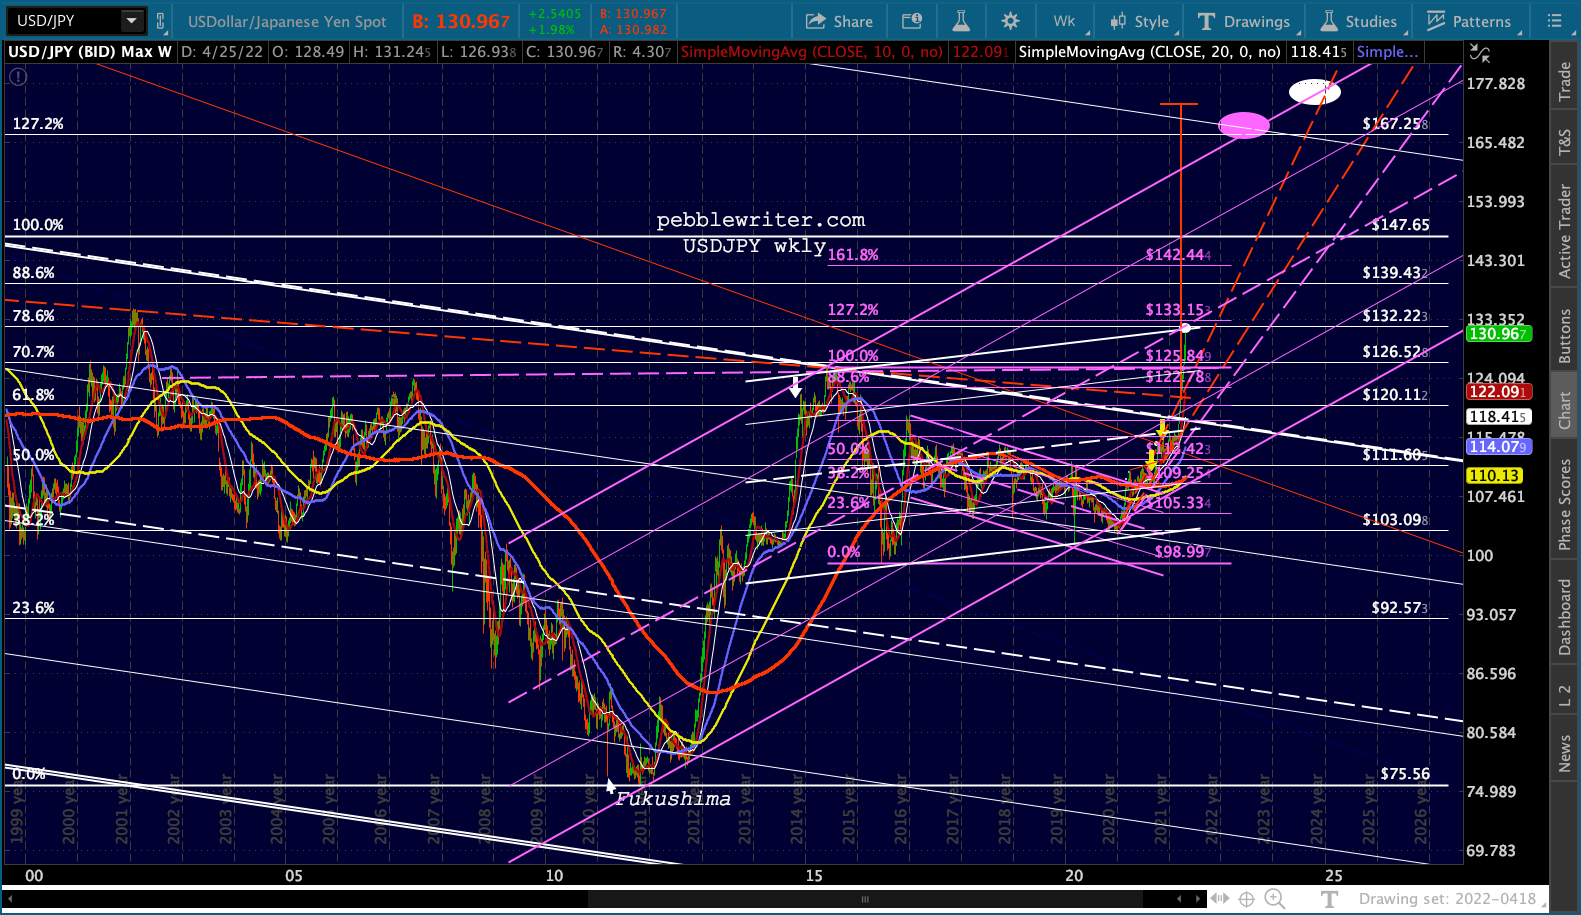 If those sound ludicrous, I agree. But consider that USDJPY rallied 67% from 75 to 125 in order to recover from the Fukushima disaster.
GLTA.