Category: Charts I’m Watching

  • Intra-day: August 16, 2011

     UPDATE:  3:30 PM

    SPX trying to come back, but completing another bearish Gartley pattern intra-day.  Should reverse by 1198.

    UPDATE:  11:50 AM

    SPX completing a little Gartley, in the process of backtesting the rising wedge.  Next move should be down.

    UPDATE:  11:15 AM

    SPX, gold, DX all seem to be completing small degree corrective waves at the moment.

    ORIGINAL POST:  3:45 AM

    The “healthy” Euro-zone economy, Germany, just laid an egg.  From Marketwatch:

    “The German economy grew 0.1% during the second quarter after adjusting for seasonal effects, according to data from the nation’s federal statistics office. Compared with the second quarter of last year, gross domestic product rose 2.7% after adjusting for price and calendar effects. Growth during the quarter slowed sharply from the 1.3% reported for the first quarter and was also below the 0.4% rate forecast by economists polled by Dow Jones Newswires. Economists had been expecting an annual growth rate of 3.1%. “

    I know I sound like a broken record, but folks, this is ugly on a stick.  For the past several days, the markets have been buoyed by the notion that the ECB could make Euro-zone’s debt problems magically disappear by applying the same QE fairy dust that’s proven so effective in the US.

    But think it through…   if the problem is too much debt in the first place, how in the wide, wide world of sports could more debt ever possibly solve the problem?  Sure, if we had rapid growth, the debt might gradually shrink as a percentage of GDP, etc, etc, etc.  But, does anyone see any real growth on the horizon for Europe or the US?  This report is essentially saying “don’t hold your breath.”

    **************

    Speaking of China…   here’s a fascinating article on its housing bubble.  Anyone who envisions China coming to the West’s rescue should take the time to read both parts I & II.

    **************

    Lastly, an update on the 2007 v 2011 comparison…

  • Mark Cuban: Tech VC Bubble = Ponzi Scheme

    He’s calling this a “technology VC bubble,” where new venture-capital money is paying off old money almost akin to, in his own words, “a Ponzi scheme” or “an old chain letter.” 

    He also opines on diversification (for idiots), his latest stock investment (SPY puts) and governmental effectiveness.

    See the video here.

  • Intra-day: August 15, 2011

    UPDATE:  3:15 PM

    The dollar decline seems to have run out of steam.  DX has run into support from the fan line we’ve been watching (red dashed line), and now has the opportunity to follow a rising TL back towards the falling wedge boundary.

    UPDATE:  2:10 PM

    Between the rising wedge, multiple bearish harmonics patterns, fibonacci target, horizontal resistance, an important trend line, the round number and significant divergence…

    …that should just about do it for the upside.

    I’m taking bets on how much longer CME will wait before raising gold margin requirements again.

    UPDATE:  9:40 AM

    This looks like an overshoot on the Google/Motorola euphoria this morning.  We’re up past the harmonics targets and there’s obvious price divergence vs RSI and MACD.

    Lowes’ drop in year over year sales and a continued moribund NAHB report have much more to say about the “recovery” than Google’s acquisition.

    I expect a reversal very soon.

    ORIGINAL POST:  9:00 AM

    An ugly Empire State Mfg Survey…  If there’s a ray of hope in here, I don’t see it.  Business conditions, orders, prices, inventories — all lower.

    The only index that improved was employment.  But, the increase is simply the result of employers drinking the economic recovery cool-aid.  The percentage of employers that anticipate laying off workers in the next six months is on the rise.

    More later.

  • Intra-day: August 12, 2011

    UPDATE:  12:40 PM

    I’ve been undecided about one aspect of the 2007=2001 pattern for most of the past week.

    The price drop we’ve experienced is obviously much greater in percentage terms than in 2007.  Yet, the pattern of chop we’ve seen is exactly the same.

    Throw in the harmonics patterns I discuss below, and I think we’re on the cusp of another big leg down.  I’ve been expecting it to happen this afternoon, but maybe it’s not until Monday.  For those of you looking for an exact date, think late in the day on January 14, 2008.

    I realize it’s not terribly obvious from the daily chart, which still looks a bit on the oversold side. That’s the only thing keeping me from being 100% certain.   But, the shorter term charts are shaping up nicely.   There’s also a nice divergence between the rising prices and falling volume.

    UPDATE:  12:05 PM

    Gartley, Crab and Butterfly (adding here in yellow) all completing at 1186-1191…could be big!

    UPDATE:  11:35 AM

    Hadn’t noticed this before, but the bearish Crab pattern (in purple) we just completed yesterday also completed a bearish Gartley pattern (white.)

    The .618 XA retrace on the Gartley would have been 1172.19; SPX hit 1171.77.  The .786 CD leg should have hit 1190.97; it hit 1188.64.  The 1.618 extension on the Butterfly indicated 1185.59.  These are very precise patterns, and in this case they were nailed.

    As I always say, there’s no guarantee on these; they’re right about 70-80% of the time.  But, when I see two very well-formed patterns nestled one inside the other, it’s a very good indicator that 1190.97 will not be exceeded today in any meaningful way.

    BTW, it’s interesting that this tug-of-war is happening at the same price level as a large gap formed on December 1, 2010.

    UPDATE:  10:30 AM

    Here’s the Reuters/Univ of Michigan Survey of Consumers press release.  Pretty dreadful.


    UPDATE:  10:10 AM

    Gold is off 11 so far, but the potential is much greater.

    A reminder:  the Butterfly pattern that completed a couple of days ago [see:  All That Glitters] calls for a minimum .618 retrace of the DA leg.  While not guaranteed to happen, it’s worth noting that such a mild retrace would take prices down to 1506.  A typical 1.618 retrace would indicate a downside of 1250.

    UPDATE:  9:40 AM

    SPX completed a bearish crab pattern yesterday at the 161.8 extension.

    It also completed a rising wedge pattern, reaching about 80% of the way to the apex.  Both contributed to the 16-point reversal at the end of the day.

    I’m viewing this morning’s run up as a backtest of the rising wedge until proven otherwise.  If the crab plays out, we should give up the 14 points we just gained and then some.

    The crab argues for a return to at least 1138 (the .618 retrace) and possibly the 1.618 extension at 1076.

    More later.

    ORIGINAL POST:  9:30 AM

    Link to retail sales report

  • Intra-day: August 11, 2011

    SPX rallied nicely off the bullish Gartley completed yesterday. 
     

    For anyone not convinced that harmonics work, take a look at where it reversed —  .22 from the D point indicated by a Gartley pattern at the .786 Fibonacci level.

    Like many, I have been trying to make sense of the structure of the market over the past week.  We declined farther and faster than in 2007, and most significantly, without much of a pause at the lower end of the regression channel.

    I’ve been undecided as to whether the rebound should adhere to percentage or absolute price moves.  The fact that we’ve stayed in a trading range — albeit a 70-pt one — for the past several days has further complicated things.  It’s been nice for day-trading, but I’d be more comfortable with a sense of when/how we’ll break out.

    I’m leaning toward regarding the past week as the equivalent of the Jan 7-14, 2008, meaning this is our big bounce back, and we shouldn’t expect any more.  I’m not certain about this at all, but we are completing an obvious rising wedge and a bearish crab pattern on the day. 

    More later.

  • Intra-day: August 10, 2011

    UPDATE:  1:50 PM

    So far, so good on GC.

    UPDATE:  12:00 PM

    SPX very quiet after falling off 45 points in the opening hours.  Looks like it’s trying to get the c leg of wave 4 going.

    GC has had what looks like a blow-off morning.  It looked like it was going to complete a triple top, then quickly shot up for another $20, only to quickly reverse.  It continues to show a great deal of negative divergence on the hourly chart, not to mention a bearish rising wedge.

    Just a reminder:  it’s completing a bearish crab pattern inside a larger bearish butterfly pattern [see: All That Glitters.]  We’ve seen from DX this morning the kind of powerful reversal that butterfly patterns can generate.

    DX turned exactly on the internal trend line we were watching yesterday.  It’s highlighted here as the red dashed line.

    Backing up a bit, we can see this is actually a fan line from the Mar 09 top.

    And, last, the 60 minute chart.  Note the turn at the TL and the powerful reversal that butterfly patterns can create.

    ORIGINAL POST:  3:15 AM

    This corrective wave [iv] should run out of juice somewhere around 1229.  Failing that, the upper limit is 1255.  Wave [v] down should be gentler than [iii], possibly reaching only a bit lower — say 1089.

    More in the morning.

  • All That Glitters: What Next?

    UPDATE:  EOD

    GC climbed 62 points to 1782.50 today, completing a bearish butterfly pattern and then establishing an intra-day double top.  Post the Fed announcment (with no QE) it fell 56 to 1717 before closing up 26.  It was an impressive reversal that reinforces the notion that investors were counting on QE to fuel the next spike.

    ORIGINAL POST:

    I’ve been watching the divergence setting up on gold’s hourly chart for the past week or so.  It’s getting pretty extreme, leading me to believe something’s gotta give.

    In addition, the bearish butterfly pattern (on the daily chart since May 2) has extended to the 2.618 level, and the smaller, nested bearish crab pattern (on the 60-min chart since Aug 4) has extended to the 3.14 level.   If these patterns were to play out, the correction could be impressive.

    A garden variety .618 retrace (of DA) would indicate a 200 point decline to 1533.  A typical 1.618 retrace would take gold to 1263.

    It’s important to note that butterfly patterns can end at any extreme Fibonacci extension of the BC leg.  Although the most typical ones are 1.618, 2, 2.24 and 2.618 (where we are now), it’s possible we’ll extend further.   The 3.0 extension is at 1807 and the 3.618 at 1878.  So, stops make a lot of sense.

    Getting away from the technical picture for a moment… it seems the entire run up has been predicated on the certainty of a declining dollar.  It’s an easy scenario to believe, since the Fed has so thoroughly trashed the dollar in previous rounds of QE.

    And, they could certainly try it again.  We’ll know soon enough.  But, if they don’t, this is one very over-extended puppy.  I like the risk/reward very much — not enough to bet the farm on, but definitely worth a shot.

  • Intra-day: August 9, 2011

    UPDATE:  1:10 PM EDT

    QE3 is so far looking more like QE1.9.  A promise to keep rates at current levels through mid-2013 is net positive for stocks, as it implies a stable interest rate environment — thus, theoretically mitigating the risk of higher rates.

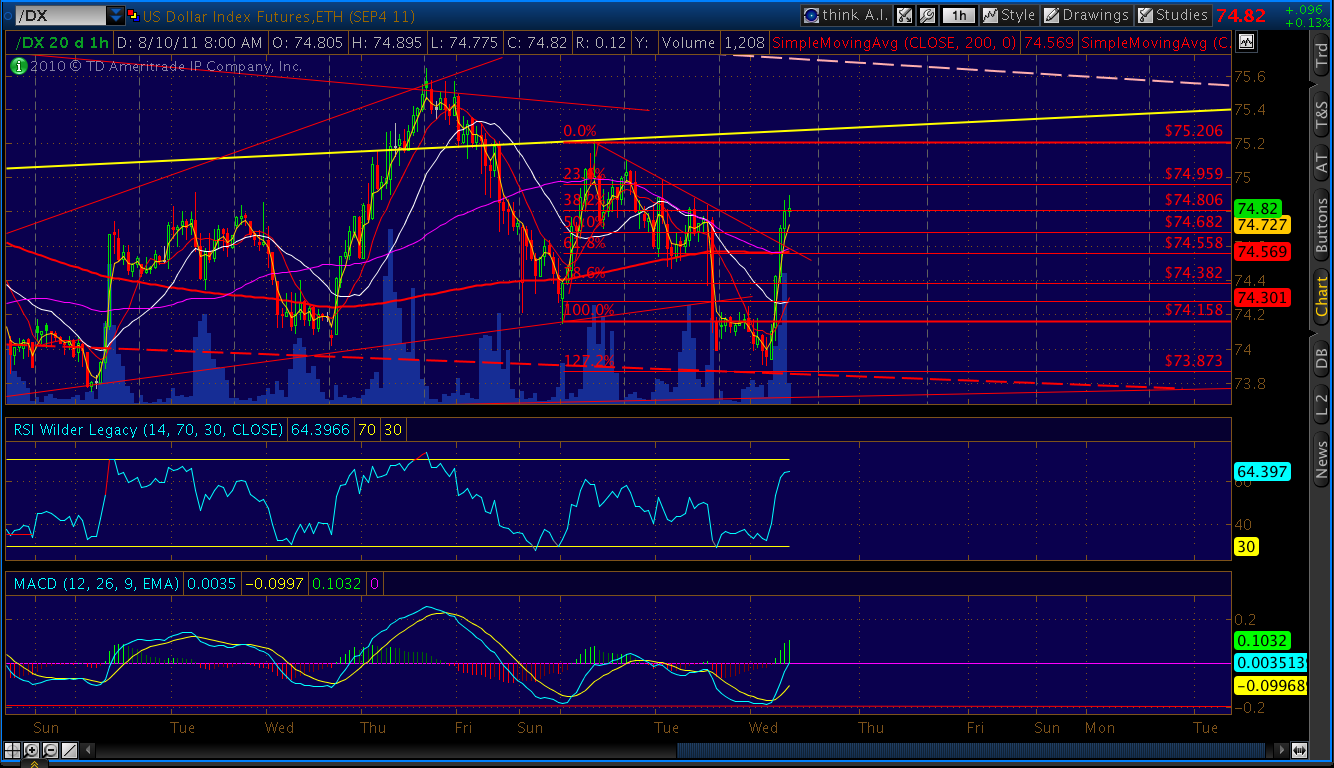
    Of course, the Fed has no such power.  If rates get going to the upside, there’s not a lot they can do.  The dollar traded off on the news, promptly becoming oversold.  DX has strong support just below these levels, with an internal TL at 73.82, the last low at 73.61, and combination TL and Fib support at 73.56.

    A reversal as early as overnight or tomorrow morning is entirely possible.  If so, stocks’ rally would no doubt be cut short.

    Regarding stocks,  we came very close to our 2.618 harmonic target — a bullish crab pattern that was supposed to kick in at 1098.86 (see original post below).   SPX rallied at 1101.54, a mere 3 points away.

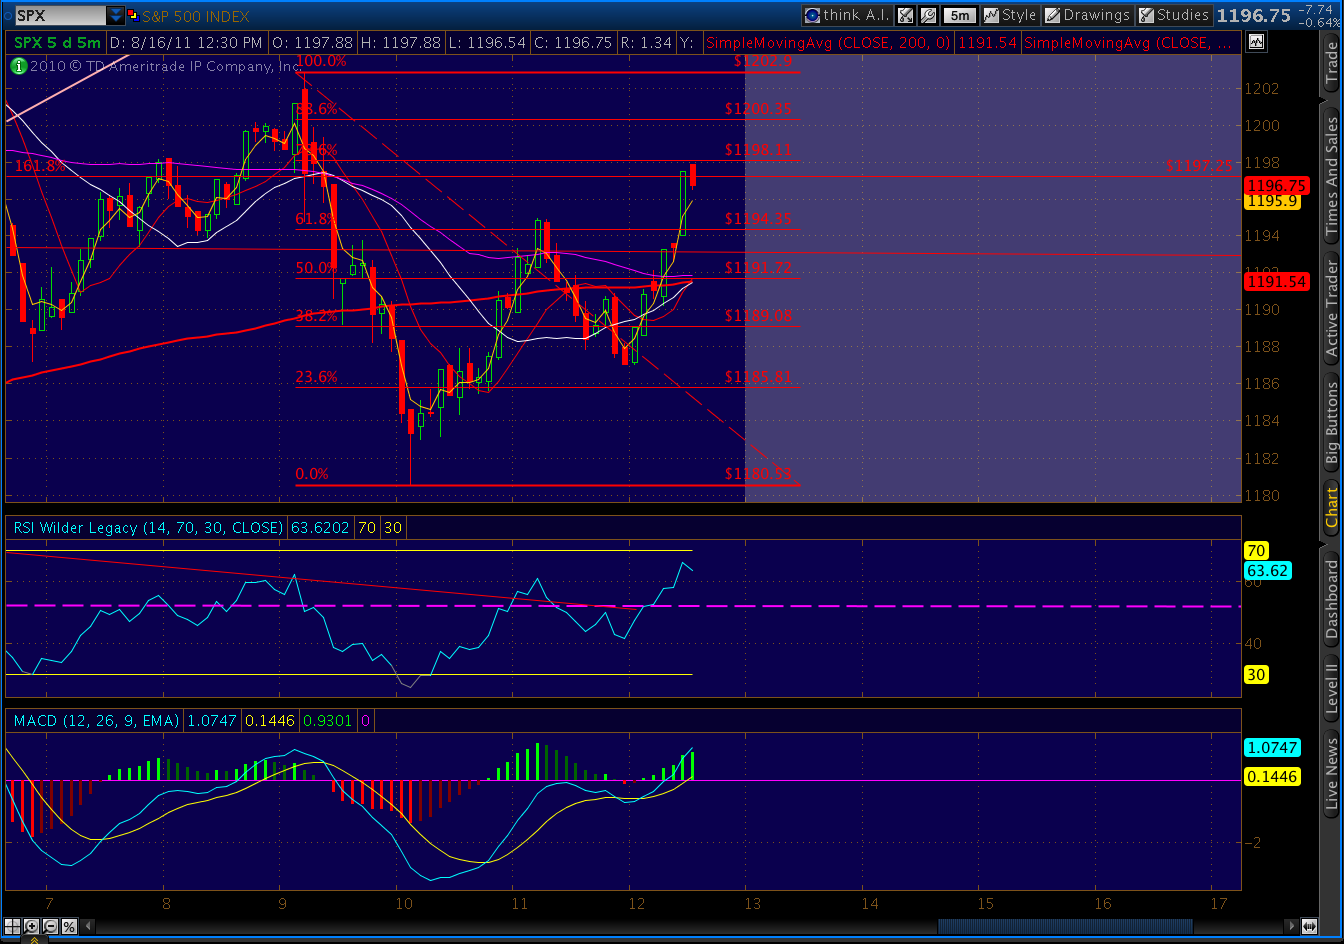
    We’re also most of the way to an IHS target of 1185, seen here on the 5-minute chart. Two previous intra-day IHS patterns failed, so this one wasn’t a gimme.

    As far as additional upside, the EW picture is interesting.  I have believed for some time that the Jun 16 low of 1258 was wave 1 down and the Jul 7 high of 1356 was corrective wave 2.  If true, any bump up shouldn’t exceed 1258.  Of course, if my wave 2 was really a truncated wave 5, then the upside could be greater — possibly as high as 1295.

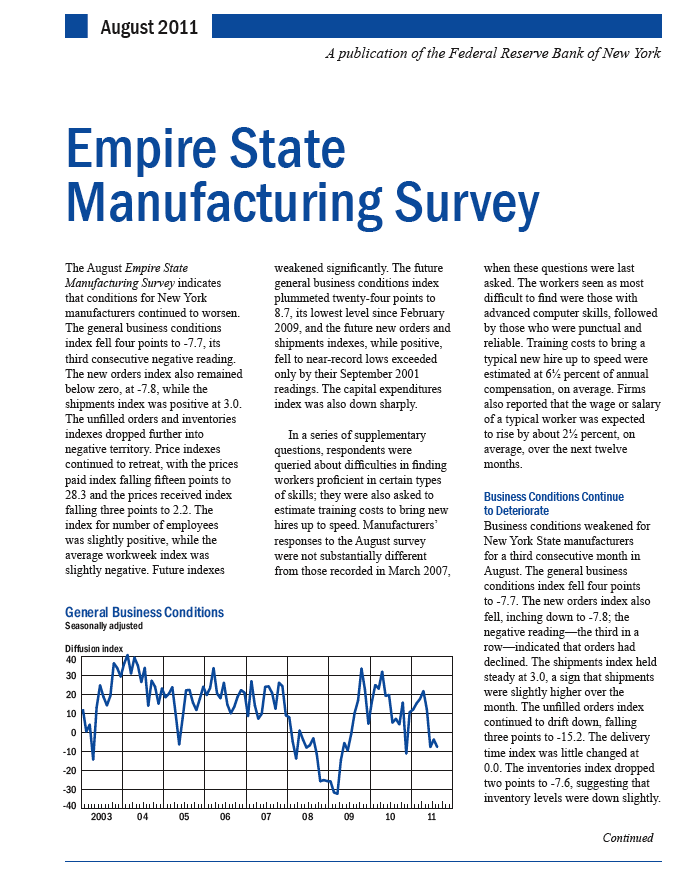
    From a macro standpoint, nothing new to get excited about.  The Fed’s statement underscores the crappy economic backdrop.  Lower oil prices might create some trickle down benefit; but those take time to reach the market.  And, in the meantime, consumers and businesses alike are certain to view the recent market action as all the reason they need to reign in spending.  I think most of the GDP estimates being discussed by TPTB are optimistic at best.

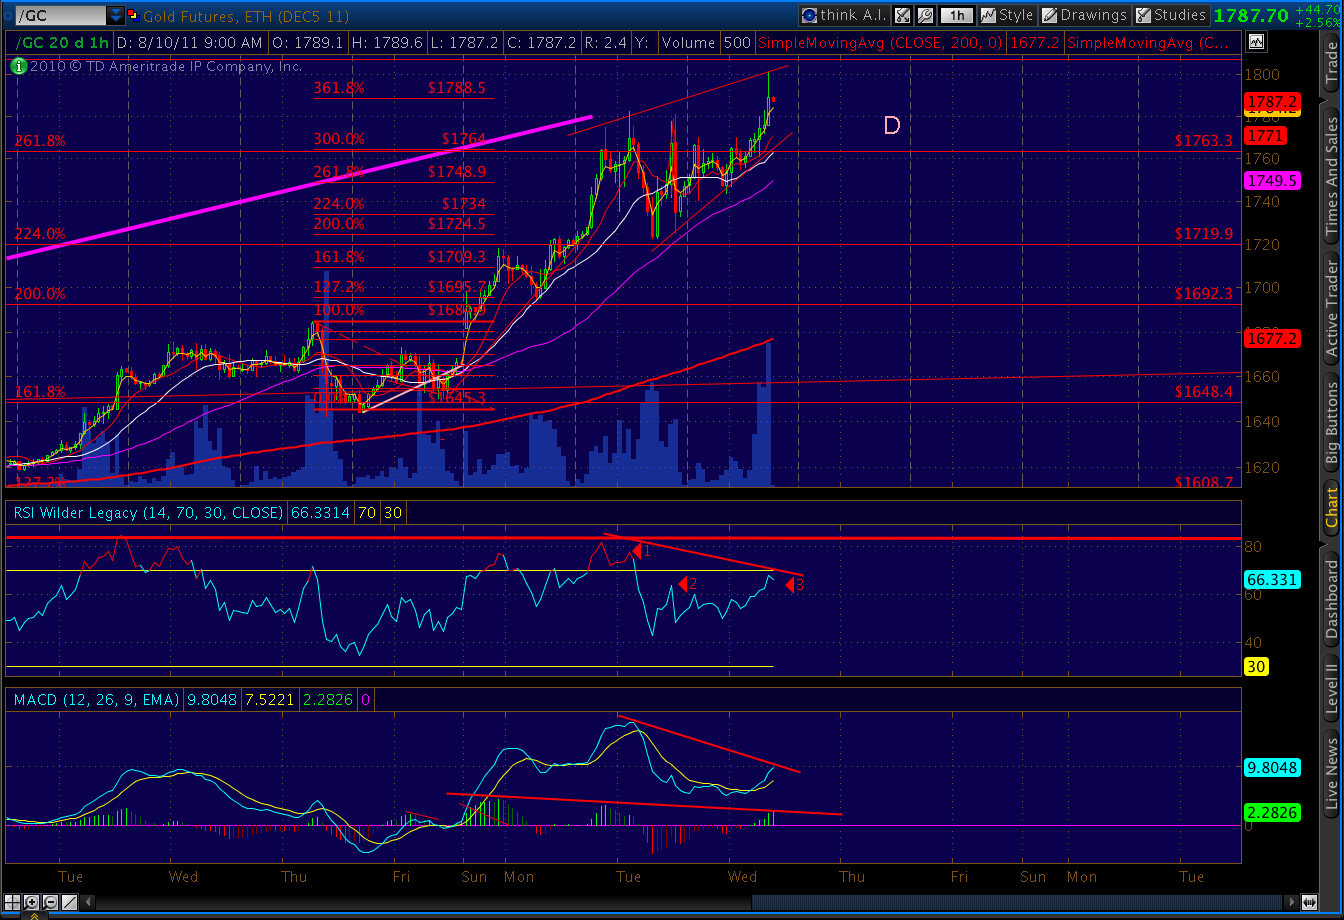
    Last, gold made a nice reversal today.  Check out All That Glitters for additional discussion.

    UPDATE:  12:50 PM  EDT

    The IHS can’t seem to seal the deal.  Like the failed IHS two days ago, the index is trying to rally, but there’s a lot of divergence setting up on RSI and the histogram.

    Why?  This rally was built solely on the expectation of Ben Bernanke riding in on his big, white Brinks truck at 2:15pm. 

    Anything short of QE 2.5, and we should tank to 1100 or lower in a hurry.

    More later.

    ORIGINAL POST:  9:40 AM EDT

    The market’s itching to make a comeback, but there’s no obvious support that I can see at this level.  Nothing for the market to hang its hat on.

    The best support looks to be around 1098.86.  This marks the 261.8 extension of the bullish crab pattern started at the Jun 16 low of 1258.07.   It also marks the 261.8 extension of a smaller crab started at 12pm on the 5th.

    I’m tracking a small inverse H&S; setting up on the 5-min chart that would complete at 1150.  It would suggest a rise to 1181 or so.

    If the day goes by without any positive news from Jackson Hole, we could easily see a drop to those levels, setting up the powerful rebound everyone’s looking for.

    Rebound or not, the general direction is still down.  Most of us expect a rebound, because the daily technical picture looks a bit oversold.  But, keep the weekly and monthly charts in mind as well.


    The weekly chart recently pierced the 200-period MA, falling 36 points below it at yesterday’s low.  Many expected a bounce here, like in 2001 and 2008.

    When it did so in 2001, it fell 144 points below the MA before backtesting it to 1315 for a 234-point gain over 9 weeks — putting it above the MA again.  But, the next 13 weeks saw a 371-point decline to 944.

    In 2008, the first pierce was for 23 points, followed immediately by a 126-point rally, then a 140-point decline, a 184-point rally, and finally a 240-point decline.  In all, the index crossed the SMA-200 five times.  The final backtest fell short of the MA and completed a decline of 910 points.

    In other words, don’t read too much into the idea that the MA may have beat back the bears.  Even in the short-run, we could have another 100 points to go before a serious backtest occurs (if playing by the 2001 rules.)

    The big picture is clearly bearish.  The only two past incursions were the early stages of much bigger declines — the 2001 and 2007 crashes.

    Last, the monthly chart.  The last time SPX approached its 200-SMA in the midst of a decline, it plunged right through.  It was October 2008, and the 200-period MA was at 993.  SPX fell from 1167 to 840, a 323-point decline. 

    It backtested, but couldn’t break back through to the positive side the following month.  In fact, it took 10 months to break back on top after making a new low of 666.

  • August 8, 2011

    I know this market seems unbelievable, but be careful about calling the bottom unless some of the RSI charts are able to break their TLs.  Here’s the 5 minute chart:

    And, the 60 minute:

    Note every time the market tries to turn, the RSI is turned back by its trend line.  I, for one, won’t give up a single short position unless we can at least see a clean break.

    *********

    Just a quick look at possible TL’s to watch — big picture stuff.  Next support looks to be around 1100, the 3rd fan line off the 2007 top.

    This also coincides with the 2.618 Fib extension at 1098.86.  Recall, this would be another logical termination of the crab pattern we’ve been watching [Anything Happen?]

  • Lessons Learned

    I know, strange title.  I was going to go with “A Little Self-Doubt Can Knock the Snot Out of Your Portfolio,” but that seemed a bit excessive.

    Just came across this chart from June 23 [Deja Vu, All Over Again].  I had recently discovered fan lines, and was pretty excited about the prospects.

    Combining fan lines with my growing conviction regarding the 2007/2011 similarities, I plotted what I thought might happen over the next several months.


    Among other things, it convinced me we were going to reverse the 112-point decline we had just experienced, bounce another 50-points to 1328 before falling to 1175 by August 3rd.

    Then… I pretty much forgot about it.  I was frustrated with Prophet and went back to the regular Think or Swim charting format.

    I last revisited it on July 6, shifting everything forward for the extra time the bounce took.  This meant moving a little further down the trend line, so the target shifted to 1156 by August 10th.  Then I forgot about it again… until now.   Here it is, with the last month of actual results shown.


    Creepy, I know.

    The thing that jumps out at me is the importance of taking a longer view and sticking with a plan.  I had no way of knowing (on June 23 or July 6) exactly what troubles lay ahead for the Euro-zone.  I had no clue we’d get the employment or GDP figures we did, or that S&P; would downgrade US paper.

    I wish I could say I didn’t second guess myself every step of the way — trying to outmaneuver the markets, wasting time, commission dollars and profits in the process.  But, I did.  I ignored my own well-reasoned advice and forecast and traded the crap out of my portfolio.

    I got nervous when the bounce didn’t go according to plan (thanks to the strategic petroleum reserve release).  I got nervous again, when we bounced higher than my 1328 target.  And, I got nervous yet again when we barely bounced last week on the way to the current levels.

    They say never look back; but, seriously, what do they know?  $100,000 would have purchased 1,162 SPY July 133 puts back on Jun 23 at .86.  That investment would have grown to $214,970 on July 6.  That amount, invested in Aug 116 puts at .19 would have purchased 11,314 contracts.

    Those puts traded today at 3.95.  Uh-huh.  As in 11,314 X  $395 = $4,469,030. Don’t know about you, but an extra $4.5 million would come in handy right about now.

    Am I kicking myself?  Like the lady says, “you betcha.”  I’ve done very well these past few months but, unfortunately, it wasn’t a 44X return.

    So, back to the title: lessons learned.  For starters, I’m going to take another long look at the trend lines and 2007 pattern similarities.  They’re what brought me to this dance, and I would do well to stop ogling the red-headed research across the room.

    Next, I’m going to set aside some long-term do-not-break-glass-even-in-case-of-emergency funds, invest them according to my convictions, and leave them the *$%# alone!

    Finally, I’m going to make an entry in today’s investment journal just like the one on June 23.  I’ll come back and read it in a couple of months.  It’ll be something like: “don’t you ever learn!?”