Category: Charts I’m Watching

  • Intra-day: August 24, 2011

    UPDATE:  EOD

    Not much time to write tonight, so I ‘ll make this short and sweet.

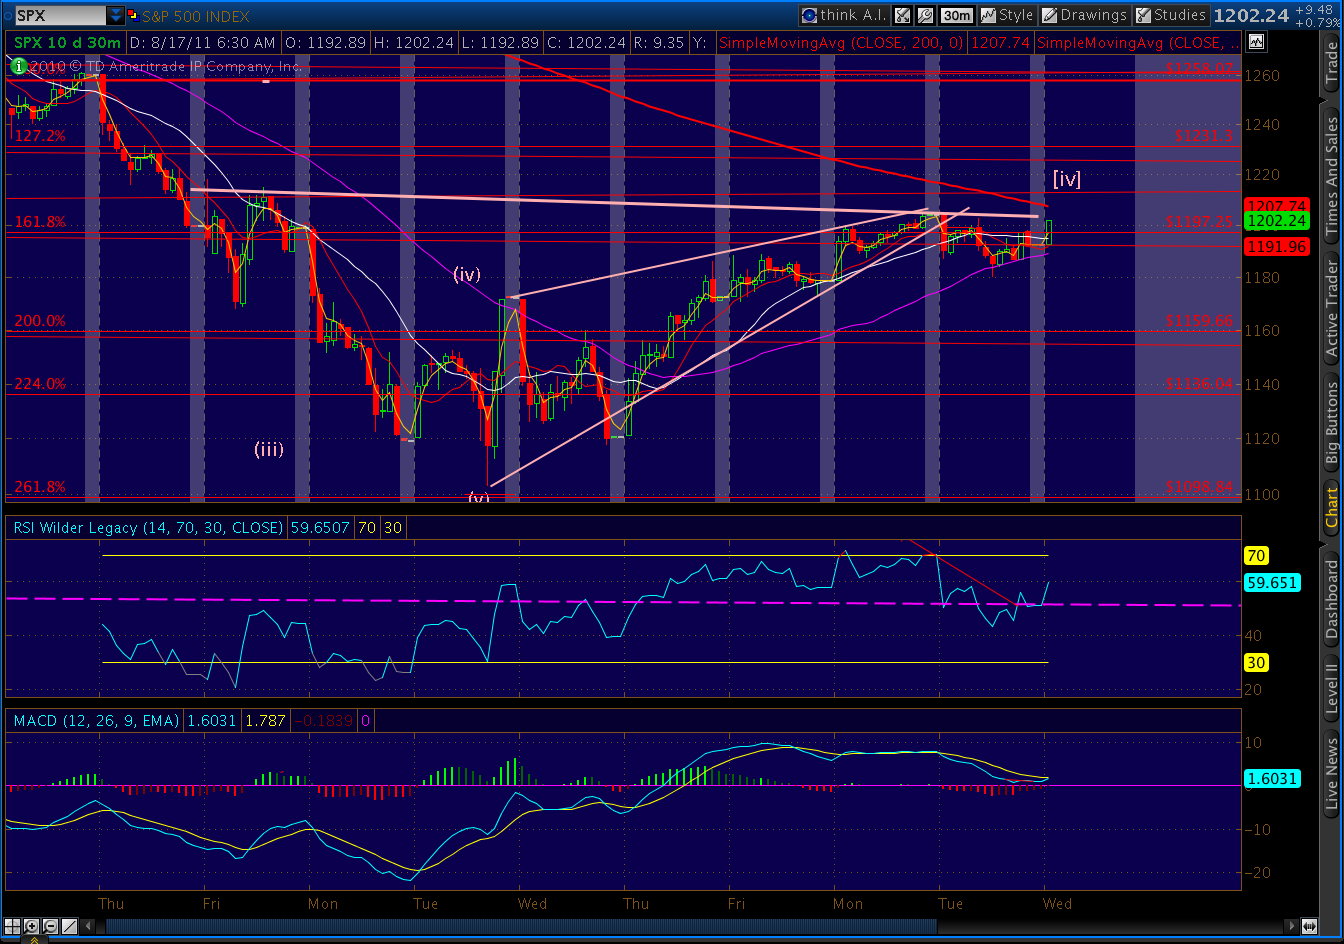
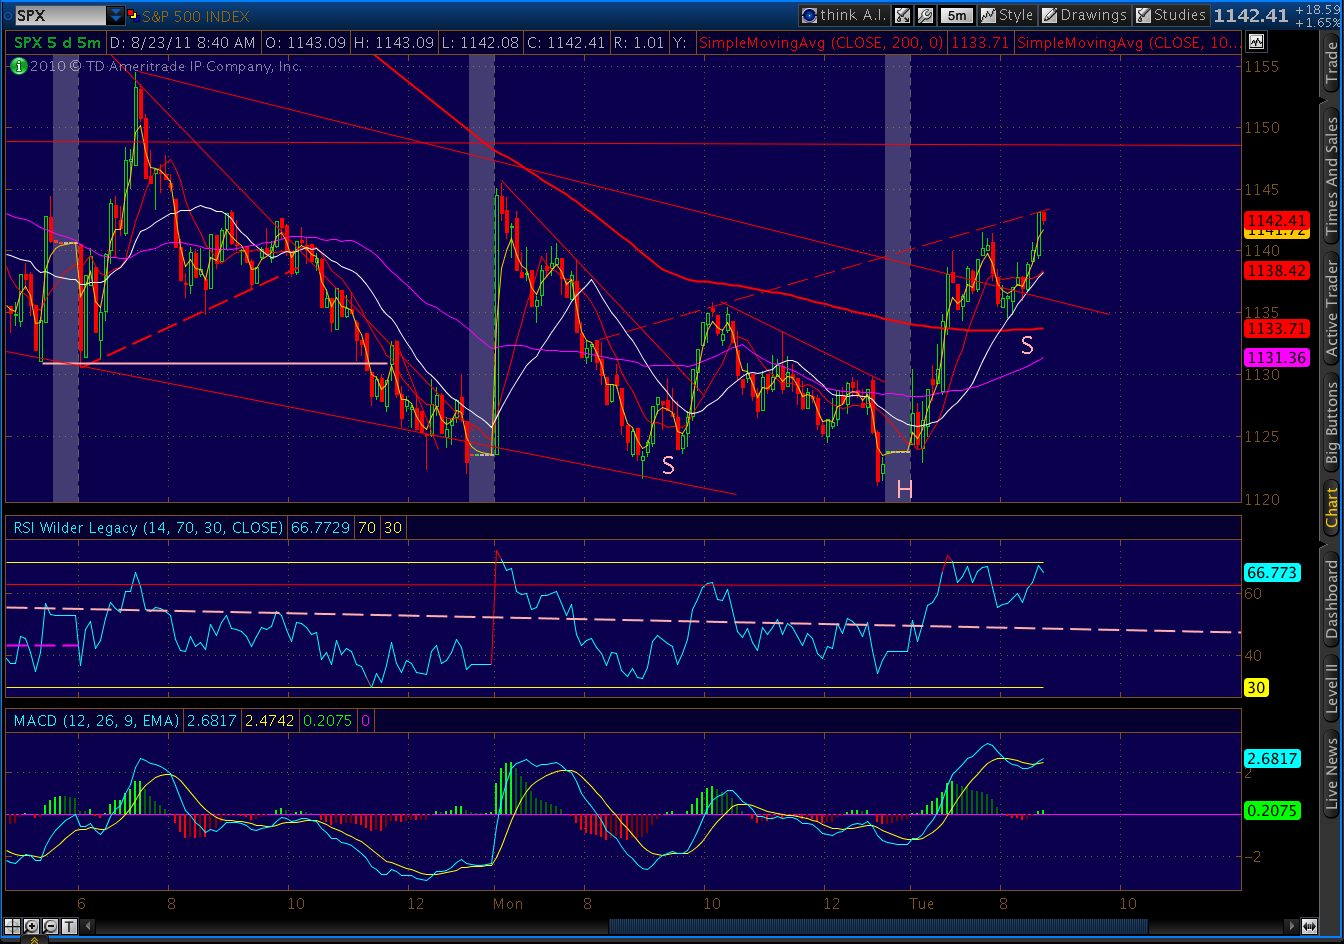
    Pretty impressive run by the bulls today, but still on low volume and marginal breadth.  At the very least, I have to expand the channel I drew yesterday.  I’m still confident that this is a 4th wave up, with the 5th to come very soon.  But, sheesh, I’m feeling a bit lonely in this point of view.

    Many of the indicators I watch are on the brink of turning bullish.  But, they’re on the brink, not beyond.  This tells me we’re at an inflection point, as today’s close at the .618 Feb retrace level would indicate.

    Besides all the obvious, I’m watching the dollar these past couple of days.  It’s been in a gigantic falling wedge for almost 1 1/2 years.  In May, it began traversing from one side to the other of this wedge, hugging a TL that offered great support until July 21, at which point it found support at a lower line.

    Shortly afterwards, DX started tracing out a falling wedge that just completed.  We broke out today, and are currently in backtest mode.  If the breakout holds, the next resistance isn’t until at least 75.25. 

    The next day or two should be very interesting.

    UPDATE:  1:15 PM

    The folks in our Conspiracy Department just floated an interesting idea past me.  If you’re a big investment bank or advisory firm and are angling for Ben to break open his piggy bank Friday, do you really want a big, fat rally on the books in the days leading up to decision time?

    If this thing gets going to the downside, don’t look for them to stand in the way.

    UPDATE:  1:00 PM

    Little H&S; pattern backtesting on the 5-min chart (redrawn on 1-minute.) It’s even completing its own little butterfly pattern.  Should reverse at 1169.

    UPDATE:  12:15 AM

    Additional potential targets for the Butterfly pattern, based on retracements/extensions of the DA leg:

    0.618 = 1142
    0.786 = 1133
    0.886 = 1128
    1.272 = 1107
    1.618 = 1089
    2.000 = 1069
    2.240 = 1056
    2.618 = 1036
    3.000 = 1016
    3.618 =   983

    Just a reminder, the H&S; pattern we’re tracking has potential to 1032.

    UPDATE:  12:00 AM

    Another great way of looking at the harmonic picture from the past few days is the Butterfly pattern started at Friday’s high.

    The pattern requires a .786 retracement of the XA leg (the first one down) and ends with a 1.272 or 1.618 extension of that same leg.  This one is almost perfectly formed.

    Butterflies are among the more precise patterns, and frequently lead to a sharp reversal that consumes the entire upward move.  I use the .618 Fib as my initial target, with 1.272 and 1.618 extensions as the ultimate goals.  In this case, that would correspond to targets of 1142, 1107 and 1089 respectively.

    The big H&S; pattern we’ve been tracking, the Big Ugly, is starting to look quite lovely.  It completes at around 1121.  Obviously, if the Butterfly pattern plays out in any meaningful way, it will complete and give us plenty of ammunition for a downdraft I’ve been expecting.

    One way to play this would be to initiate shorts or puts here, with stops at the 1175 level.  It also makes sense to keep an eye on the RSI trendlines.  The 60-minute still hasn’t broken yet, but the 5 and 15-minute charts have broken their trend lines and are in backtest mode.

    I think the market will pick up on this and start heading down very soon.

    UPDATE:  11:00 AM

    We just had a nice reversal off the .618 Fib line and the channel I posted about earlier (TOS does a poor job of keeping TL’s where they belong when you switch from daily to 60 min, so the upper line is redrawn here as the faint red line. )

    The bears won’t be out of the woods, however, until the RSI trend line (red, dashed) is broken.  Until then, this pullback could be just a correction of the temporarily overbought condition.  Stay tuned.

    UPDATE:  3:40 AM

    The dollar is showing some strength overnight. 

    I’ve been watching DX, wondering if it was ready to break out of the falling wedge it’s been in since…forever.  Now it’s in a falling wedge within that falling wedge, and seems to have found good support in the white dotted line.

    Note that the crab pattern that played out so perfectly at the 1.272 extension has, with a retracement to the .50 level, morphed into a potential bat or even crab pattern.  The .886 (minimum) level would be all the way up at 80.635.  Such a rally would no doubt be deadly for stocks.

    ORIGINAL POST:  3:00 AM

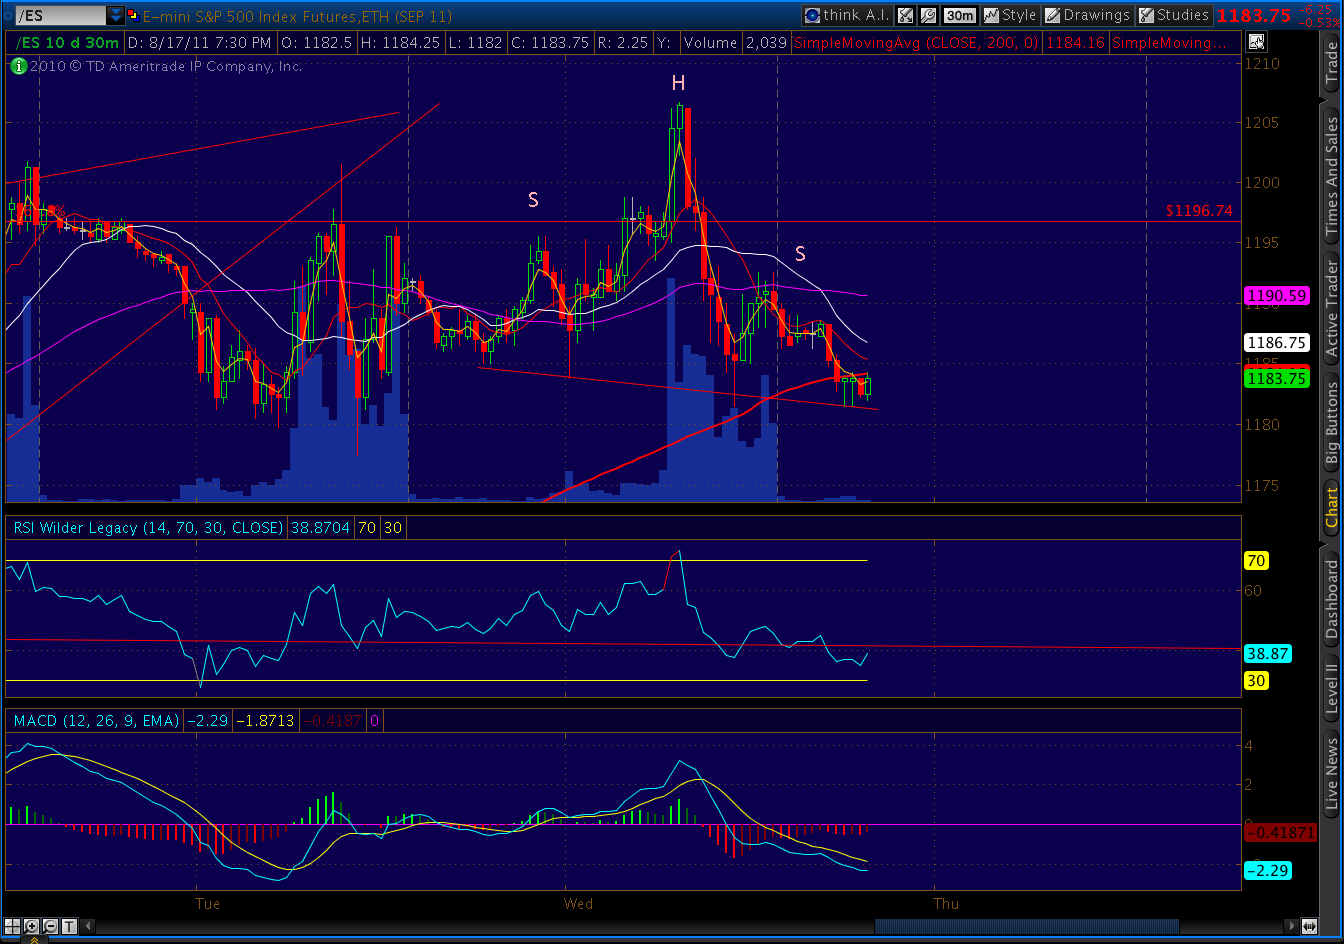
    Today’s push to 1162 was the perfect follow-through to a pattern in which I hadn’t put a lot of stock — the inverse head and shoulder pattern I posted about at 11:45.  It called for a rise to 1161.

    The rally also completed a bearish Butterfly pattern (one of a few), the 127.2 extension of which was at 1163.38, and established a better looking right shoulder than we had before for a larger bearish H&S; pattern.

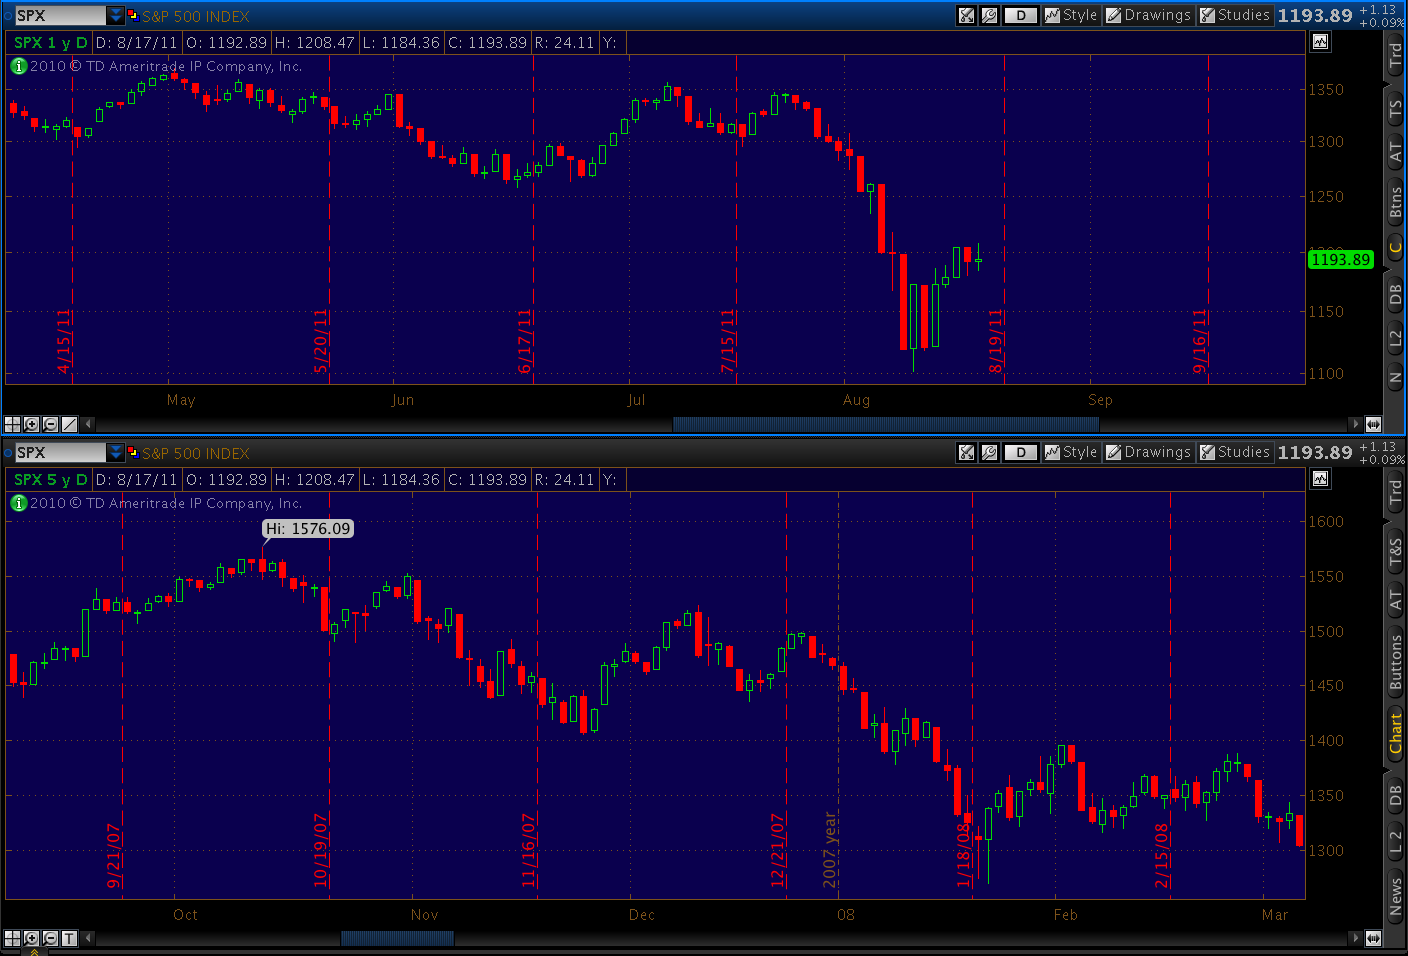
    The big question now is follow through.  Volume and breadth were light today.  For all the excitement, SPX was stopped cold at the 10-day moving average and the gap from Aug 10 on the daily chart.  And, the histogram is still in negative territory.

    Further,  I don’t see five waves down yet.  And, this bear market isn’t a great candidate for a truncated 5th wave.   I would like to see more evidence of capitulation before believing the upturn is here.

    Last, I think there’s a good chance the H&S; pattern we’ve nearly completed plays out.  It has potential to 1032. 

    We’re in a steep and narrow channel (white lines) down from the July highs.  The top trend line of that channel will be the key as to whether we continue down or break higher.  There is also a corresponding trend line on the RSI that I’ll be watching like a hawk.

    There’s also a good possibility that the trend line (red, dashed) from the May 2 high, together with the channel top TL, will combine to form a falling wedge for the eventual bounce back up to test the previous 1258 lows.

    Unless we get strong follow-through tomorrow, I’m operating under the assumption that the bears are still in control and we’ll establish a new low around 1067, with 1040 and 1010 being subsequent targets. 

  • Intra-day: August 23, 2011

    UPDATE:  12:25 AM

    Fan Line C to the bears’ rescue!

    I count that as five rallies stopped in their tracks (Aug 9, 10, 19, 22 and 23.)

    Not bad, Line C, not bad at all.


    UPDATE:  11:45 AM

    And a counterpoint, an IH&S; pattern on SPX completing at 1143.  It has potential to 1161.  If it plays out, it would certainly gussy up the Big Ugly pattern, evening up the shoulders very nicely.

    If this rally extends as a result, it might end up looking something like this:

    Note the 1161 target coincides pretty well with a 1.272 extension of a larger potential Butterfly pattern.

    UPDATE:  11:15 AM

    An update on Big Ugly — the larger H&S; pattern we’ve been watching.  It has bearish potential to 1032. 

    UPDATE:  10:40 AM

    Little Gartley setting up on the 5-minute chart.  Should reverse at the .786 retrace at 1140ish.

    UPDATE:  10:00 AM

    US new housing sales continue to tumble, coming in at 298,000 versus expectations of 310,000.  June was revised down from 312K to 300K, so don’t be surprised if July’s aren’t similarly adjusted.

    And, a reminder, these figures were for the calendar month, meaning the full impact of the stock market slide won’t be felt until next month.

    And, from the Eurozone, an update on German economic conditions/expectations from the Center for European Economic Research.  Pretty dismal readings.

    The view from there is that the German economy is sliding.  Those who ranked the German economic situation as “good” fell from from 90% to 57%.  The Eurozone “good” rating fell from 13% to 6%, while “bad” leaped from 10% to 25%.

    And, what do they think of the good ol’ USA?  “Bad” grew from 40% to 58%, with “good” sliding to an absolutely horrid 1.1%.  According to news reports, the McGraw-Hill board is preparing pink slips for the survey participants.

    ORIGINAL POST:  2:00 AM

    Perhaps it’s the S&P; news, but the futures are making another bull run tonight — currently up 11 to 1134.  A note of caution:  at 1140 there’s a potential inverse head & shoulder pattern that would complete.  If it plays out,  it’s got upside potential to 1180 or so.

    Why do I always preface these predictions with “if it plays out?”  Because none of these indicators are foolproof.  They’re all subject to being overtaken by important events, politics, fed action.   Think Fukushima, QEn, etc.

    Here’s a H&S; pattern on the eminis that didn‘t play out, just this morning.


    It was just as well-formed, and had nice downside potential to 1092.  This evening’s runup to 1134 might negate it, since the right shoulder has been exceeded.  Or, has it?

  • S&P CEO Fired for Telling the Truth

    Reprinted in its entirety from Zerohedge.  I have nothing to add.


  • Fantastic Fans

    Just a quick check on how the fan lines from the Oct 07 top and Mar 09 bottom have done so far.  First, the big picture…

    And, a close up of how well they’ve done lately in guiding price moves…

    Their performance has been nothing short of stunning.  The Mar 09 fan lines (numbered) did an amazing job of guiding the Jul 10 through July 11 action.   Breaking Line #1, for instance, was the beginning of the end for the bull market.  Line #2 stopped the July 11 dive and, when we finally broke it, gave us a 200-point plunge.  Line #4 provided important support and resistance over the past 1 1/2 weeks.  Line #5 gave us an important bottom last week.  And, so forth.

    The Oct 07 lines (lettered) have, thus far, defined every major move since the Feb 11 top — often supplying key support at a critical time.  Consider Lines A and B, both of which stopped serious declines.  Line D stepped in to stop the Aug 10 decline.  And, just this morning, Line C stopped the rally attempt cold.

    The points that interest me the most are where fan lines intersect.  They often take on outrageous importance.  The bottom we made on Aug 10, for instance, was the intersection of Line D and Line #5.  Other important intersections were the Mar 16 and Jun 16 bottoms and the recent Aug 17 high.

    As always, the important question is “what’s next?”  I’ve mentioned more than a few times that I think we should get to at least 1067 in the next few days.  This is the intersection of the midline of last summer’s W pattern ((Line #6) and a fan line crossing through the top of it (Line E.)

    Another logical target is line #7, which is actually a fan line between the Feb 9. 2009 low and several key lows in last summer’s pattern.  It’s at around 1040.

    Next up is 1010, which is obvious horizontal support from the low on Jul 1, 2010.  Beyond that, well…  let’s just say there lots of possibilities.  But, don’t be surprised if most of these lines continue to play major roles over the next couple of months.

  • Intra-day: August 22, 2011

    UPDATE:  7:20 PM

    Here’s the latest 2007 v 2011 comparison.  As we discussed last week, the current pattern is slowing relative to 2007/8.  But, for the bears, it’s worth the wait.

    New home sales are due out in the morning.  Consensus for July is 310K versus June’s 312K and 315K in May.  Keep in mind that July’s figures will reflect only the early few days of the current market swoon, so we may not see as great an impact on sales as we will in subsequent months.

    UPDATE:  4:05 PM

    This one worked out pretty nicely so far.  Note the role that the RSI trend line played, as well as a TL off the three pattern tops (the head, the right shoulder and the backtest.)  We’ll see tomorrow if it plays out all the way, reaching its target of 1117.

    Not all of these work out perfectly.  They can be overwhelmed by greater forces, especially these little ones.  But, they’re very effective for day trading and giving guidance on the bigger forces at work.  And, as I mentioned earlier today, they often kickstart larger patterns.

    This one, for instance, gave us a good push below the neckline of the big, ugly H&S; with potential to 1032 (see 1:35 update below).  It also confirms the target of a small H&S; pattern from Friday that targets 1114.

    UPDATE:  3:10 PM

    Got a more substantial wave down and are coming back for a larger backtest.  Might fail here, or with another touch of the original RSI trend line (dashed purple.)

    UPDATE:  2:40 PM

    So far, so good on the little H&S.;  Broke the neckline, and are backtesting it now.  Never even came close to the RSI TL, so I’ve drawn a new one to reflect the next trend.

    From the looks of things, we should turn down from here.

    UPDATE:  2:15 PM

    To better answer dm’s question….  Here’s another little H&S; setting up within the shoulder of the 5-minute chart.  If the right shoulder of this pattern exceeds the head, obviously it’s busted.  Such a move will likely play into a harmonic pattern and reverse at the .786 or .886 retrace.

    But, if it confirms by moving decisively (“closing” if on a daily chart) below the neckline around 1128, it’s good for an 11-point decline to around 1117.  I know it’s not a huge move, but it’s very tradeable if you’re so inclined.  More importantly, it takes us below the neckline of the larger H&S;, which would help nudge that larger pattern into action.  Like ripples in a pond.

    Let’s see how it plays out.  I’m also keeping an eye on the RSI, in particular the shaded oval.  The right shoulder should complete somewhere before the RSI passes through the TL drawn through that oval.

    UPDATE:  1:35 PM

    Here’s yet another way of looking at the big, ugly H&S.;  This drawing has bearish potential to 1032.

    Tom Bulkowski has a fantastic website (and great books, too), and discusses H&S; patterns extensively.

    UPDATE:  1:15 PM

    I watch for harmonics all day long on the 5-minute chart.  And, I try to take a frequent peek at the 60 minute and daily charts, too, just in case I’m missing something that’s bigger than my screen.

    Here are several possibilities shaping up right now, as we bounce off the just completed H&S; neckline — a bounce that’s almost always to be expected, by the way, just like trend lines.

    This is a bearish bat pattern that would reverse around 1138.50.

    This one has an alternate entry (X) point, but the B retracement is not quite to the .382 level.   I slightly favor this pattern, because the .886 retrace (1142.83) takes us almost to the right shoulder and traps a lot of bulls who think the H&S; won’t play out, before plunging back down.

    Here’s another possibility — a bearish butterfly that’s already completed at the 127.2 extension.  But, because it’s smaller, it might be good for only a smaller reversal on the way to completing one of the larger patterns shown above.   These things very often nest inside one another.

    By the way, the white dashed line you can see just above (and stopping) the last advance at 1135.83 is the neckline from the other H&S; pattern I just posted at 1:10.  So, if we’re able to hold below these levels, it makes me like that H&S; pattern that much more.

    UPDATE:  1:10 PM

    Here’s another H&S; pattern with bearish potential to 1053.  It’s not very well formed, but sometimes the ones with ugly right shoulders perform the best.  We could look at this morning’s rally as backtesting the neckline.

    UPDATE:  11:30 AM

    We’re 7 points away (1121) from completing a H&S; pattern that, in a normal market, would take SPX down to 1095 or so.

    Since it would represent such a massive reversal of this morning’s action, I would expect it to have a lot of momentum as it falls, especially once we crack 1100.

    UPDATE:  10:50 AM

    The rally this morning can be characterized as a backtest of the fan line we broke through several sessions ago.  It’s the red dashed line, drawn off the Oct 2007 high through the high of the Nov 2010 “W” pattern.

    Seen here, closer up.

    Once the backtest is completed, we should be able to get on with wave 5 to 1067 or below.

    UPDATE:  9:50 AM

    We got the reversal at 1146.50, a little shy of the target price.  It’s possible we’ll go back up and tag the target price before the decline progresses any further.  But, this is looking like a pretty good reversal so far.

    Interesting, in that the cash market is following the futures’ lead on this one.  Often, the cash market takes over on the opening and can negate a pattern established in the futures.

    These harmonics patterns can obviously be very effective.  Like Elliott Waves, they don’t care much about earnings per share or Fed comments or CNBC breaking news.  Although, those triggers are often credited for the move that the harmonics pattern correctly forecast days in advance.

    Aside from creating great trading opportunities, they can mentally prepare an investor for a coming turn.  This comes in handy when, like this morning, you wake up to a 20-point rise in the futures market that threatens your short positions.  A quick look at the bat pattern, and I knew there was a good chance the bulls run was about over.

    My gut tells me that when the rebels take full control of Tripoli, oil will resume its near-term decline (light sweet crude hit 84.43 this morning.)  This is good for our economy in the long run, but I expect it would hurt stocks in the short run.  Oil companies have used high crude prices to generate record profits; they compose 12.5% of the S&P; 500.

    Another angle is that falling oil prices might give the Fed the inflationary headroom it needs to bring on another round of QE.   It’s still an awful idea, but lower prices at the pump might justify their contention that stagnation and deflation are the greater risks to the economy.

    After the Fed pumps another $500 billion into the system, oil companies can go back to raising prices and making billions in earnings and the Fed can go back to inflation whack-a-mole.  Just a thought.

    UPDATE:  1:00 pm … a WSJ reporter’s take on the situation:

    ORIGINAL POST:   9:25 AM

    The futures, at 1144.75, are completing a bearish bat pattern, with the .886 retrace at 1148.46.  This rally should reverse very soon.

    This rally is the follow through to the bullish butterfly pattern I discussed in Friday’s 2:40 post.   We were looking for a turn at 1124, and got it at 1122.05 instead.

    Here’s the chart I posted at that time.

    And, here’s the completed pattern.  Note we also completed a falling wedge, that also forecast a bounce.

    The little H&S; pattern that indicated a downside to 1114 has likely played out, as this morning’s rise exceeds the right shoulder high.

  • Intra-day: August 19, 2011

    UPDATE:  4:15 PM

    SPX ended at the lows of the day, a good sign for the bears.  However, there’s a little divergence set up on the short term charts, so we might see a little bounce in the immediate future.  I would imagine we at least fulfill the H&S; pattern (to 1114) first.

    UPDATE:  3:08 PM

    The H&S; pattern is battling a potential falling wedge and OPEX for control of the close.  Should be interesting.

    UPDATE:  2:40 PM

    SPX is working its way toward completing a small bullish butterfly.  While I wouldn’t expect much of a reversal here, it might be good for identifying the next intra-day bounce.  The 1.27 Fib is at 1124 and the 1.618 is at 1115.93 — very close to the H&S; target mentioned below.

    UPDATE:  12:50 PM

    SPX just completed a little H&S; pattern on the 5 minute chart.  Potential is to 1114.

    ORIGINAL POST:  10:05 AM

    Good morning, all.  Gold just extended to the 3.618 Fib level on the bearish Butterfly pattern we’ve been watching.  At the risk of crying wolf, maybe this is the magic number.

    Just a reminder… the butterfly pattern is normally very powerful, producing strong reversals at the D point.  But, as we’ve seen, identifying that D point can be frustrating.  The rules state that it must be at an extreme Fibonacci number, but this has taken “extreme” to a whole new level.

    While we’re waiting for the market to reach its target, I thought I’d do a little exploration on gold margin increases.  There were six increases in 2009 – 2011.   They’re marked on the chart below with yellow asterisks; the four decreases are marked in purple.  The equivalent SPX dates are also marked.  

    I’m looking for patterns in how and when margin requirements are changed, and whether such changes are related to activities in the stock market.  Several of the increases follow run-ups in price, but there are several rapid price increases with no corresponding margin increase, the most notable being in early 2009.  There have also been several cuts at a time when prices seemed on the rise. 

    One interesting observation is the way stock market declines seem to follow gold margin decreases.  It happened three out of four times since January 2009.  I suppose it’s possible that CME anticipated stock market weakness, and lowered margin requirements to permit accumulation of positions in advance; but, no one’s that good at predicting the stock market.

    CME states that initial and maintenance margin rates are based primarily on volatility — the goal being to prevent member firms from collapsing and endangering the exchange.  Margin decreases would therefore be instituted during periods of perceived and expected low volatility (not the same as price decreases.)

    Expectations of low gold volatility would likely exist during times of expected stock market and USD stability and/or low inflation.    Let’s take a look at the dollar versus gold.

    It seems that gold margin increases often follow major bottoms in the dollar.  Given that the dollar and stocks are increasingly negatively correlated, this could be pretty useful information for stock investors.

    Since gold’s rise has been both parabolic and volatile of late, it’s not hard to imagine another margin increase is on the way.  Might this mean both the dollar bottom and stock market top are in?

  • The Stock Market’s Doppelgänger

    A Doppelgänger, which in German means “double walker,” is a double or a duplicate.  In folklore, it’s a ghostly replica of another person whose appearance is a harbinger of death.  In the stock market, it’s a harbinger of market crashes and financial death. 

    I’ve been following the similarities between the 2007 and 2011 markets since May [for a chronology, see OMG, WTF and Money Back Guarantees.]  The similarities in both price and time have been astounding. For the uninitiated, here’s a quick snapshot.

    Of course, the relevant question when SPX is off over 200 points is “what’s next?”  In my opinion, the near term is to at least 1070, possibly as soon as tomorrow.   Take a look at the past five years, and a very interesting channel that’s developed.
    I believe there’s a good chance we see a bounce off the upper end of the channel, currently around 1067 (of course it declines daily.)
    Note also that the comparable 1/23/08 low lined up with a large dip in March 2007.
    The equivalent dip in the past year, of course, was April – August 2010.  It just so happens to coincide nicely with the upper channel line from the chart above.  That line, BTW, is actually a fan line since it originates at the 10/11/2007 high.
    It touches the Apr 26 2010 high on its way to 1067 (today’s value.)  Other potentially relevant fan lines are marked as well.  Note, for instance, that we initially stalled this morning at the fan line touching the Nov 5, 2010 high — a miniature copycat of the Apr-Aug 2010 pattern.
    I’ve also marked relevant horizontal support trend lines from that pattern, which is fast becoming the more relevant touchstone for the market’s present direction.
    One caveat: since this is a P[3] rather than a P[1] down, we can expect to see anomalies develop in the 2007/2011 comparison.  We’ve already seen one big one, with a wave 3 down that greatly exceeded its 2008 equivalent in price.  It wouldn’t surprise me if the current wave 5 was similarly larger in comparison to its 2008 equivalent.
    After the bounce, then what?  Again, since this is P[3] and not P[1], the ultimate decline will be greater than in 2008-2009, which was a mere 900 point drop in the S&P; 500 and 7,700 points on the Dow.

    From a macroeconomic standpoint, there’s ample evidence that this economy is just as troublesome as 2007’s.  Morgan Stanley may have finally acknowledged it, but the trend has been obvious for months.   Unemployment, plunging consumer confidence and an increase in underwater real estate will prevent any meaningful recovery.  Debt continues to be the key.

    The headlines are the same as 2007; only the names are different.  Instead of Lehman, Bear and AIG we have Greece, Ireland and Italy — not to mention a whole boatload of banks that still haven’t dealt with their bad loans and face increasing litigation risk.

    Can a crash be averted?  Thanks to Texas Gov. Rick Perry and inflation headlines, Bernanke is unlikely to get off another round of QE.  And, there’s rising acknowledgement that QE really only helped Wall Street.  The bottom line — this time we’ll complete the crash that QE prevented the first time around — a crash that will have investors wishing there were no such things as ghosts.

  • Intra-day: August 18, 2011

    UPDATE:  3:30 PM

    I can’t for the life of me figure out why investors ignore chart patterns.  


    Someone could make a very nice return on their portfolio by focusing solely on rising and falling wedges.

     
    UPDATE:  12:55 PM


    An explanation of my 1070 target.

    Take a look at the past five years, and a very interesting channel that’s developed.
    I believe there’s a good chance we see a bounce off the upper end of that channel, currently around 1067 (of course it declines every day.)
    Note also that the comparable 1/23/08 low lined up with a large dip in March 2007.
    The equivalent dip in the past year, of course, was April – August 2010.  It just so happens to coincide nicely with the upper channel line from the chart above.  That line, BTW, is actually a fan line since it originates at the 10/11/2007 high.
    It touches the Apr 26 2010 high on its way to 1067 (today’s value.)  Other potentially relevant fan lines are marked as well.  Note, for instance, that we initially stalled this morning at the fan line touching the Nov 5, 2010 high — a miniature copycat of the Apr-Aug 2010 pattern.
    I’ve also marked relevant horizontal support trend lines from that pattern, which is fast becoming the more relevant touchstone for the market’s present direction.
    One caveat: since this is a P[3] rather than a P[1] down, we can expect to see anomalies develop in the 2007/2011 comparison.
    We’ve already seen one big one, with a wave 3 down that greatly exceeded its 2008 equivalent in price.  It wouldn’t surprise me if the current wave 5 was similarly larger in comparison to its 2008 equivalent.
    After the bounce, then what?  Again, since this is P[3] and not P[1], the ultimate decline will be greater than in 2008-2009, which was a mere 900 point drop in the S&P; 500 and 7,700 points on the Dow. 

    UPDATE:  12:35 PM

    SPX finishing off a little rising wedge and bearish Gartley pattern.  Should see resumption of selling here at 1148.

    UPDATE:  9:55 AM

    The sell-off is looking pretty vicious, as expected.  If we follow the 2008 script we should end up somewhere around 1070 — possibly by tomorrow.  But, since wave 3 was stronger than in 2007, it’s entirely possible wave 5 will be, too. 

    More later.

    UPDATE:  9:20 AM

    As I mentioned last night, these figures are going to make cases both for and against QE.   Unemployment, along with business conditions, is getting worse.  But, inflation is also on the rise.  In the late 70’s – early 80’s, we called this stagflation.  But, we didn’t have the same oppressive levels of debt to contend with.  Throw in the debt — with tentacles strangling consumers and governments alike — and the ongoing stock market crash and we have the perfect setup for another depression.

    *************

    EXISTING HOME SALES:  Sales off 3.5% from June to annual rate of 4.67 million versus expectations of 4.99 million.  This completely negates the increase in pending sales recently reported.  Median prices also fell, coming in at $174,000, down 4.4% from July 2010.  June prices were revised sharply down from $184,100 to $176,100.  Cancellations continue to be a problem, due largely to appraisal and loan issues.

    PHIL FED BUSINESS OUTLOOK:  Ugly on a stick, with indicators declining sharply across the board.  Note the special questions on the last page: 30% are planning plant shutdowns or cutbacks this summer.  More unemployment on the way.

    INITIAL CLAIMS:  No surprises here.  More of the same bad news, with 408K new claims as opposed to the 400K Wall St expected.  Continuing claims at 3,702K versus expectations of 3,698K.

    CPI:  No real surprises here.  The index lags, of course, so energy is likely to fall significantly if/when a drop in oil prices works its way through the system.  New cars are flat, confirming auto manufacturers have no pricing power whatsoever.  Would not want to be long GM at this point.

    CONFERENCE BOARD:  Leading economic indicators — has to be considered a puff piece given the contrary data in every other report released this week.

    ORIGINAL POST:  12:55 AM

    First, an update on our 2007 vs 2011 comparison…

    It has come to my attention that EWI has now officially embraced the comparison I first discovered in May.  Apparently they’ve gone from questioning (on July 15th) whether there’s any “forecasting benefit in analyzing this chart” and “haven’t found any price and time relationships between the two moves that would allow a more specific forecast” [see OMG, WTF and Money Back Guarantees]  to “the structures remain remarkably similar.”

    It’s too bad they didn’t jump on board in July — before the 200-point move.  Better late than never, right?

    ECONOMIC DATA

    For anyone who’d like to peruse tomorrow morning’s reports themselves, these are the links that should work.  As always, I’ll try to get at least a synopsis posted as quickly as possible.  But, it might be a busy morning.

    CPI:   http://stats.bls.gov/cpi/

    Initial Claims:  http://www.dol.gov/opa/media/press/opa/

    Existing Home Sales:  http://www.realtor.org/research/research/ehsdata

    Leading Economic Indicators:  http://www.conference-board.org/data/bcicountry.cfm?cid=1

    Philadelphia Fed Reserve Report:  http://www.philadelphiafed.org/research-and-data/

    Also, worth a look: yesterday’s Bloomberg interview with Philadelphia Fed Governor Plosser.

  • Intra-day: August 17, 2011

    EOD:  11:15 PM

    I have a feeling tomorrow’s going to be a busy day, so this is my last post for today.  CPI and initial claims come out at 8:30am (5:30 for us on the left coast), existing home sales, Philly Fed and Leading Indicators at 11:00.  I know things are supposed to be quiet the day before OPEX, but tomorrow could be quite the exception.

    My crystal ball tells me CPI will follow the PPI path and be a little higher than most would like — a problem if you’re counting on QE.  Initial claims and home sales might be the counter-argument.  The dollar is firming nicely as stocks sell off tonight, so at least someone agrees with me.

    A small H&S; pattern just completed on the futures that indicates a downside of 1157 (1160 on SPX.)  I still view this past week’s rise as a rising wedge that’s being backtested.  The backtest is obviously taking a little longer than usual, but the case is still intact.  As discussed last night, my initial goal on the downside is 1070.

    UPDATE:  8:50 PM

    Gold’s fundamental picture has been frustrating.  It’s hard to reason with irrational zealots, and I think that’s where gold is, now.  Virtually anything that happens seems to be a cause for it to go up.

    Stocks down?  Gold is the safe haven.  Dollar’s down?  Gold is the better currency. Inflation/QE coming?   Gold is the best hedge.  No QE?  Stocks will fall and gold will protect you.  One of those arguments no doubt makes sense while the rest will prove to be utter BS.  But, they can’t all be right.

    Seemingly, gold’s only kryptonite is margin increases, another one of which is likely on the way (see the yellow asterisks on the chart below.)

    From a tech standpoint, I’m heartened by the narrowing range of the rising wedge. We’re still in backtest mode and have gobs of divergence with MACD and RSI.  Something’s gotta give.

    UPDATE:  2:15 PM

    What’s behind Target’s fall from this morning’s ebullient highs?  TGT had a great earnings report, right?

    Maybe analysts are actually poking around, trying to make sense of the numbers.  They’re right here, for anyone to see.  But, many investors and far too many money managers can’t be bothered.  The thought process goes something like…

    Sales were up 5.1%.  That’s pretty good…but, wait, same store sales were only up 3.9%.  Hmm… that’s not so great…but EPS were up AN AMAZING 11.5%!  [call broker to double the order].  Wait, I don’t get it… net earnings were only up 3.7%, from $679 million to $704 million.

    Drilling down…drilling down….wait, what’s this?  Credit card expenses were $15 million versus $138 million last year!?!  That’s a huge frickin’ drop.  It accounts for ALL of the increase in net earnings FIVE TIMES OVER!  [call broker, cancel that order].

    Credit card delinquencies have been falling nationwide, but the numbers are still pretty staggering.  In July, annualized write-off rates were 7.43% at BofA, 6.64% at Citi and 4.78% at Chase.  AMEX had an industry best 2.8%.

    Target’s rate this time last year was 7.8%.  So, how is it they’re currently running 1.0%?  Perhaps the most telling note in these financial statements is the one we tend to skip right over: “unaudited.”

    I’m not blaming Target for doing what almost all public companies do.  They’re trying to reward shareholders in an economic environment that’s increasingly challenging.  Given this morning’s increase in PPI, a crappy employment picture and disappearing consumer confidence, this may be as good as it gets.

    But, the next time your broker pounds the table about great corporate earnings and wonderful buying opportunities, take a closer look.  Like Target and Staples, there’s usually more than meets the eye.

    UPDATE:  11:00 AM

    I answered a question yesterday as to how OPEX might affect my market outlook for this week.  Just noticed that the equivalent week in 2008 was also an OPEX week and ranged from a high of 1418 on 1/14 to a low of 1312 on 1/18.  It was a holiday weekend, and when the market reopened on 1/22 it fell to 1274 before recovering to 1310.  Food for thought.

    UPDATE:  10:00 AM

    The Staples results are typical of the kind of reporting sleight of hand being played on Wall St.  The headline is that profits were up 36%, and EPS jumped from 18 to 25 cents.

    Only when you read all the way to the end of the article do you find out that the 1.7% increase in North American sales was 0.1% before foreign currency benefits.  The 15% increase in international sales was actually a 0.1% decrease before foreign currency benefits.  And, $21 million of the $46 million increase in earnings was the result of a tax refund.  The stock’s currently trading at 14.5, up from 12.5 a week ago.

    The headline could have read:  Myopic Investors Duped Again

    UPDATE:  9:35 AM

    It’s ugly as these things go, but I would be remiss in not mentioning it.  There’s a large inverse head & shoulders pattern near completion — seen here on the 30 min chart.  If it plays out, it would indicate potential to 1308.

    ORIGINAL POST:  9:25 AM

    PPI reported this morning.  Bottom line:  a whopping 7.2% y.o.y. increase in finished goods prices might make QE that much tougher a sale.   The monthly increase was .2% (versus .1% expectations) and the core increase was .4% (versus .2% expectations.)

    That 7.2% pales in comparison to an 11.6% increase in intermediate goods prices and a 22.6% increase in crude goods prices.  Apparently, manufacturers are having a great deal of difficulty passing increased commodity costs along down the processing food chain.  This reinforces the data reflected in the Empire Mfg report just out.

    It’ll be interesting to see if higher prices pass through to CPI due out tomorrow.

  • A Turning Point?

    LAST NOTE (MAYBE):

    Couldn’t help noticing all the registration notices floating past on TOS Live News just now.  For some reason, insiders don’t seem all that bullish on their own stocks…

    Lots of talk about the McClellan Oscillator (MCO) today.  For anyone interested, here are the relevant points:

    Note that we’re in good shape in terms of a suitable place to take a little plunge.

    ADDITIONAL NOTE:

    Obviously we’re extending both time-wise and price-wise compared to 2007/8. The price aspect makes sense, this being P3 and all.

    The time aspect is a little thornier. I take it to mean there is more second-guessing as to what’s going on. After all, we’ve been here before. There is a huge amount of disbelief/denial that we’re going through it all over again.

    It’s been 17 trading days since the 1346 interim high on 7/22 (the equivalent 2007 date was 12/26.)  Back then, it took 18 days for the market to hit bottom.  If the pattern continues to take a “little longer” than in 2007, we should expect wave 5 to play out sometime this week, possibly even tomorrow.

    If, thanks to OPEX, it doesn’t happen till early next week — that’s okay, too.  I won’t start freaking out unless we bump up past 1258 without reaching a new low first.

    As far as targets go, I’m hoping for but not counting on a huge downdraft.  This could all be over as high as 1070.   The rally, probably the result of a Jackson Hole pronouncement, should be pretty quick.  If it follows the 2008 pattern, it would take us back most of the way to 1258 within 7-10 trading days.
     

    ORIGINAL POST:

    Setting aside the economy for the moment, how do we look relative to 2007-2008?   I’ll focus on three key price moves.

    (1)  The first major move down off the top.  Here, the time was almost identical, but 2007 was the greater percentage move by a substantial margin.

                                       2007                              2011            

                            10/11 – 11/26/07                5/2 – 6/16/07
                                      31 TD                             32 TD
                        1576 – 1406 (10.8%)        1370 – 1258 (8.2%)

    (2)  The corrective wave back to the interim high.  The 2011 move took several days longer, even though the percentage move wasn’t as great.

                                       2007                              2011            

                            11/26 – 12/11/07                 6/16 – 7/7/11
                                      11 TD                             14 TD
                        1406 – 1524 (8.4%)        1258 – 1356 (7.8%)

    (3)  The initial collapse.  This is the 28th day since the 1356 high, which is the amount of time it took to reach the 2007 low.  And, the percentage move has been significantly greater.  But, it appears to be unfinished relative to 2007.  That is, there’s no discernible 5th and final wave yet.

                                       2007                              2011            

                            12/11/07 – 1/23/08                   7/7 – ???
                                      28 TD                             28 TD ?
                        1523 – 1270 (16.6%)        1356 – 1101 (18.8%)

    If the pattern holds, it seems to me the final wave down should begin right away.  There are plenty of potential catalysts, as PPI, CPI, initial claims and existing home sales all report in the next two days.  In addition, there could very well be additional follow-through from today’s action in the Euro-zone markets.

    The SPX chart appears to be trending bearish again, as this past week’s rally seems played out.  We had a good start with the breakdown and backtest of the rising wedge and two intra-day bearish Gartley patterns.  In any case, we’re no longer oversold.

    If we can resume the downdraft by tomorrow, my initial target is 1070.