Category: Charts I’m Watching

  • The Art of Hat Holding

    One nice thing about patterns is that they give you something to hang your hat on.  When we drew the Inverted Head & Shoulders Pattern on Jul 3 [see: Holiday Headfake] there was nothing in the news to suggest a 100-pt rally in the ensuing week.

    Yet, SPX and ES landed within a point or two or their IH&S targets yesterday all the same.  Likewise, all the news was rosy yesterday — incessant talk of renewed buyout fever and imminent, glowing earnings reports.Yet, completion of the pattern, combined with a channel midline, put a pause on the rally right where expected.  With its SMA200 now a mere 30 points below its 2.24 extension, SPX can backtest any time it likes with plenty of support around 2700.

    In fact, if ES is able to hold the (formerly broken) channel into which it reinserted itself, the damage would be limited to 20-30 points.

    One key: VIX.  So far, it has put the brakes on at a backtest of the recently broken straw-man trend line.  If it can remain below the red TL and the SMA200, and USDJPY keeps ramping, stocks will suffer a mild pullback.  If the coming drops in oil and gas get going, then SPX will do well to hold 2750 and, depending on the PPI/CPI numbers due out today and tomorrow, could test 2700 again.

    If we should dip below the SMA200 and 2.24 extension again, then it’s time to hold on to your hat.

    continued for members(more…)

  • Update on USDJPY: Jul 10, 2018

    USDJPY reached our upside target this morning, tagging the top of the falling white channel from 2015.  This is the terminus of a move which began in late March [see: Algos to Markets – All Better.] This is a pivotal point for the pair, particularly since ES reached its IH&S target overnight.continued for members(more…)

  • Charts I’m Watching: Jul 9, 2018

    Futures are slipping higher this morning… …primarily on follow through from VIX’s dump below support.continued for members(more…)

  • Commitmentphobia

    Stocks did all they could, yesterday, to project renewed strength.  But, despite gaining 23 points, SPX didn’t break out of the falling channel it’s been in for a month.  Neither it nor ES were able to clear the neckline of their IH&S Patterns.  And, though DJIA finally closed above its 200-day moving average, it was by 3 points, literally in the final 10 seconds of trading.

    Toss in the fact that RB, CL, USDJPY and DXY are all sliding, and VIX remains above horizontal support, and you get the feeling stocks aren’t ready to commit to higher prices.

    It’s the same sense I get when I read the Fed minutes.  Things are going so great that they need to raise interest rates twice more.  But, they can’t shake the feeling that a recession is just around the corner.  So, they’ll probably stop hiking soon — coincidentally, right about the time the yield curve (as a result of their hikes) would otherwise invert.

    continued for members(more…)

  • Phoning It In

    If you liked Tuesday, you’ll probably like today.  We have an apparent overnight ramp in RB and CL (to the same overhead resistance)……a dip in VIX (to the same support)……and, another close by DJI below its SMA200.This time, S&P futures are up 17.5 points (previously 12) and still haven’t broken out of the falling channel from Jun 13 nor above the IH&S neckline.It’s not hard to imagine the instructions arriving from the Hamptons: “just don’t let it crash!”

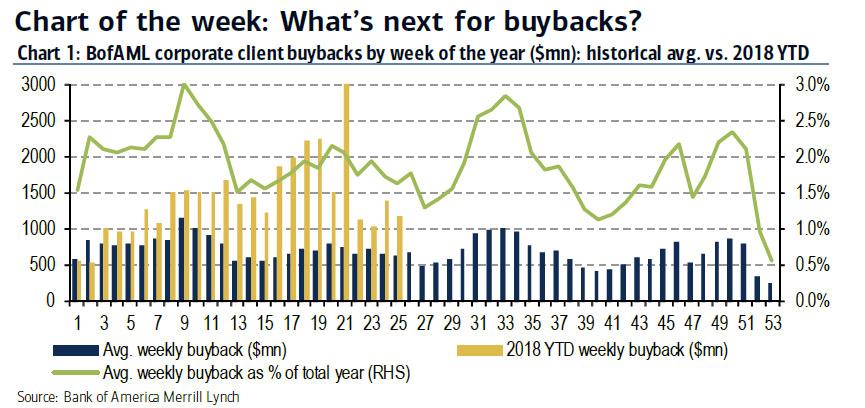
    And, speaking of crashes…I saw a few very interesting charts this morning.  The first depicted a pace of corporate buybacks that was shocking.  According to BAML, corporate buybacks are practically the only net purchasers so far this year.  Imagine that.

    The other put the rise in gas prices into perspective.  Most Americans are spending incrementally more on gas than they received in cuts from the recent tax bill. Take the lowest 20% earners and multiple the 8% of their income spent on gas in 2016 by the 30% YoY increase we’ve seen.  The 2%+ increase in expenses easily outpaces the zero-point-whatever benefit they received from the tax bill.  No wonder Trump is getting a little nervous.

    Or is he?  If you’re the leader of the free world and have a direct line to the leader of every friendly OPEC member, is a tweet really the most effective way to get your message across?  Or, is it just possible the tweets are window dressing, intended for his supporters?  Just a thought.

    continued for members(more…)

  • Holiday Headfake?

    The overnight ramp job might feel like the real thing……if not for USDJPY’s breakdown.  If the wizards really wanted to complete the IH&S Pattern and send ES soaring to 2800, there’s no way in the world USDJPY wouldn’t have held the TL it’s been working on since Jun 25. Note the negative divergence between the pair (higher highs) and ES (lower high.)

    VIX made a valiant effort.  And never say never, of course.  After all, SPX did bounce off the critically important 2.24 extension again.  And, holidays are notorious for nonsensical leaps over tall buildings. But, for the time being, this looks like a headfake.  ES 2743 and SPX 2741.50 are the (neck)lines in the sand.

    continued for members(more…)

  • Charts I’m Watching: Jul 2, 2018

    SPX reached our upside target quickly enough, but the reversal held off until the last hour of the day.Part of the problem, of course, was the CL/RB ramp.  The other was USDJPY, which popped through the previous high as expected.It won’t be enough, though, as the SMA200s are finally close enough to let volatility go where it wants.  The only questions are when and whether the SMA200s will hold.  ES’ SMA200 is only gaining about 1-pt per day, so there’s little value in delaying it any further.

    The nice thing about the all-clear is that oil and gas should finally be free to make their moves.  Without quarter-end equity numbers to protect, we should get some good action.

    continued for members(more…)

  • Calming the Markets

    Futures dipped a bit overnight as reports suggested Trump was considering withdrawing from the WTO.  For the second time this week, Mnuchin came to the rescue with a vehement denial.  And, for the third time this week, the algos got plenty of support from VIX shorting (breaking trend no less)……and USDJPY ramping. What a fitting end to a quarter where politicians, central bankers and corporate buybacks have set the tone, calming the markets at every turn.  Still, this isn’t exactly a bullish-looking pattern — especially when SPX fails to break out of the falling white channel.And, while everything appears copacetic, has anyone noticed that the Dow closed below its 200-day moving average for the past four sessions in a row?

    continued for members(more…)

  • Growth Estimates Reduced Again

    GDP was revised from 2.2% to 2.0% — highlights: personal consumption lower than expected, prices higher than expected.  The market was ahead of this, with rates continuing to slide.  Bottom line, it doesn’t make a terribly compelling case for two additional rate hikes. Futures are off about 10 points, tagging our next downside target a day ahead of schedule.SPX closed 2017 at 2673.61.  Can it hang on to its slight gain for two more sessions?

    continued for members(more…)

  • Charts I’m Watching: Jun 27, 2018

    SPX’s backtest of the 2.24 Fib extension and channel top was meant to establish strong support.  So, it was surprising to see futures dropping like a rock overnight.  Did the Masters of the Universe somehow miss the message that there would be no further drops this week — the final few days of the quarter and half-year?

    Not to worry.  A quick news release, and 25 points later all is well in the world again.continued for members(more…)