VIX and USDJPY have come to equities’ rescue (better late than never) again. And, the algos are loving it — so far, at least.
USDJPY, which has looked extremely weak ever since January, when two channels broke down, has broken out (again) above a trend line (red, dashed) from Jan 8. It’s latest reincarnation began on Sunday and contributed to yesterday’s huge rebound off our downside target. Likewise, VIX gave the bulls a shot of adrenaline, with a drop back below the rising channel bottom from early January. The trick is figuring out whether or not the drop will stick this time.
 Meanwhile, our FB and yield curve models are still shouting “sell!” We’ve seen major trends broken in the past two months — largely because our algo inputs were unable or unwilling to keep the crap game afloat. Can the algos pull off a rescue that sticks this time?
continued for members…
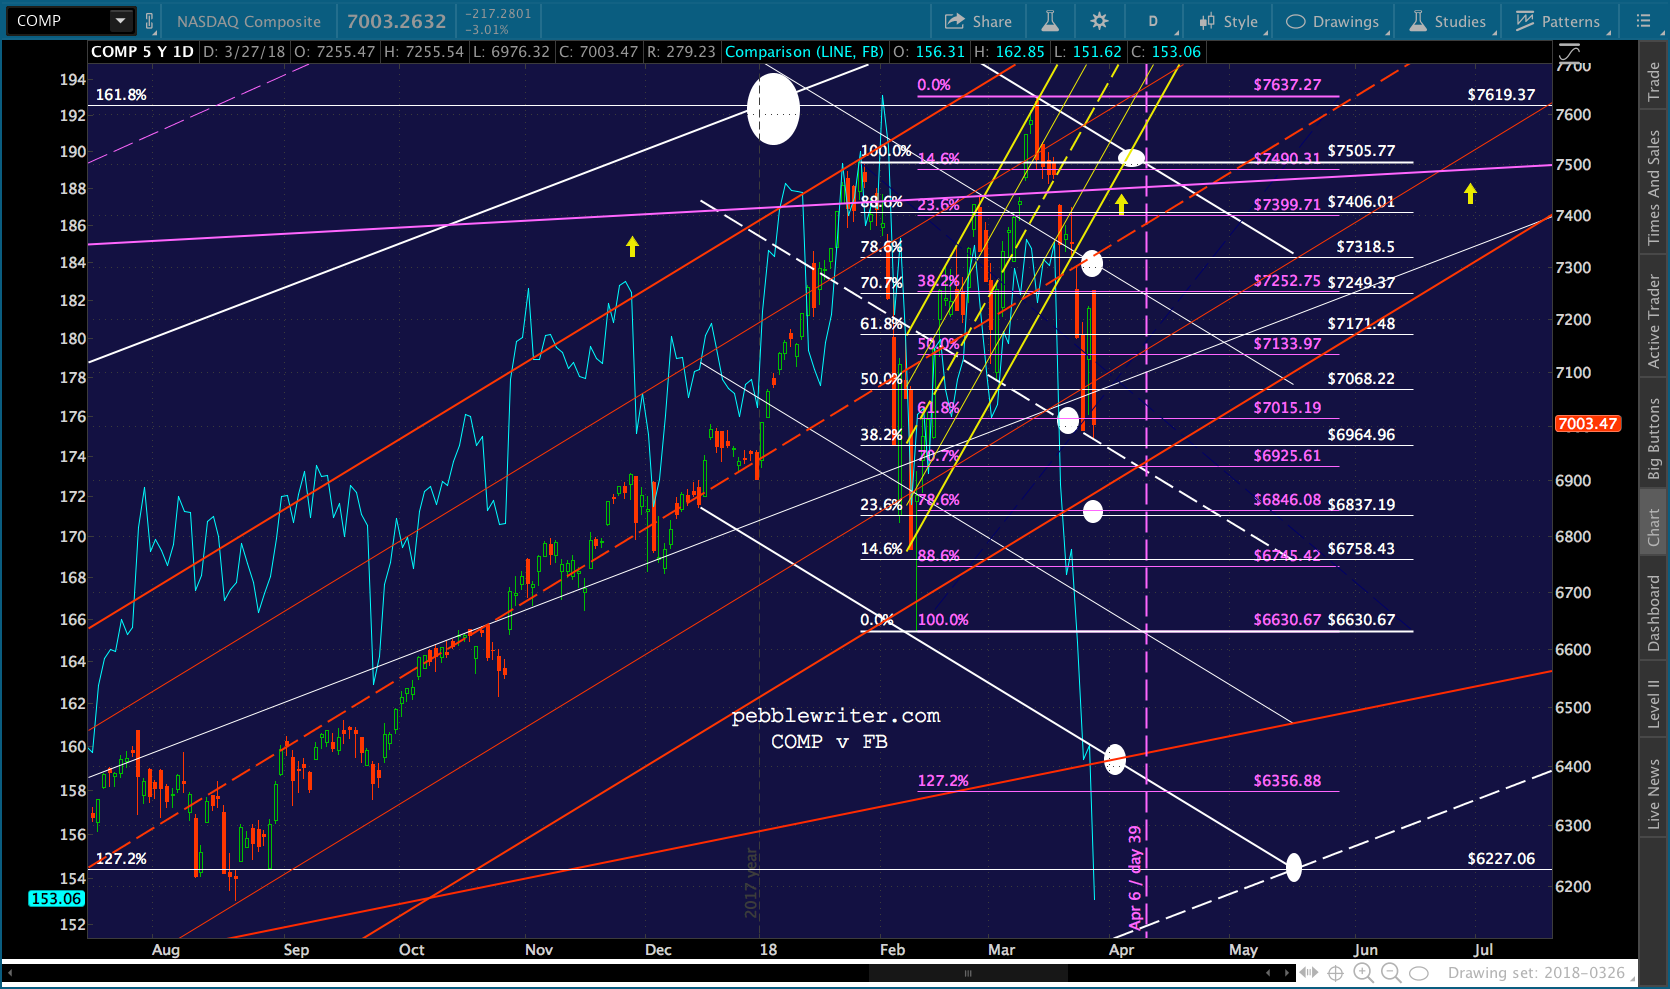
The divergence between FB and COMP is getting a little ridiculous. COMP found support at its midline, as expected…
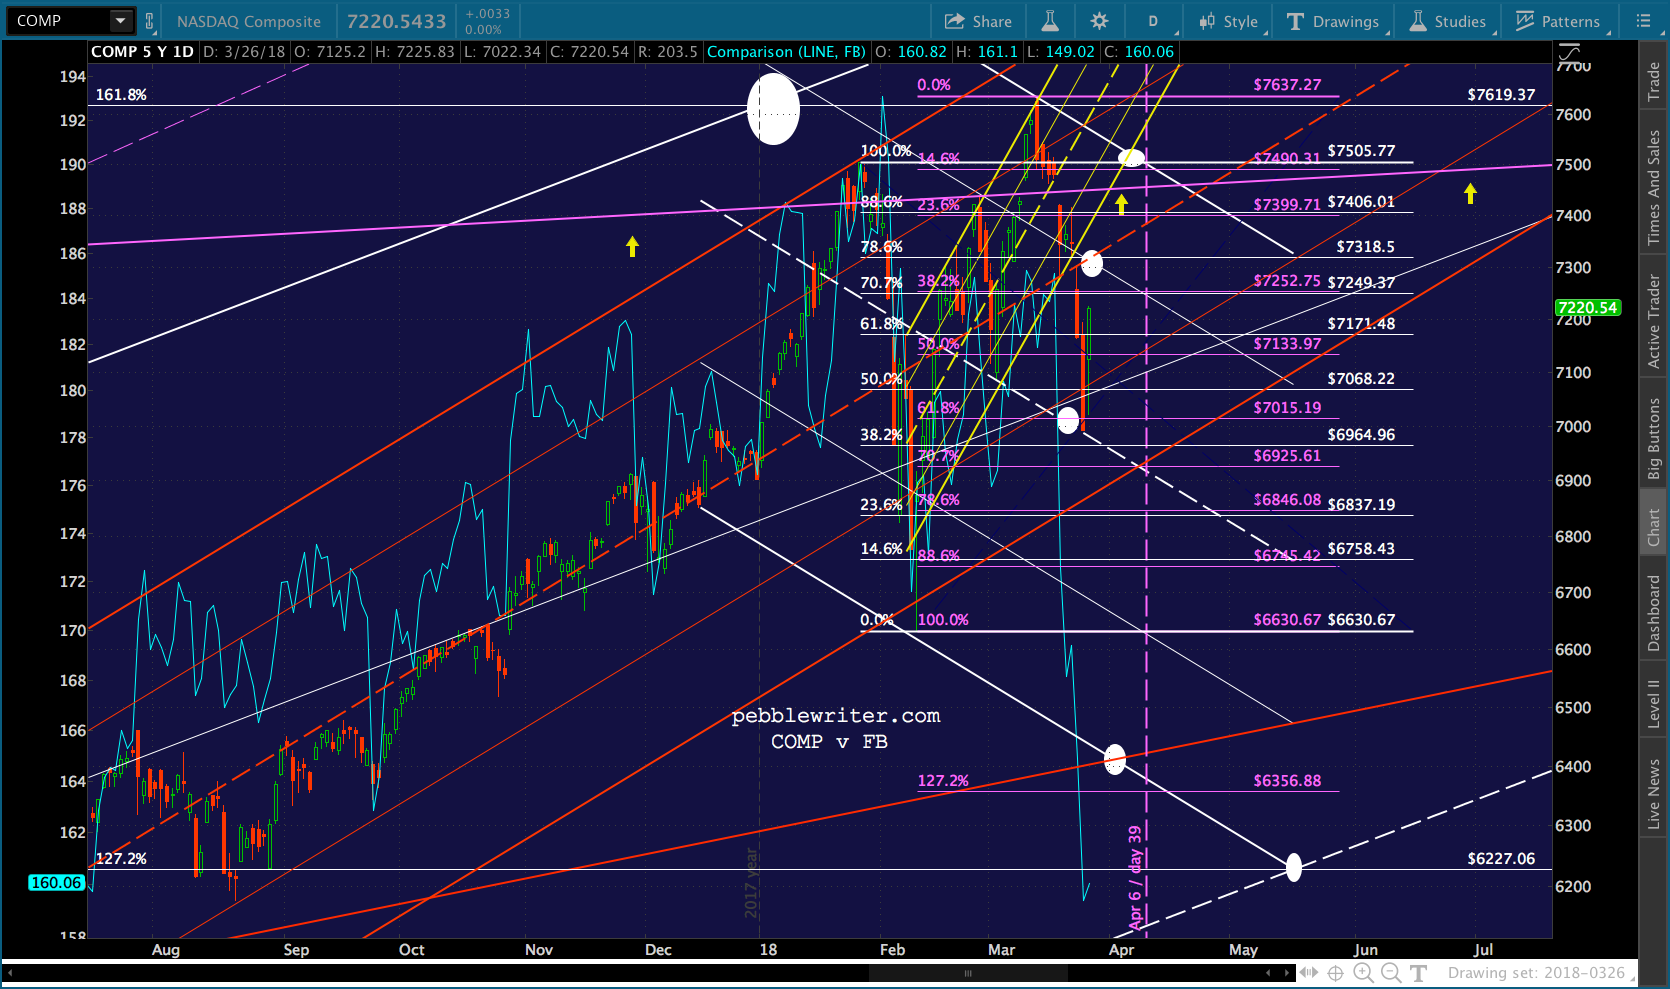 …but, FB is having major difficulties in doing anything bullish looking.
 DXY is getting a nice boost today, compliments of JPY…
 …and, to some extent, EUR.
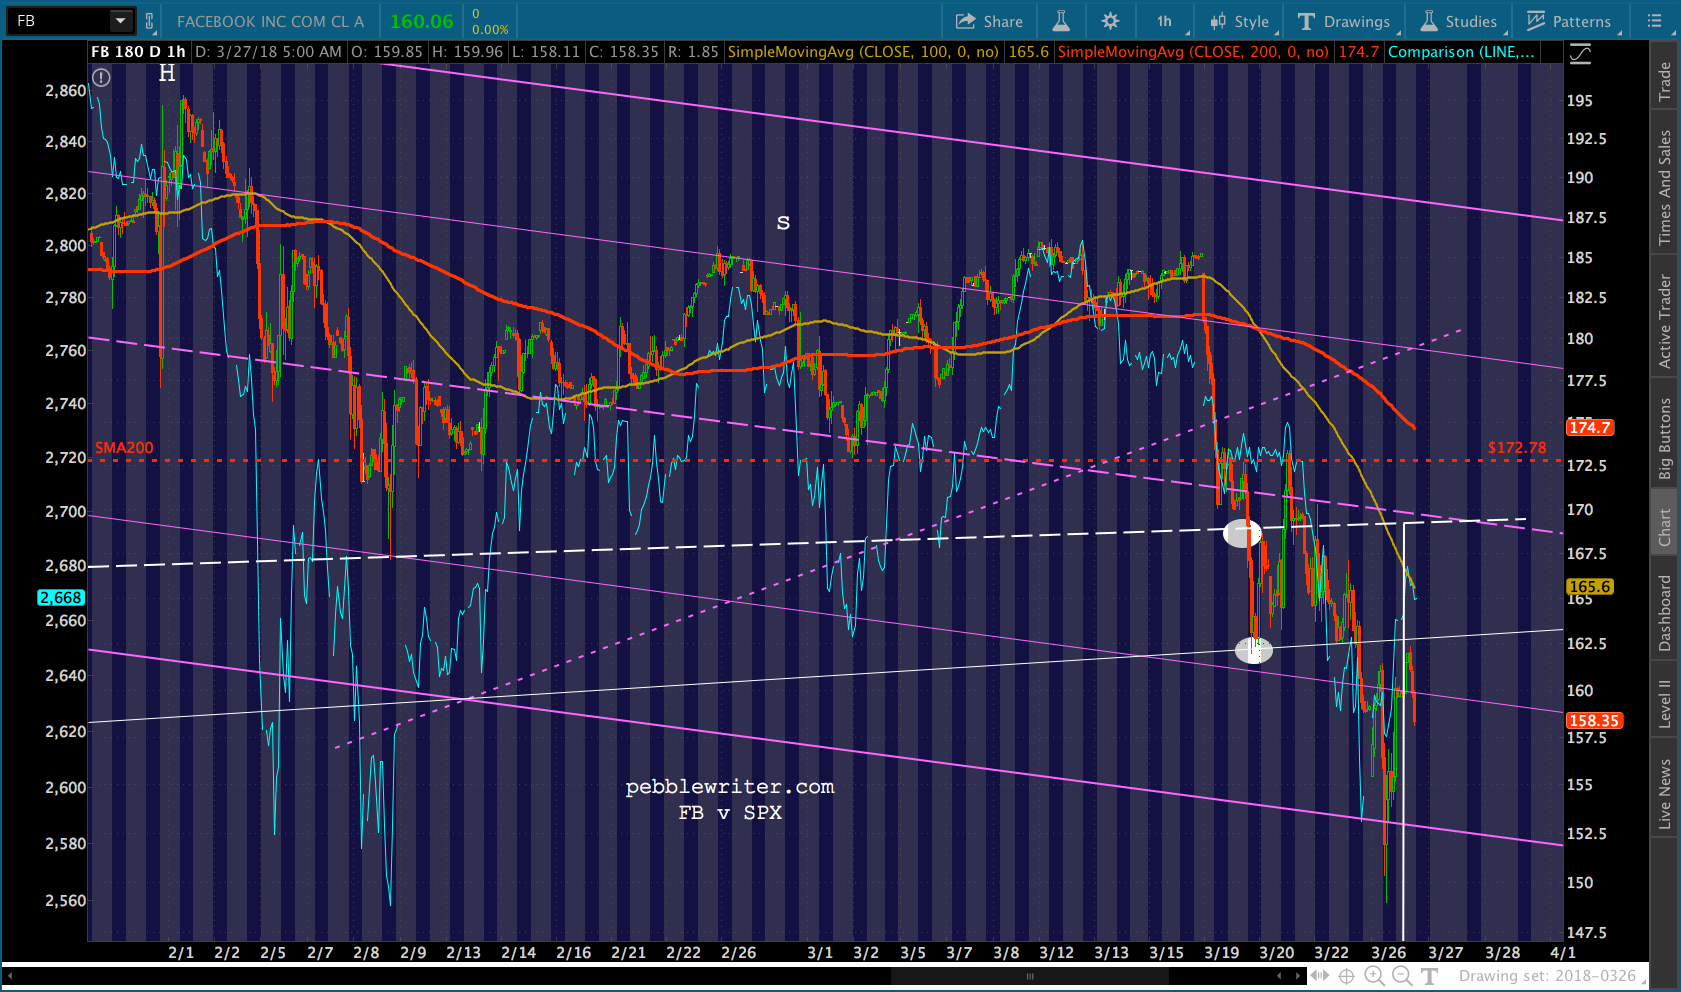
 As a result, GC which tagged its 1362 resistance yet again, has retreated once more. As we discussed a few days ago, it has failed at 1362 several times in a row, suggesting a short position. It still has a shot at 1380, but only if/when DXY finally breaks down.
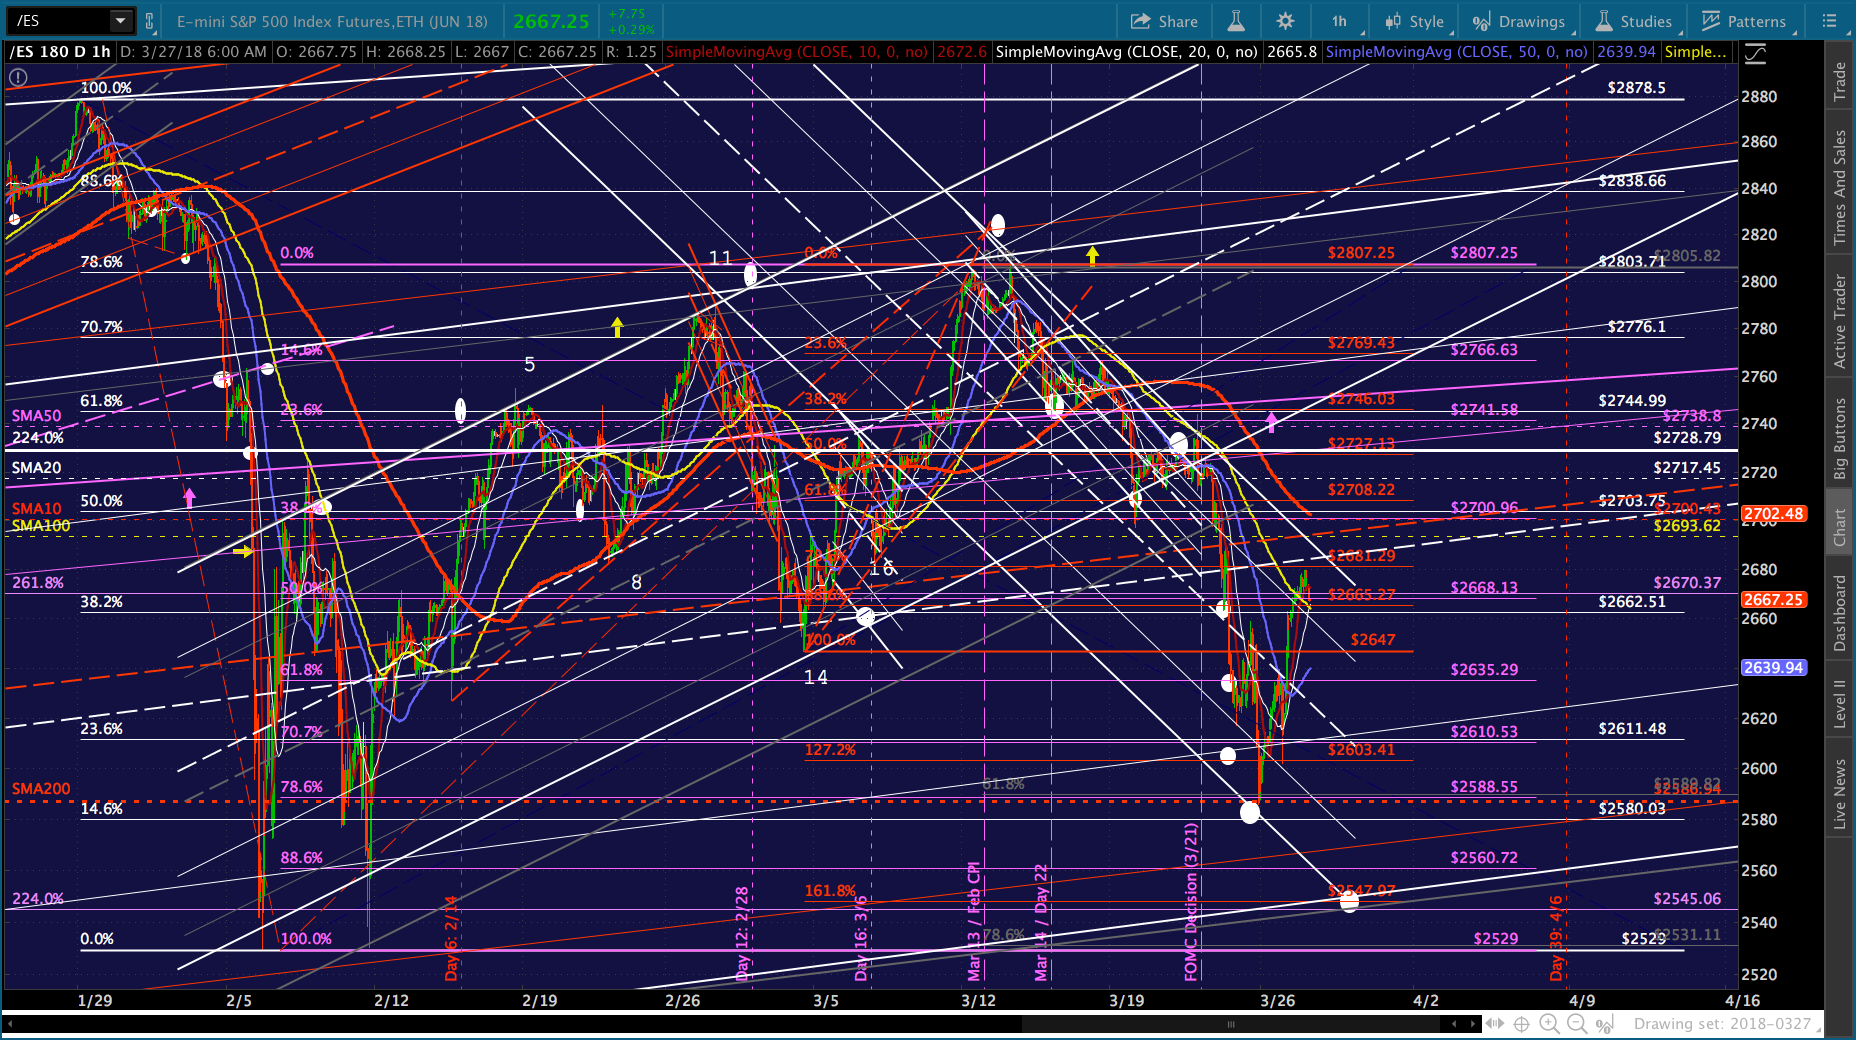
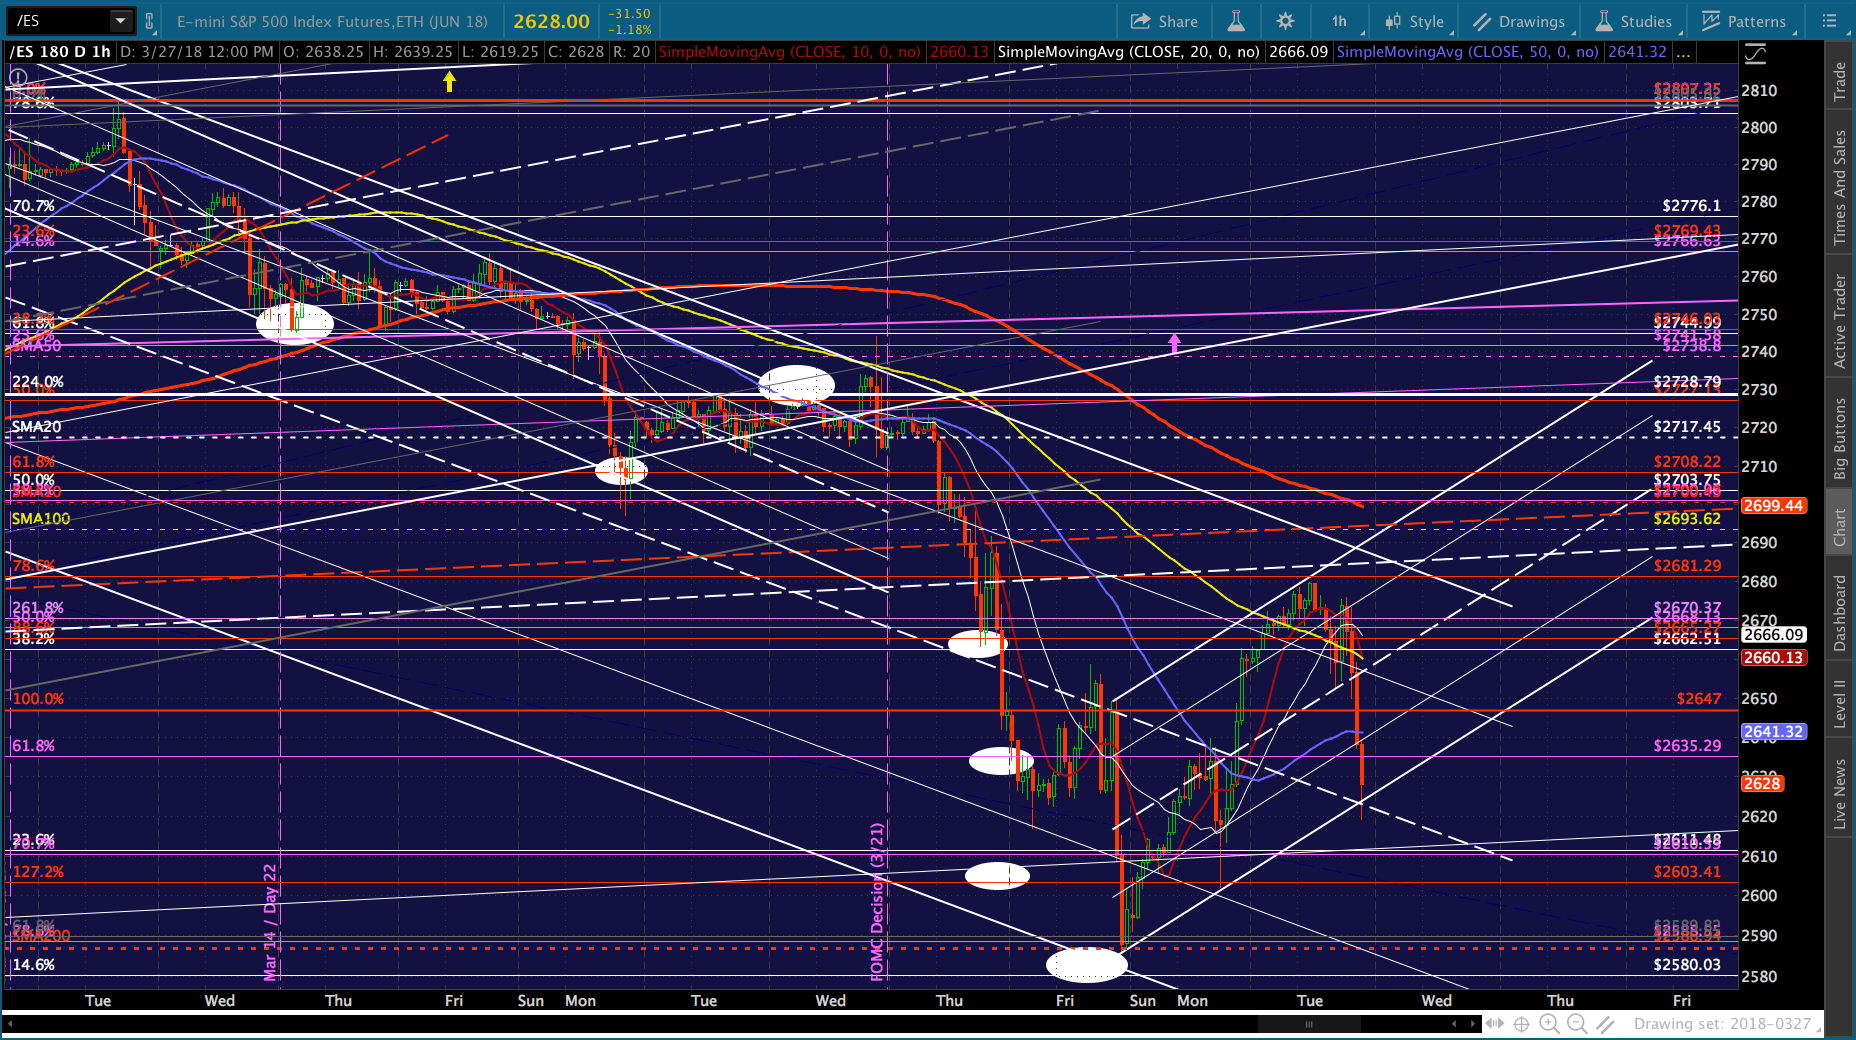
 Meanwhile, I’m still interested in seeing what happens when ES and SPX reach their channel midlines For ES, this was almost reached earlier this morning, but would look better at 2693-2701.
 And, for SPX, the key is the midline and 2.24 at 2703ish.
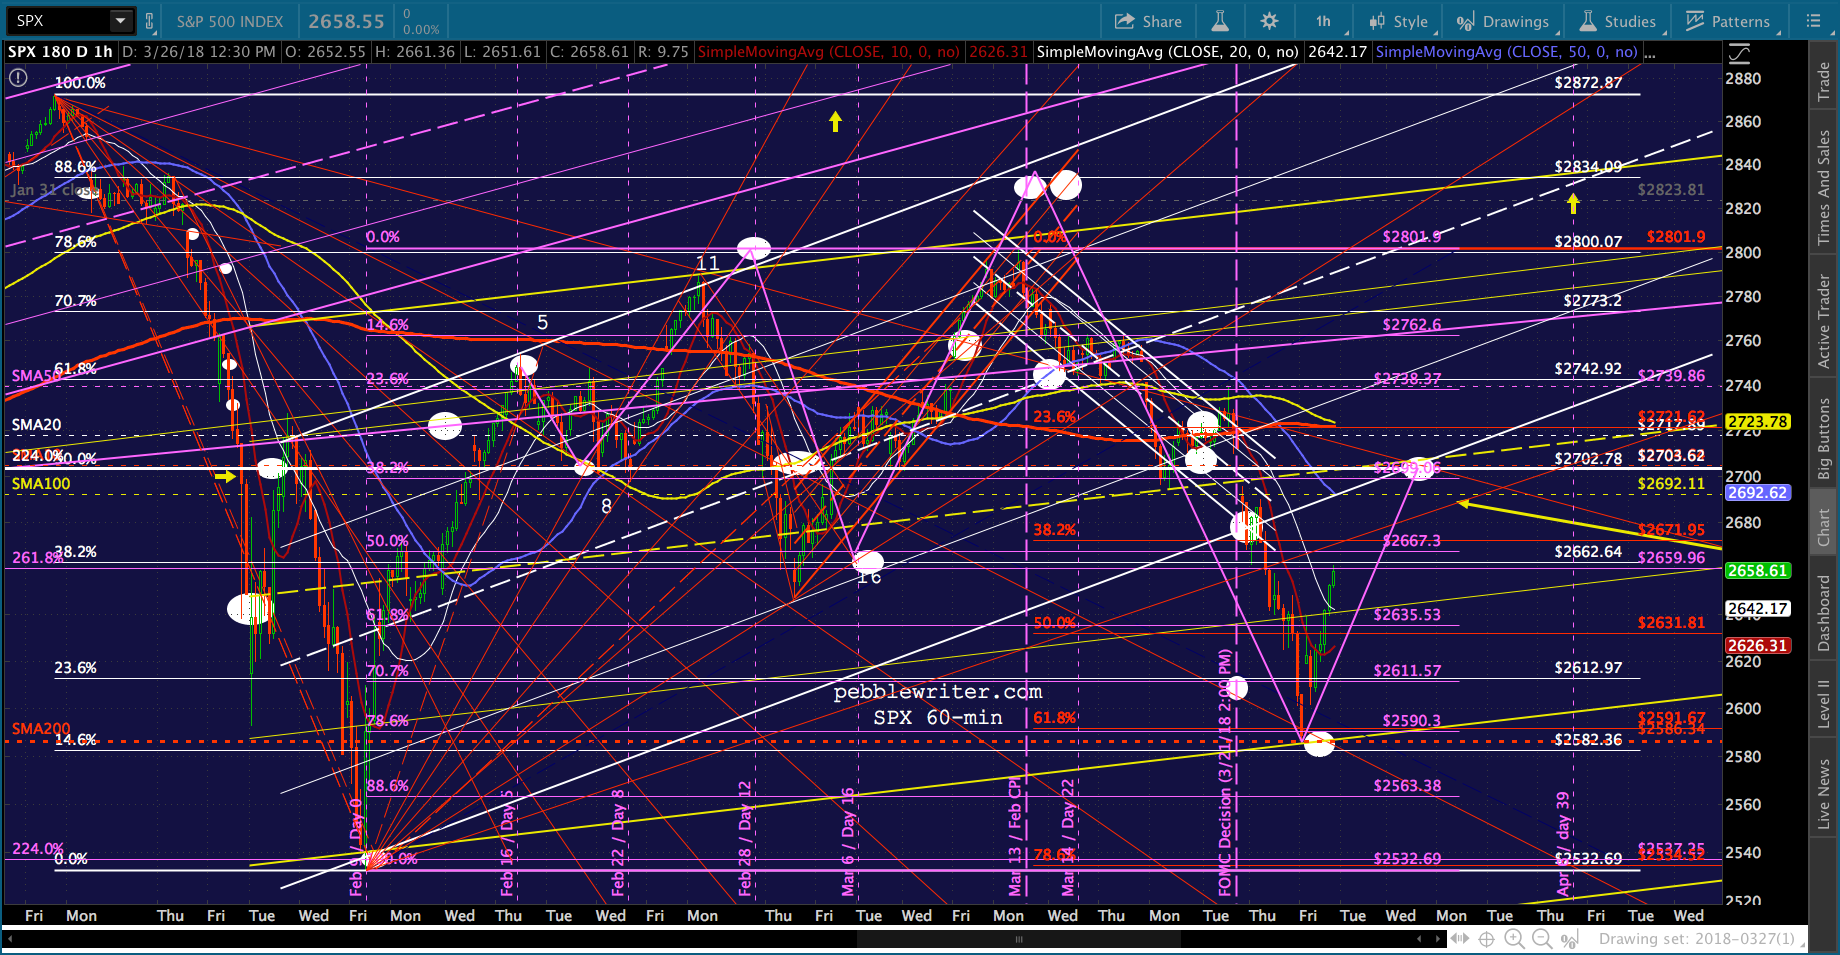 There is a quick, easy path there. But, I don’t see it continuing this quickly if it backtests the SMA5 200 first. And, it may not get there at all unless FB, TNX/DXY and VIX keep up the support.
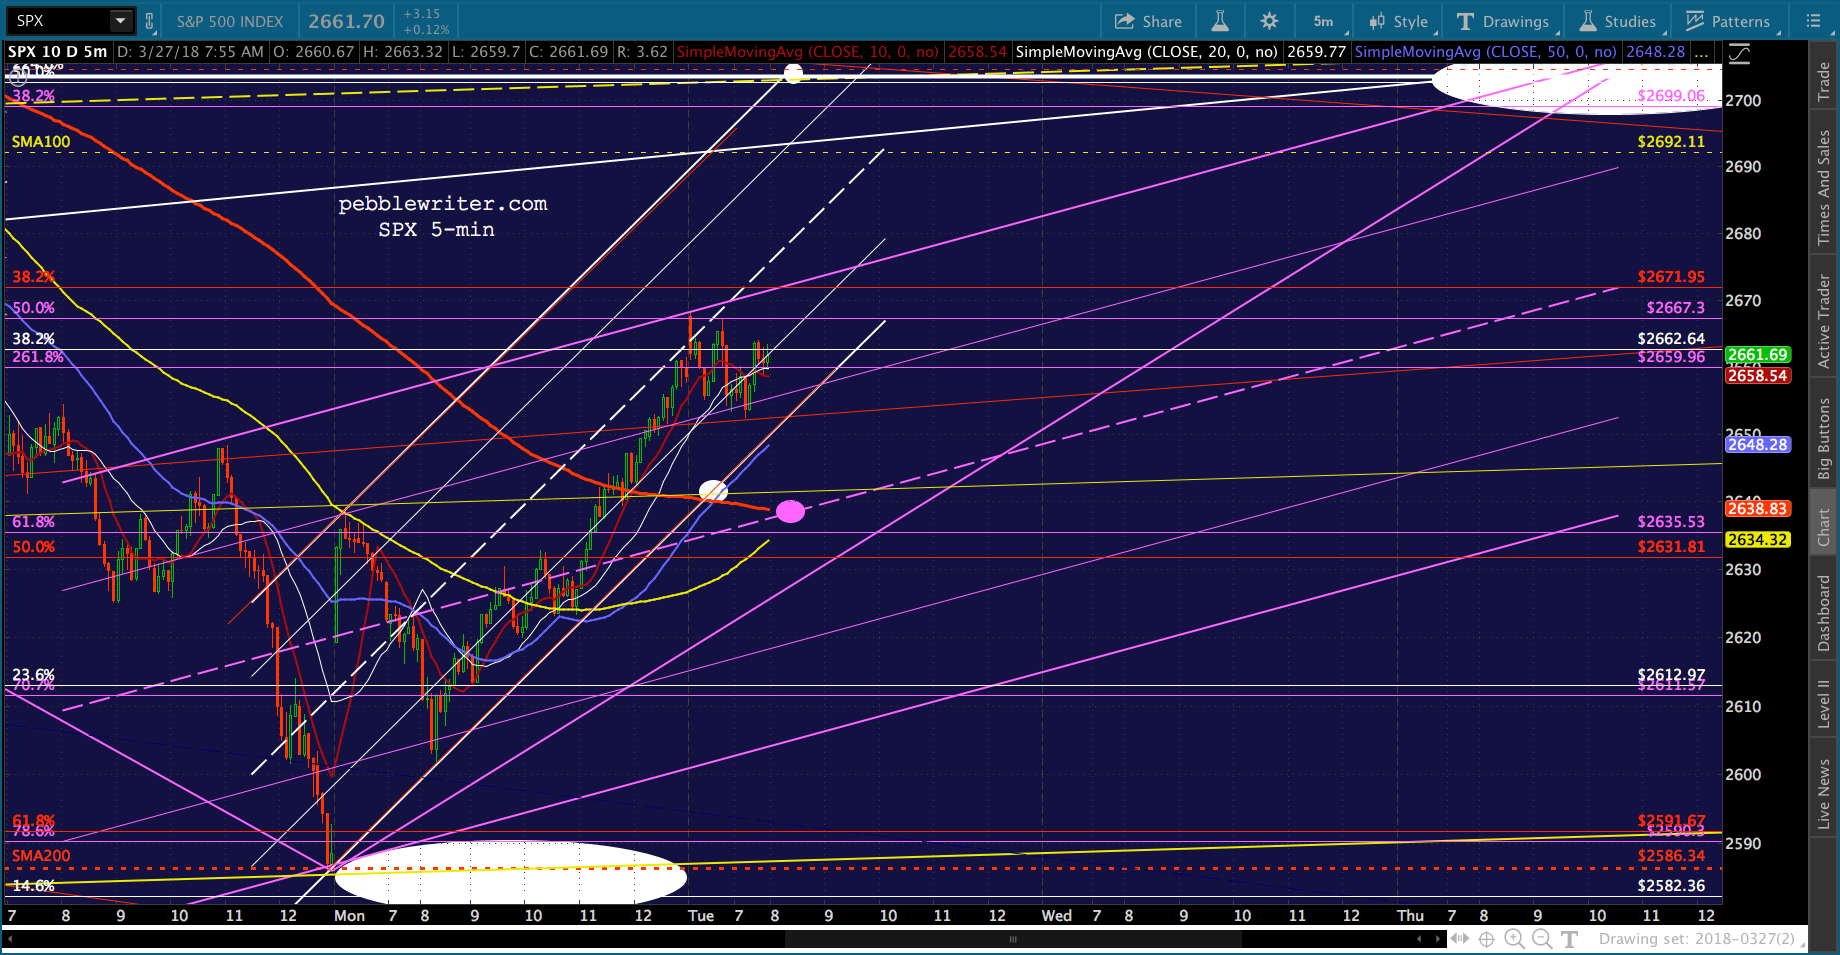
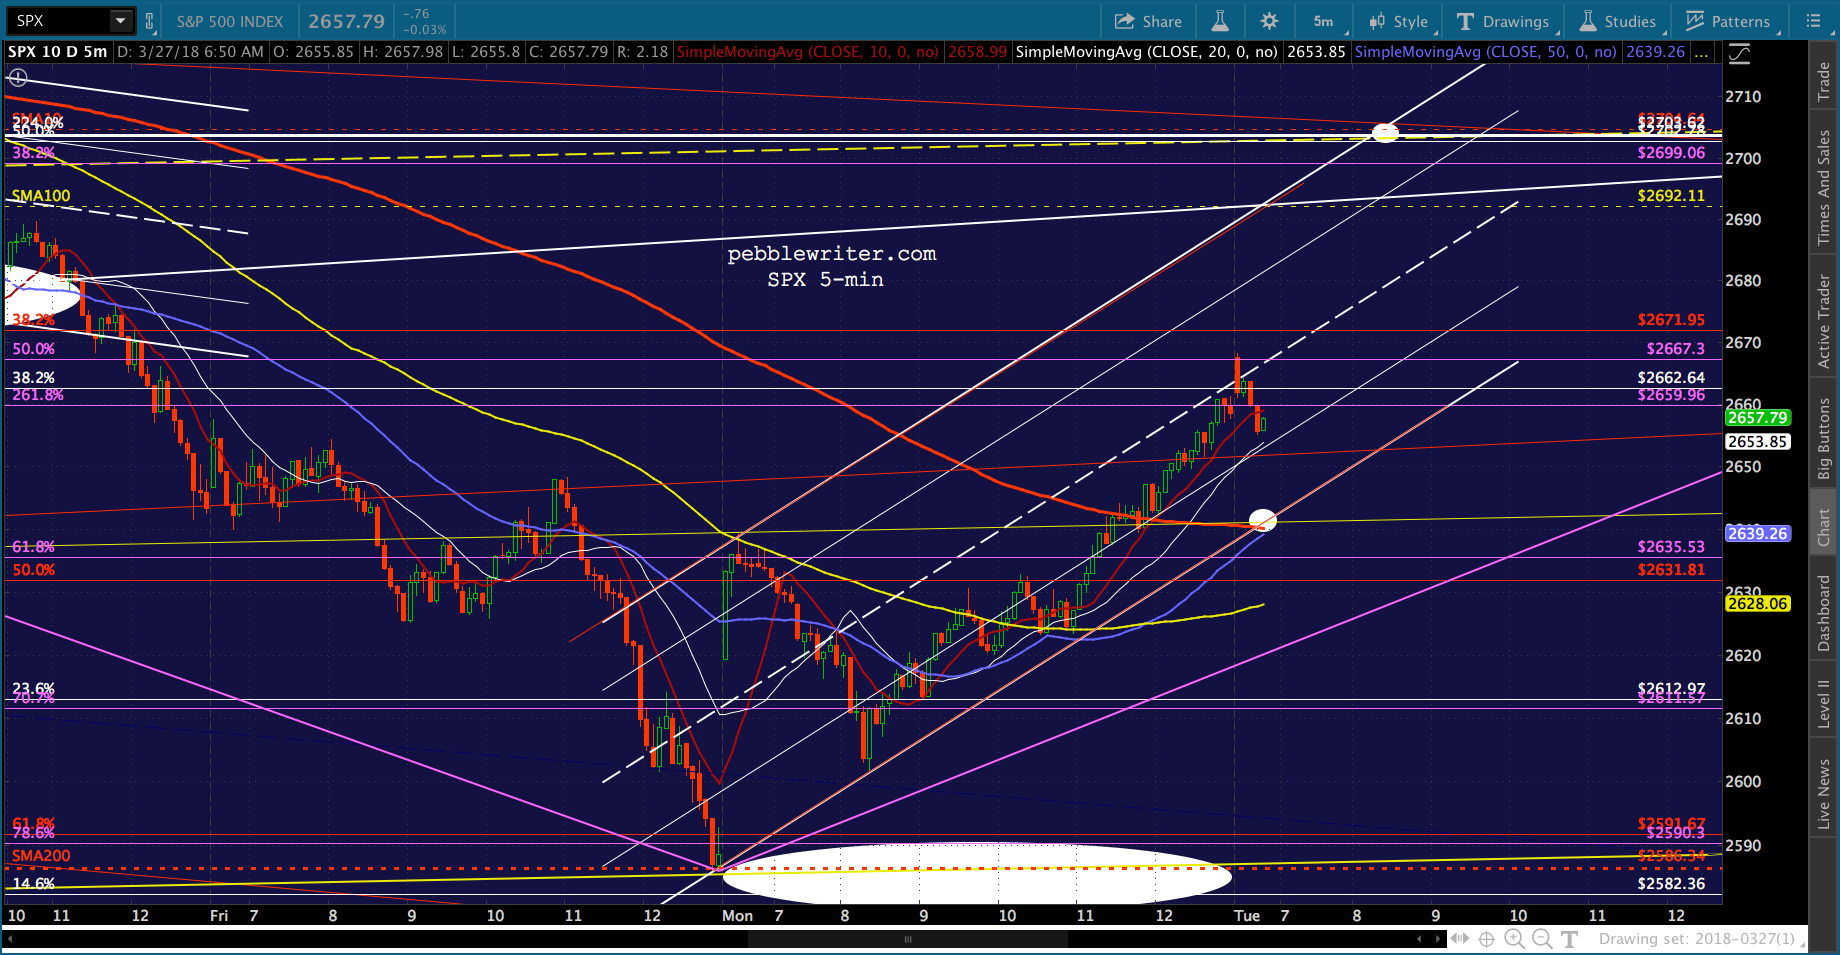 The more likely path to 2703 would be on Thursday via the purple channel shown below.
 I have been working on a model for CL and RB price targets utilizing CPI data. I’m going to take a few hours and puzzle it out. I’ll check back in toward the close.
UPDATE: 1:40 PM
Delayed in order to avoid a Wave 4 / Wave 1 cross? It needs to stay above 2639.13, which the SMA5 200 is currently above.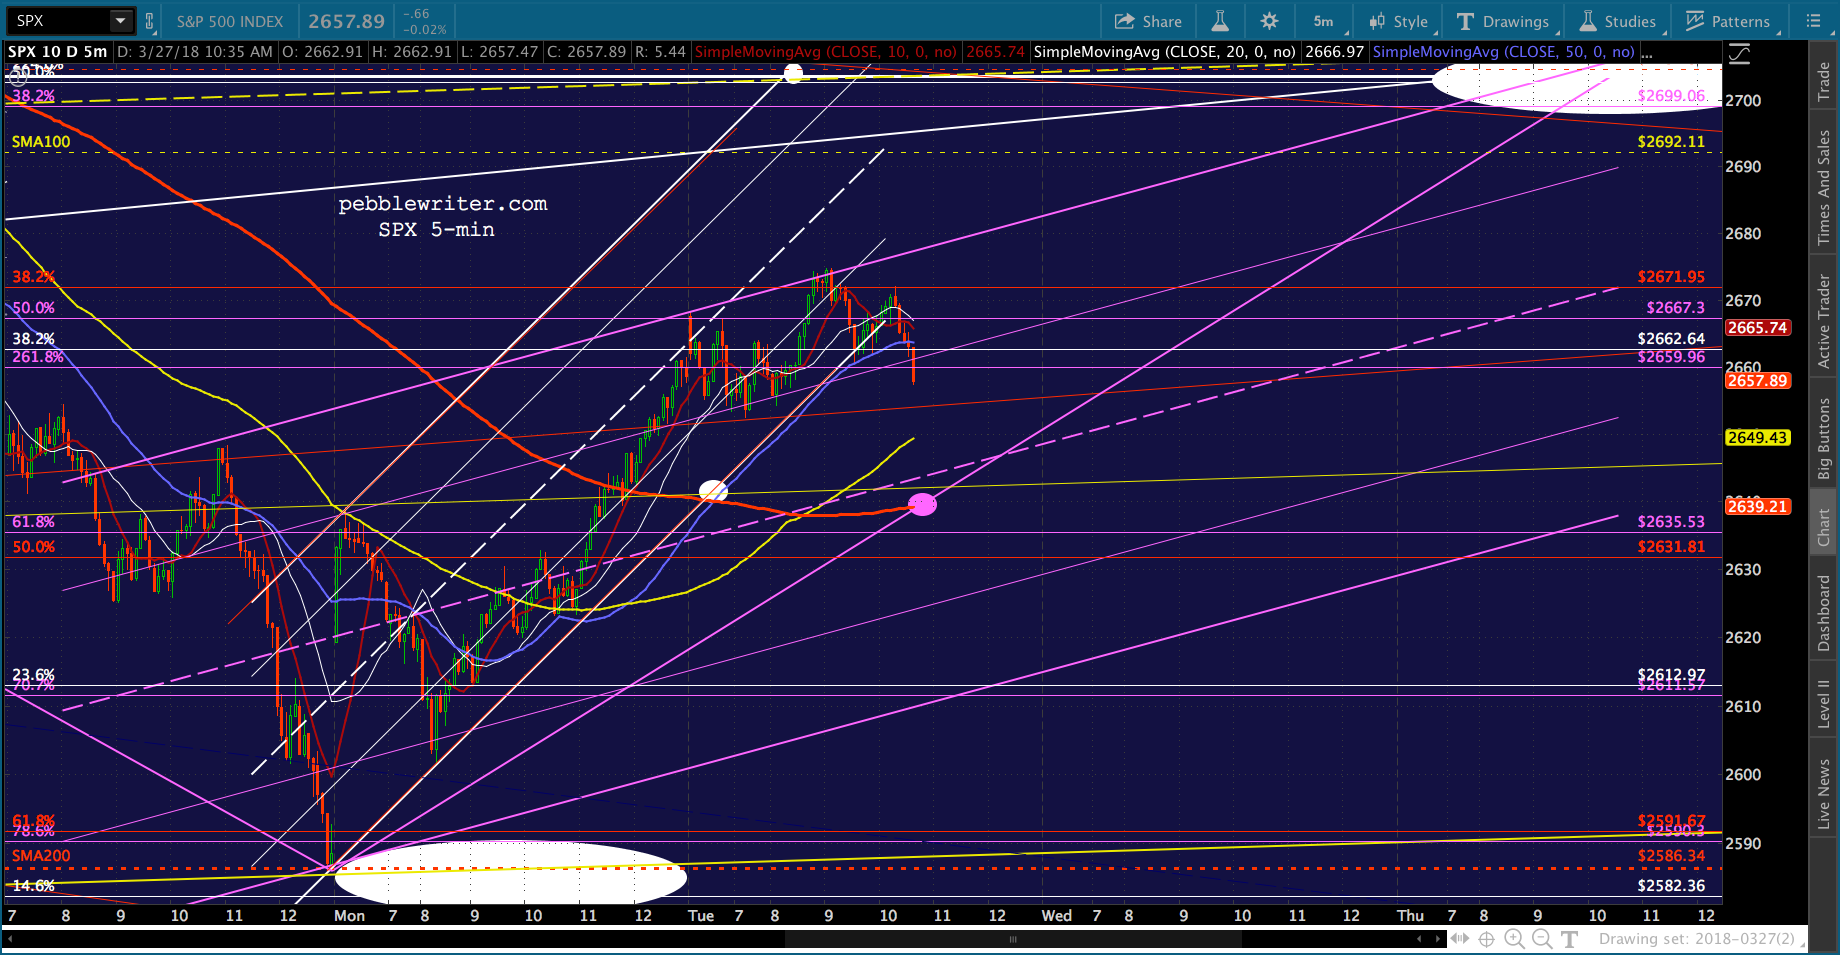 UPDATE: 2:28 PM
TSLA is having a rough go, today. A drop through horizontal support (previous resistance) spells trouble unless it rebounds quickly. Keep a close eye on it as SPX closes in on its Wave 1 highs of 2639.13. 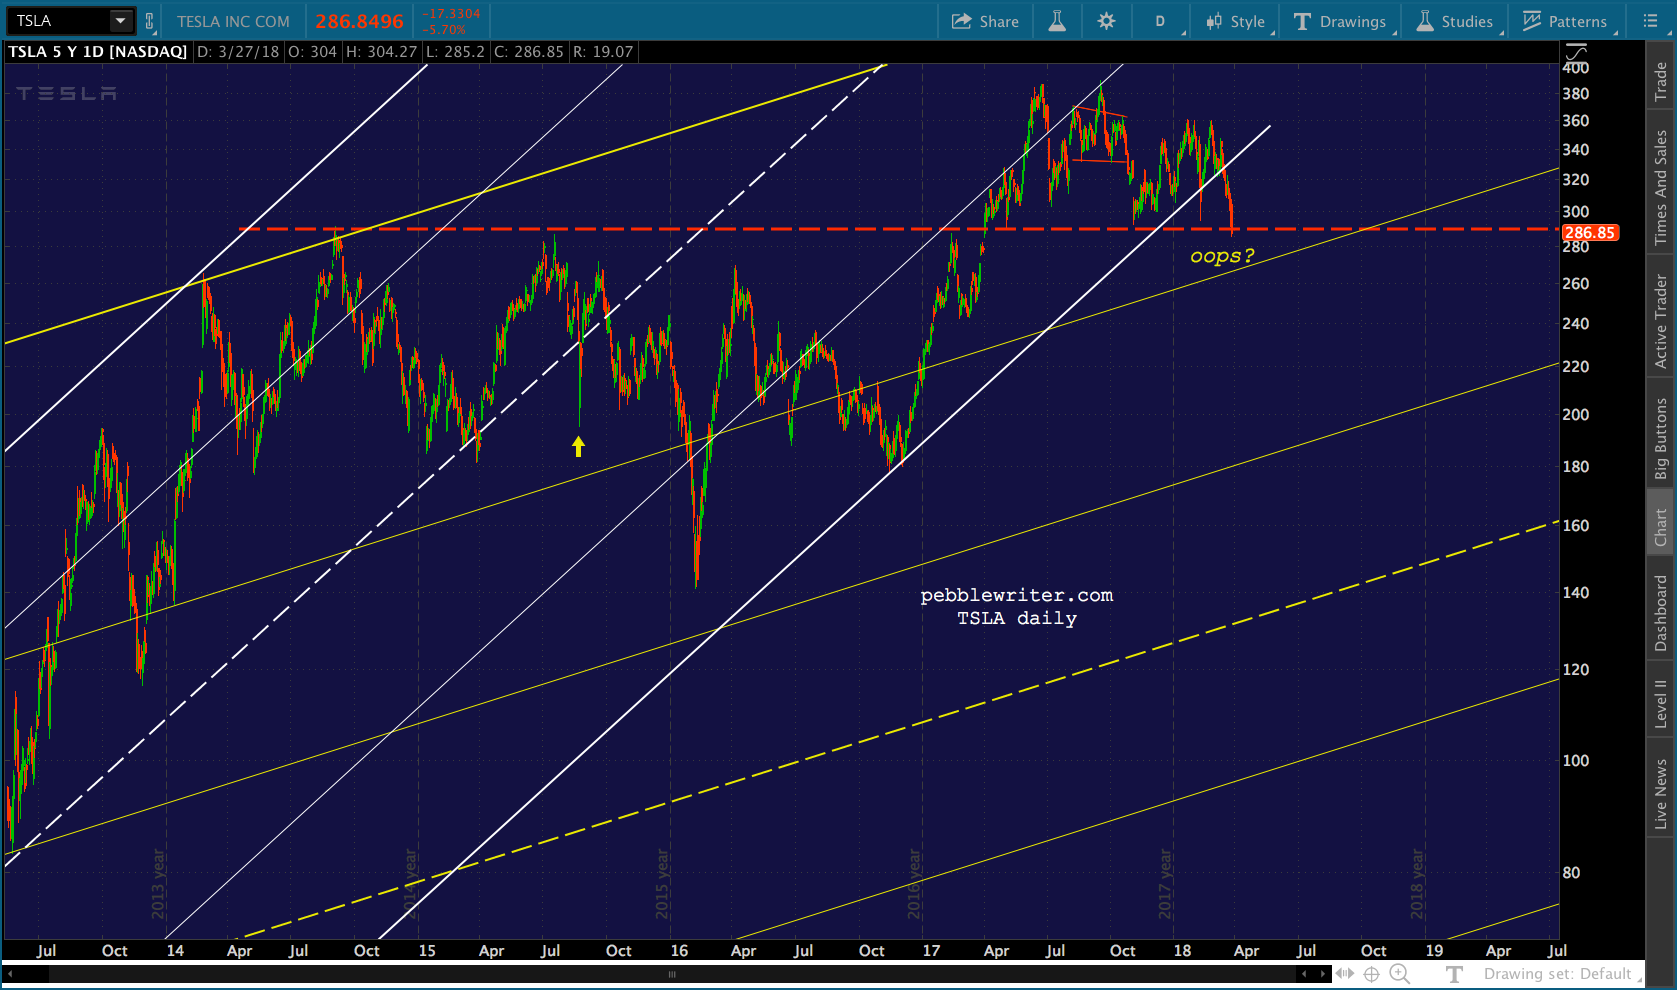 If neither rebounds or SPX rebounds without TSLA, there’s good downside potential. The nearest support is the yellow channel line at 266ish.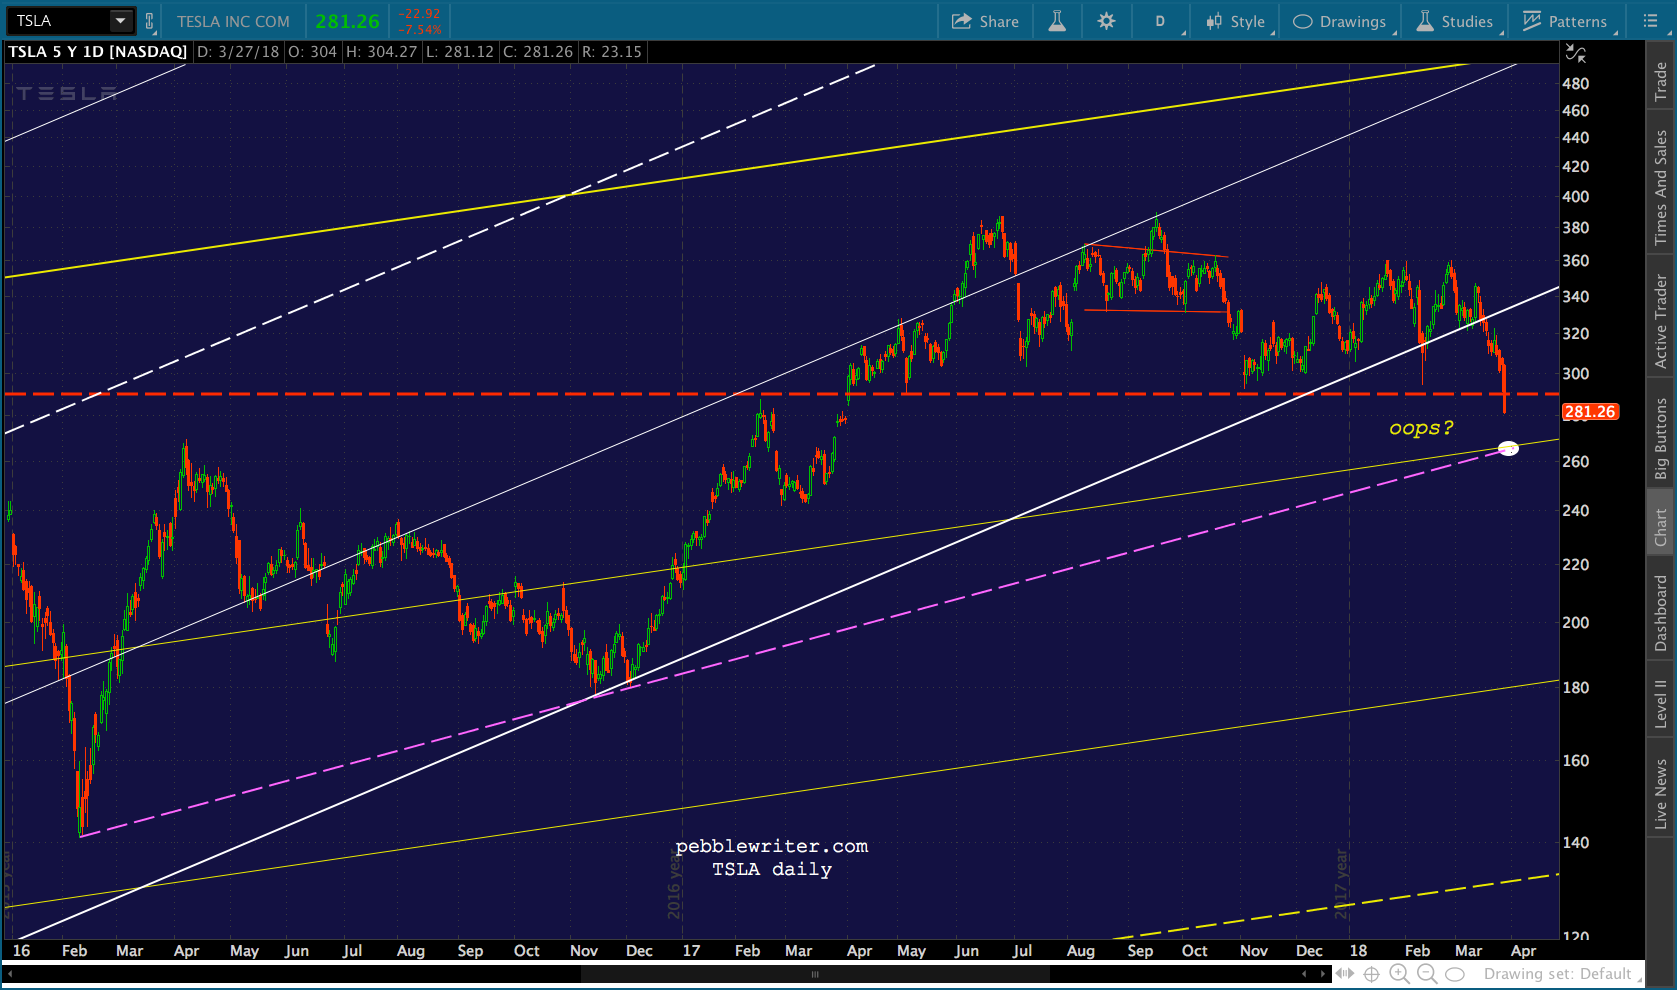
UPDATE: 3:00 PM
Oops…Channel bottom at 2613 in play.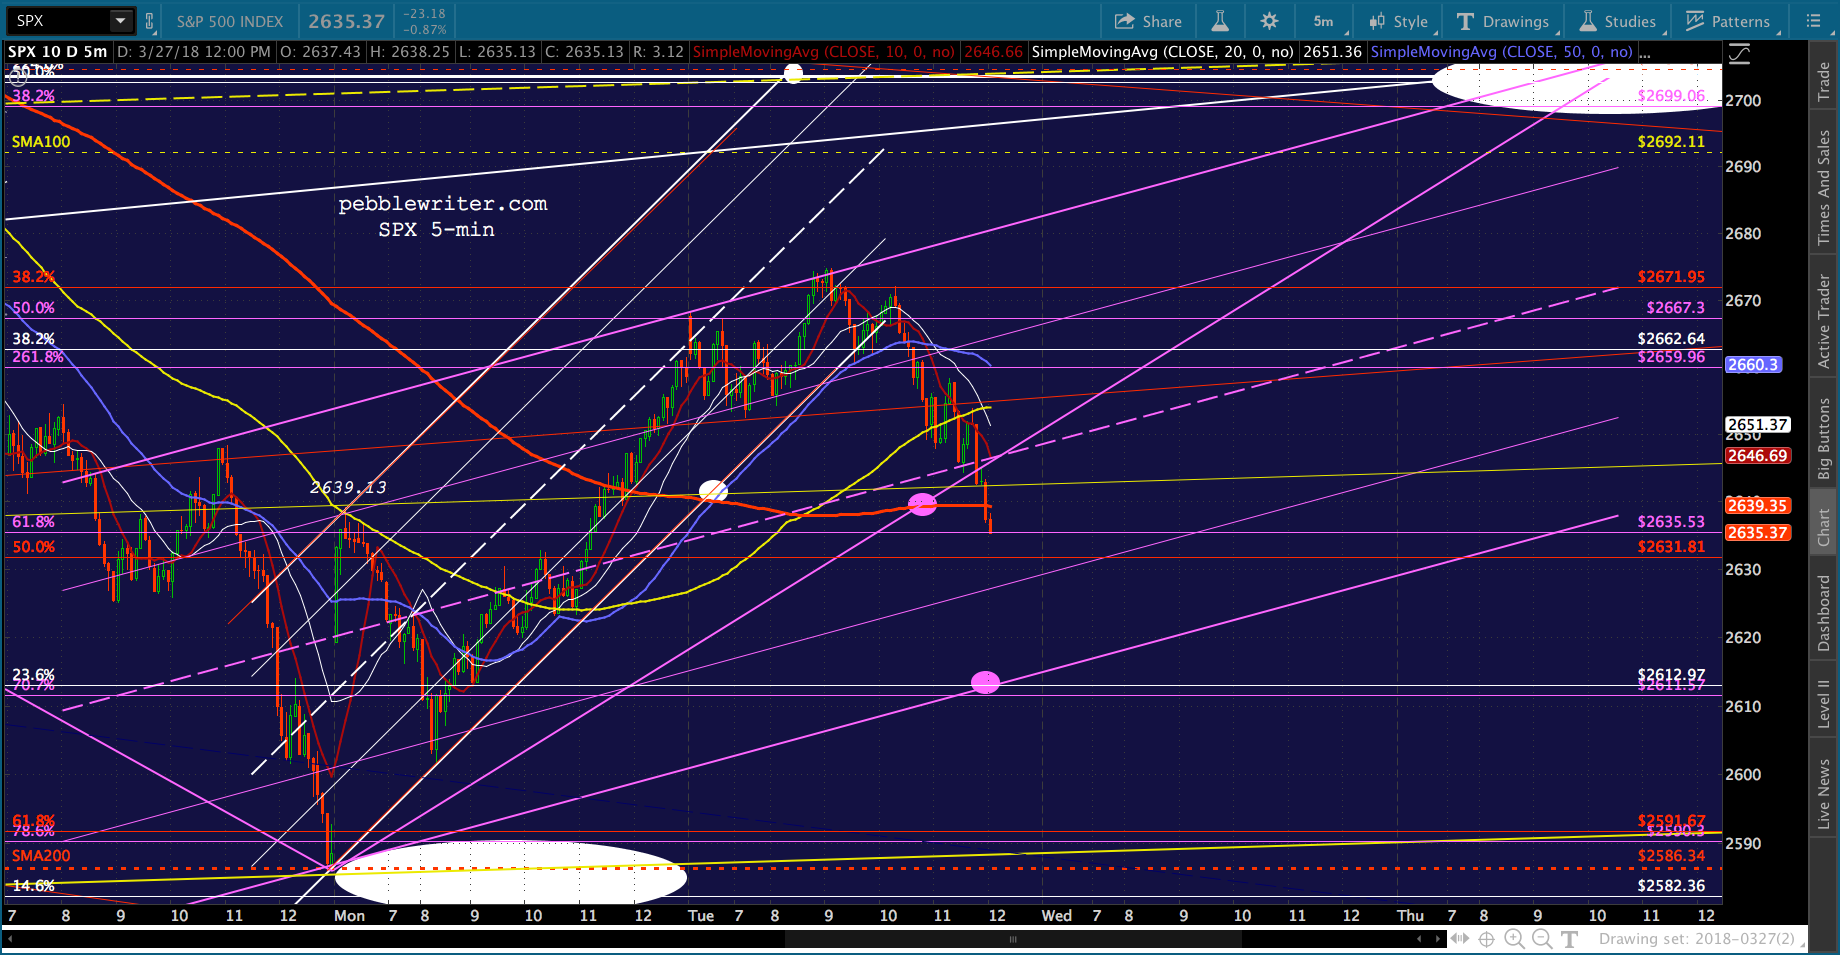 Watch out for the .618, though. A bounce here would facilitate a bounce at ES’ midline.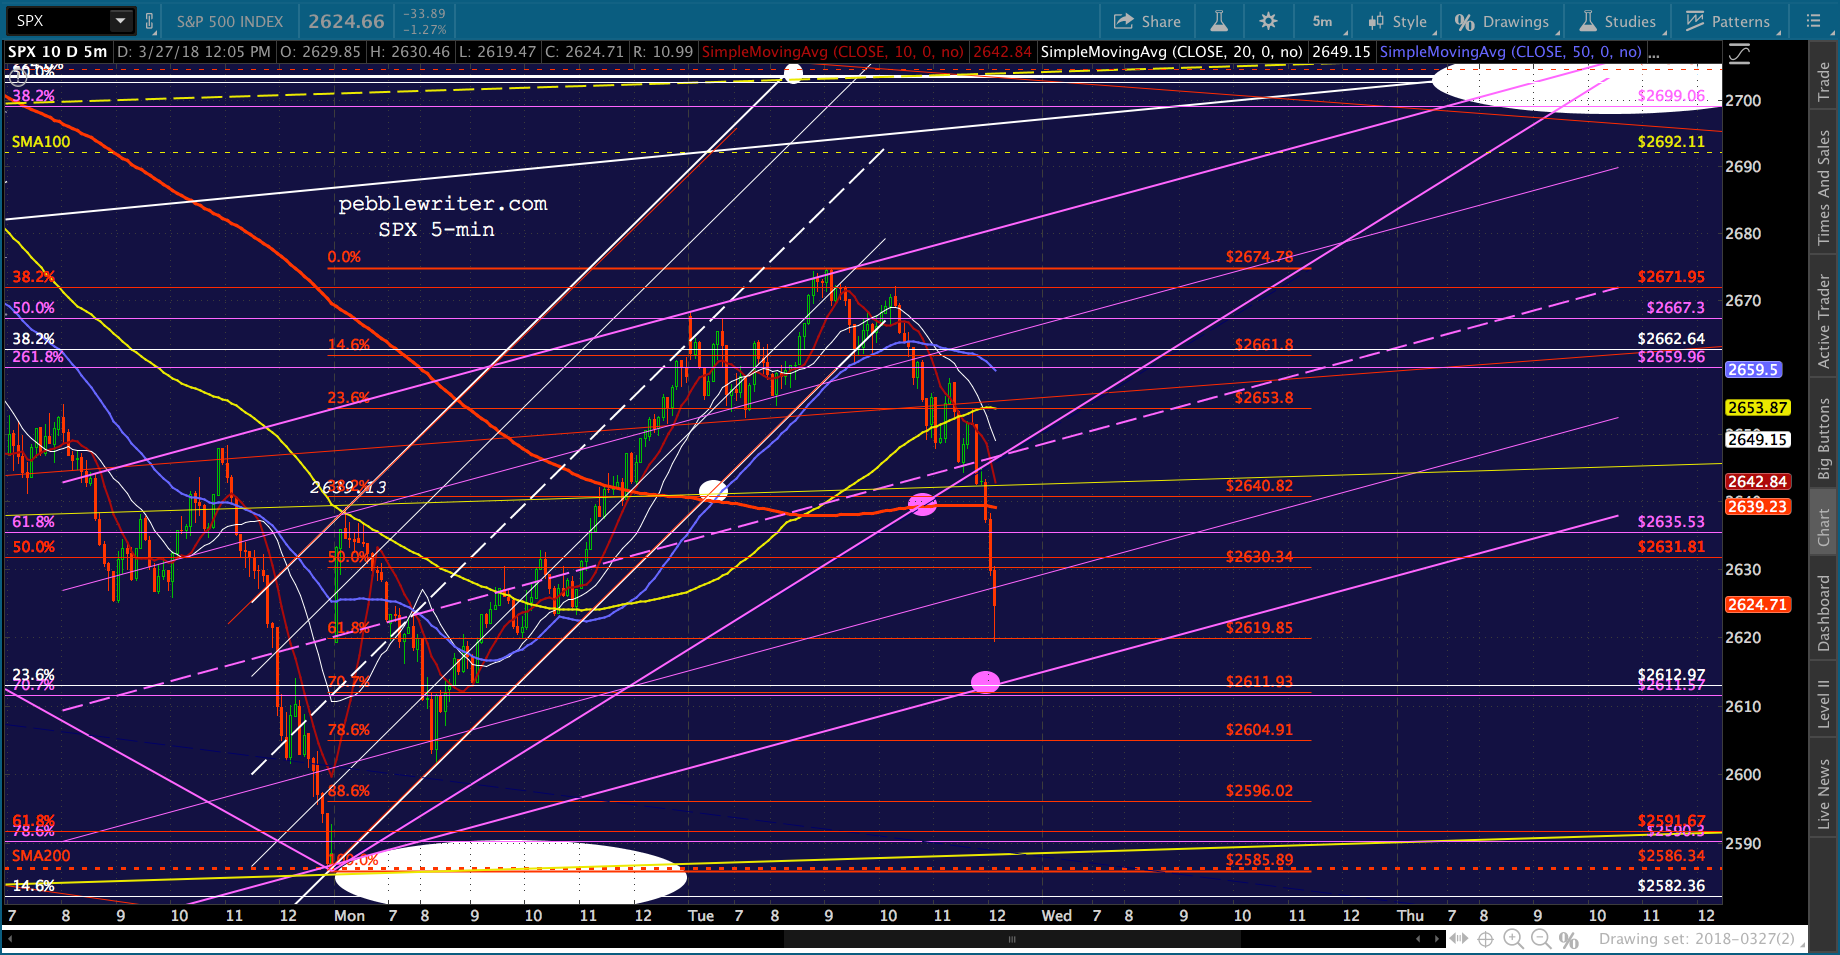
 If it all goes to hell, and SPX drops through the purple channel bottom, the SMA200 is currently at 2587.31; the previous bottom is at 2532.69, and the C=A extension is at 2461.72.
UPDATE: 3:36 PM
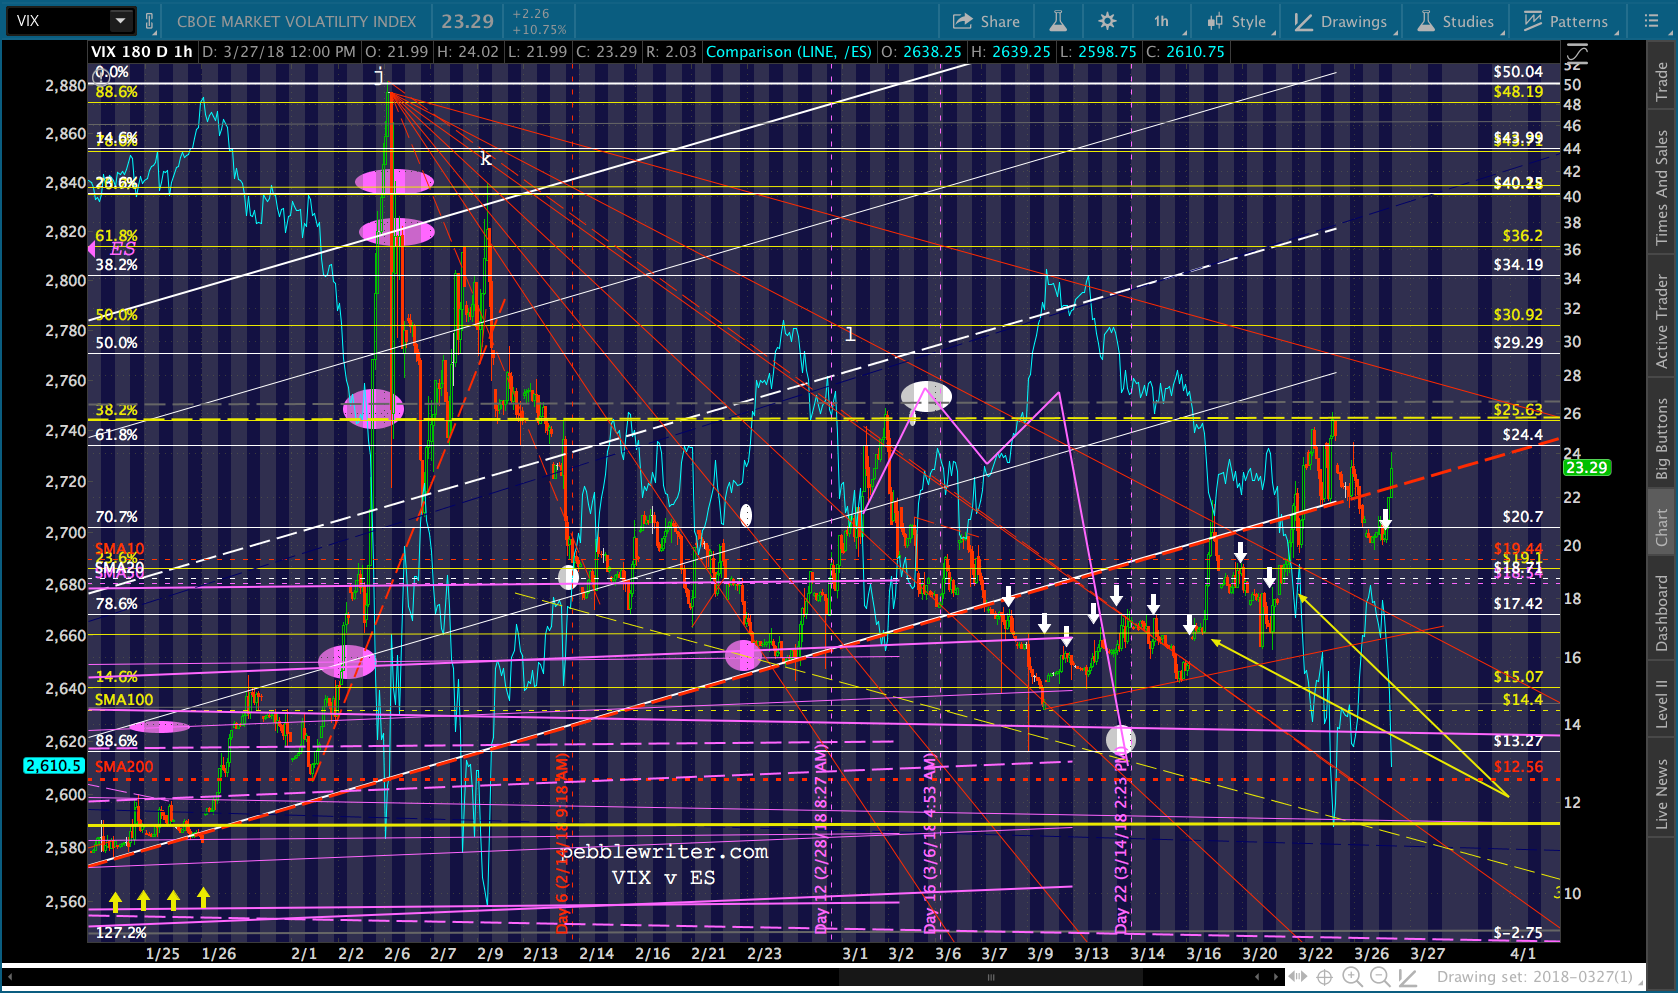
This is where things could get pretty dicey.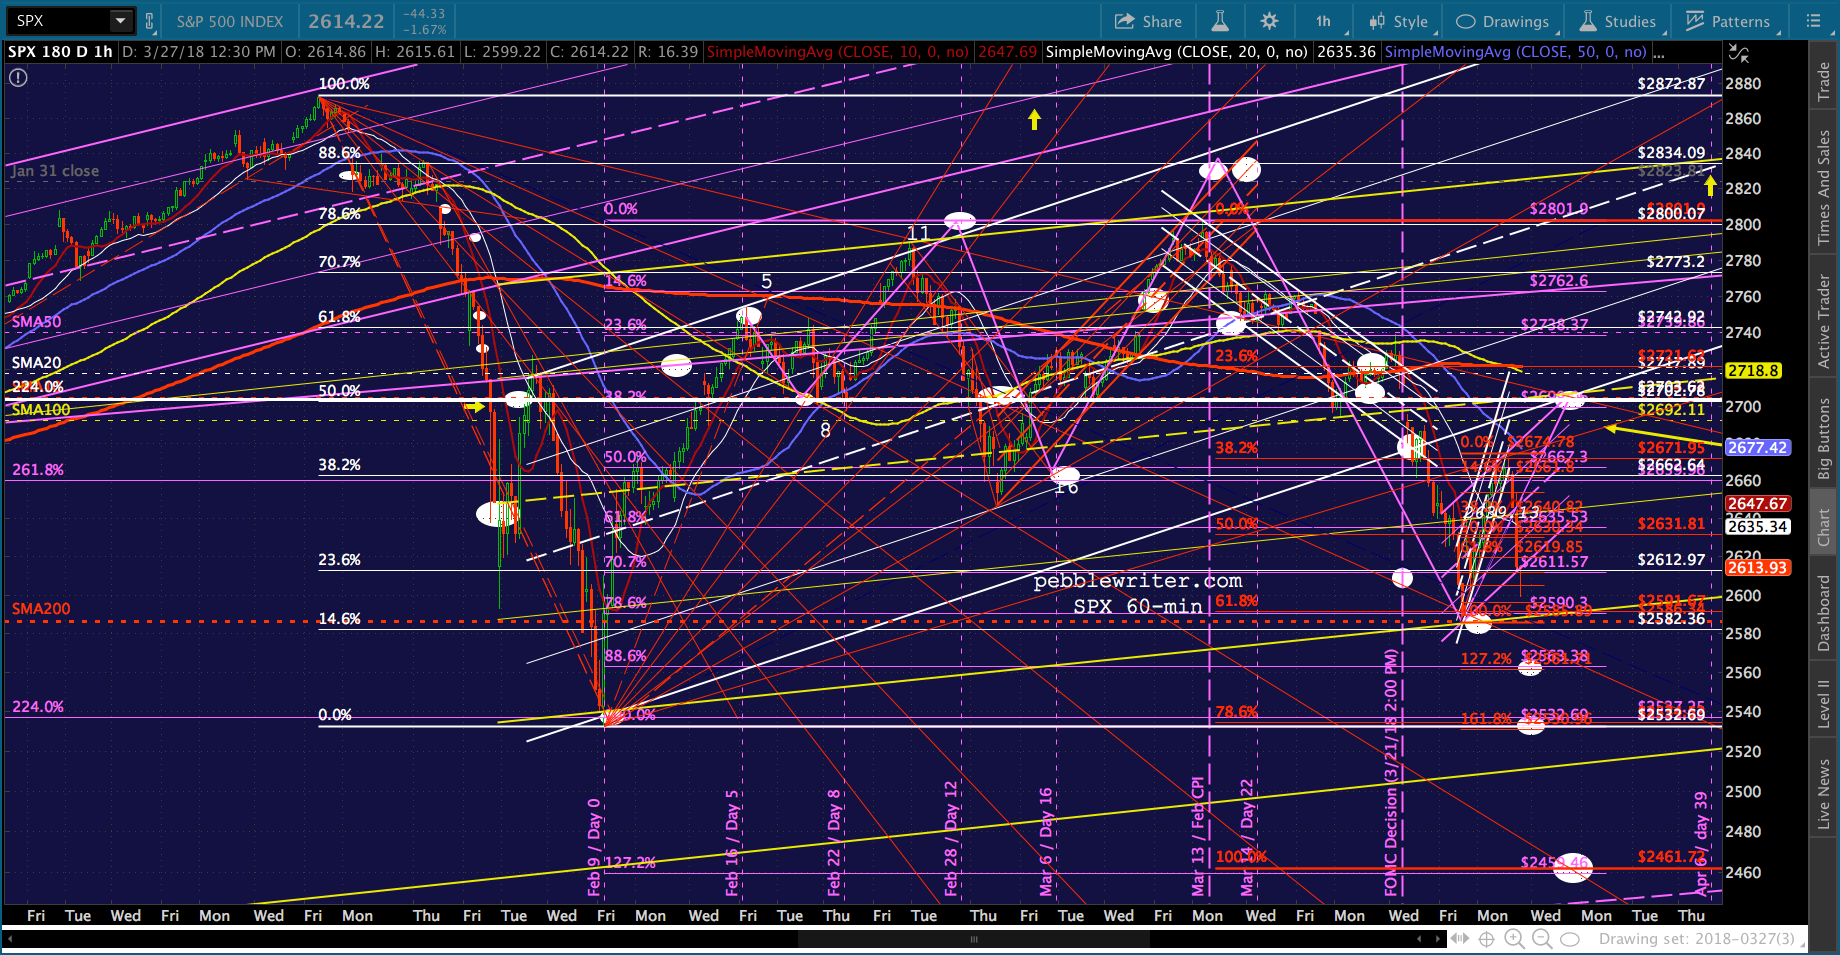 VIX is back above the channel bottom.
 TNX just broke down.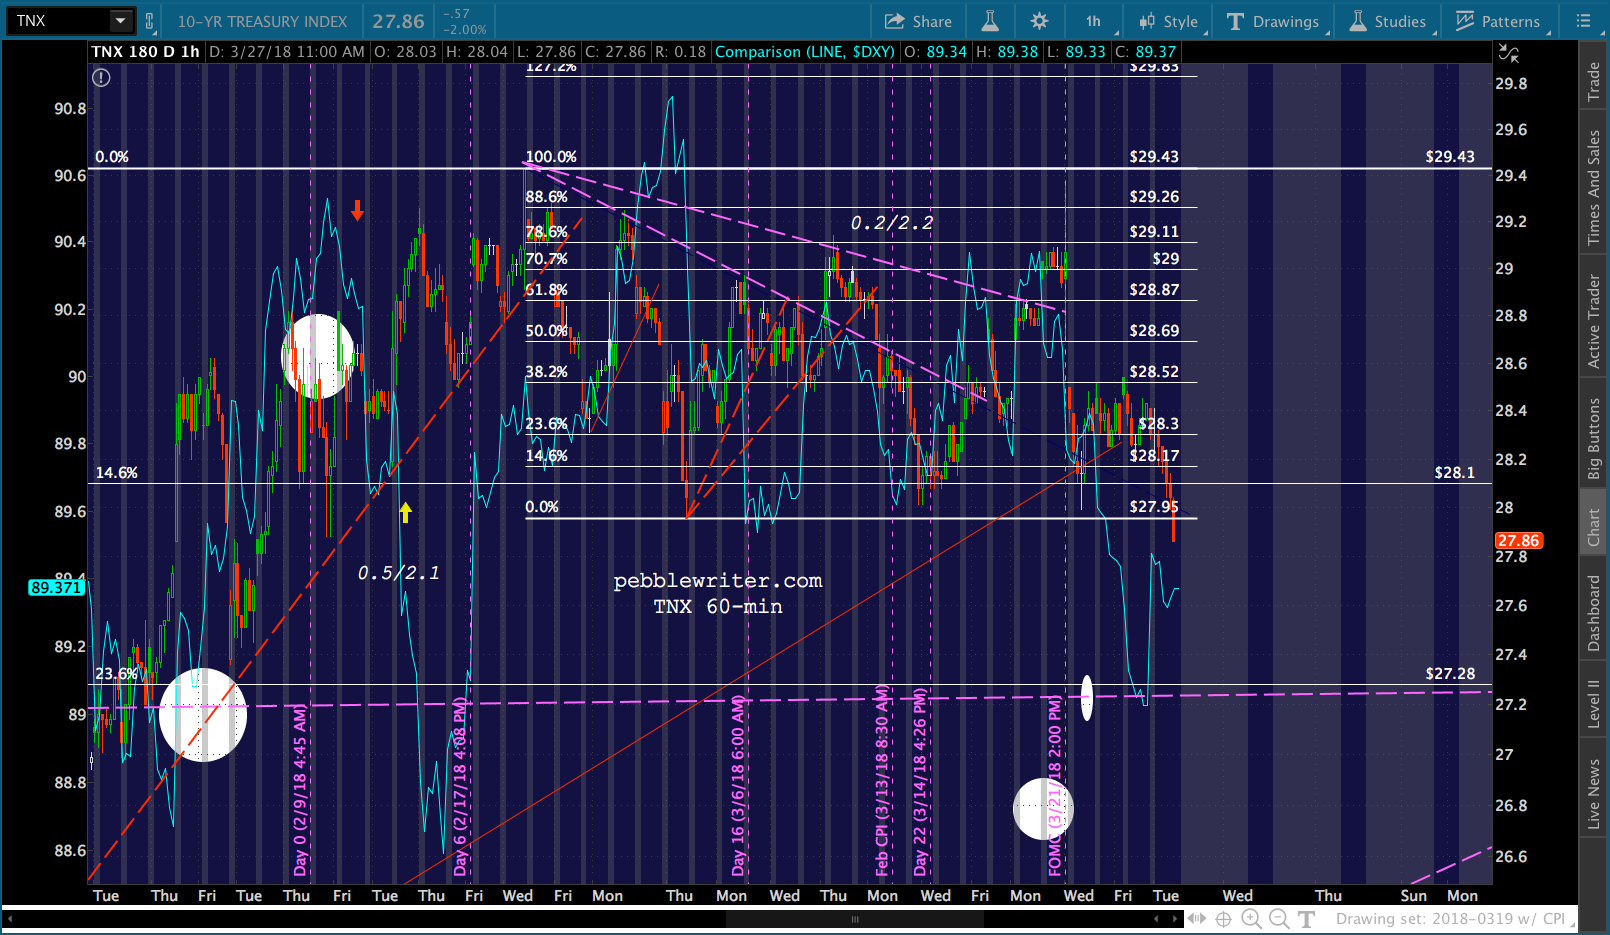
And, COMP has given back all of yesterday’s gains.