Author: pebblewriter

  • All That Matters

    The S&P 500 has plunged precipitously many times since the 2009 lows.  Yesterday’s 40-pt swoon not only reached our downside target range, but tagged the channel bottom from May 2009.  A reversal here would allow the appearance of an ever-improving market to continue.  So, that’s exactly what we’ll get today.

    2015-06-30 SPX daily since 2009As we noted in yesterday’s Big Picture, SPX’s low yesterday tagged the target we first set on June 1 [see: Sell in May, Go Away] and made official on June 8 with this chart:SPX daily CU 0745Without last week’s fakeout breakout, the timing would have worked better for a tag of the intersection between the purple channel bottom and the SMA200 (thick red line.)  Yesterday’s close definitely broke the channel bottom by a tick or two.

    2015-06-30 SPX daily 0601 CU Given that USDJPY has now backtested the December/March highs…

    2015-06-30 USDJPY daily 0600…and, CL has rebounded off the lowest possible point that would permit us to consider the white channel midline intact…2015-06-30 ES daily 0600…we’re left with two important questions.  How big a bounce will we get today?  And, is sell-off over?

    continued for members(more…)

  • The Big Picture: Jun 29, 2015

    It was nearly a month ago that we first suggested a drop to the SMA200 in late June.  We posted an iffy target in this chart on Jun 1 [see: Sell in May, Go Away.]2015-06-01 SPX daily 0712The question marks matriculated to a full-blown target on Jun 8 [see: June 8 CIW.]

    To get to 2050 would require a break in TL/channel support.  So, I hesitate to consider it “likely.”  For now, we’ll just call it a likely target should the support at the SMA100 not hold.

    SPX daily CU 0745Things seemed to go cattywampus on Jun 15 when rumors that Greece was fixed sent SPX sullied the rising red channel (and falling white channel) that suggested the Jun 22 timing.

    It required some serious charting gymnastics and patience (and a small measure of blind faith); but, it turns out that the Jun 1 forecast didn’t suck all that much.

    2015-06-29-SPX daily 1341Score one for charting.  The next step is to square the speed of today’s move with our analog from March.

    Stay tuned.

  • Coming Undone

    MerkelAnd, just like that, the ability of The Powers That Be to control the markets is once again called into question.

    Classic Rock fans might wish to enjoy a little Guess Who whilst reading this morning’s post and picturing Angela Merkel’s expression upon seeing the markets awash in red this weekend.

    With Greece seemingly irretrievably broken, the euro took a huge dump over the weekend.  The SNB swooped in and propped it up, less the carnage be worse than it already was.  The daily chart looks fairly benign…

    2015-06-29-EURUSD daily 0616…but, the hourly chart shows just how dramatic Sunday’s plunge (and, the subsequent prop job) was.  Still — only a gap close, and nothing more.  And, there’s plenty more downside potential to our 1.07 target.

    2015-06-29-EURUSD 60 0616Friday saw SPX reach the SMA100 as we anticipated [Friday’s post]:

    2015-06-29-SPX daily 0617And, today should see our next downside targets come into play, especially since USDJPY and CL have both clearly broken trend.  USDJPY has broken below the red channel midline…2015-06-29-USDJPY daily 0615…and, CL has officially dumped the purple channel and is shacking up with the white channel we proposed on June 19.  From Time to Pivot:

    However, I believe the CL’s purple channel is about to fail.  I expect the entire advance to pivot to the less aggressive slope illustrated by the rising white channel in the chart below. If so, the next stop should be a tag of the white midline (red dot.)

    2015-06-29-CL daily 0615Maybe it’s just us.  But, doesn’t it feel like “The Powers that Be” have inched a step or two closer to “The Powers That Were?”

    Not to worry, today’s move — and the subsequent drops we’ll see in the coming week — are all in keeping with our analog from this past March [see: A New Analog Mar 27, 2015].  We’ll explain.

    continued for members… (more…)

  • Charts I’m Watching: Jun 26, 2015

    SPX nailed our downside target yesterday with a solid backtest of the broken red channel at 2101.78.   2015-06-26 SPX daily 0600From yesterday’s member section:

    SPX just tagged 2105.  Since the decline was pushed out a few days, there’s a good chance it’ll continue lower and make a proper backtest to the falling red channel…look for a bounce between 2000 and 2102, but be cautious re overnight ramp jobs or dips.

    The overnight ramp job was modest — up 4 points at the present time.  It’ll be interesting to see how it does with CL breaking down.  Oil has been instrumental in stocks’ rally.  How will they do with it breaking trend?

    2015-06-26 CL daily 0600continued for members(more…)

  • Charts I’m Watching: Jun 25, 2015

    Yesterday’s melt-down was a good start on the Bat Pattern reversal, reaching the white .618 on its way to the cluster of moving averages we discussed yesterday and coming within 3 points of our downside target issued in Monday’s member section [see: Strange Brew]:

    Whether or not the rumor is true or the interview even occurred or the finance minister was telling the truth…who knows?  All I know is that the .886 was tagged and our bias is to the downside from here at 2128.  First downside target is 2105.34.

    2015-06-25-SPX daily 0600This morning, we have blow out data on personal expenditures which has initiated a sharp rally off of absolutely no technical support.  While the data’s benefit to the economy is dubious (are higher gas prices really going to aid in a recovery, or will we all spend less somewhere else?) the 14-pt spike in the eminis since yesterday’s cash close is a quandary.

    Screen Shot 2015-06-25 at 6.42.13 AMFortunately, there are other technical indicators which provide some important clues.

    continued for members…
    (more…)

  • Staying Alive

    travoltaSPX has continued to sell off, if tentatively, since we called for a reversal after Monday’s Bat Pattern completion.

    But, it hasn’t yet left the comfort of the rising gray channel and is back above the purple channel midline.   For now, the all-is-well meme is staying alive.

    2015-06-24-SPX 60 4amAlong the way, VIX revisited the yellow channel bottom…2015-06-24-VIX daily 0345…while USDJPY bounced where it needed to…2015-06-24-USDJPY daily 0400…and, CL kept its rising channel alive — so far.   Like SPX, it’s on the cusp of a significant breakdown.2015-06-24-CL daily 0400With Greece acting as the canary in the global financial markets coal mine, can we really tell what’s coming next?  There are quite a few clues.

    continued for members

    First, CL has gone essentially nowhere for about 7 weeks.  With SPX having completed the Bat Pattern and CL hanging by a thread, I think the next move is down — likely to the white channel midline at 57.94 or bottom at 49.72 — but potentially to test its former lows.

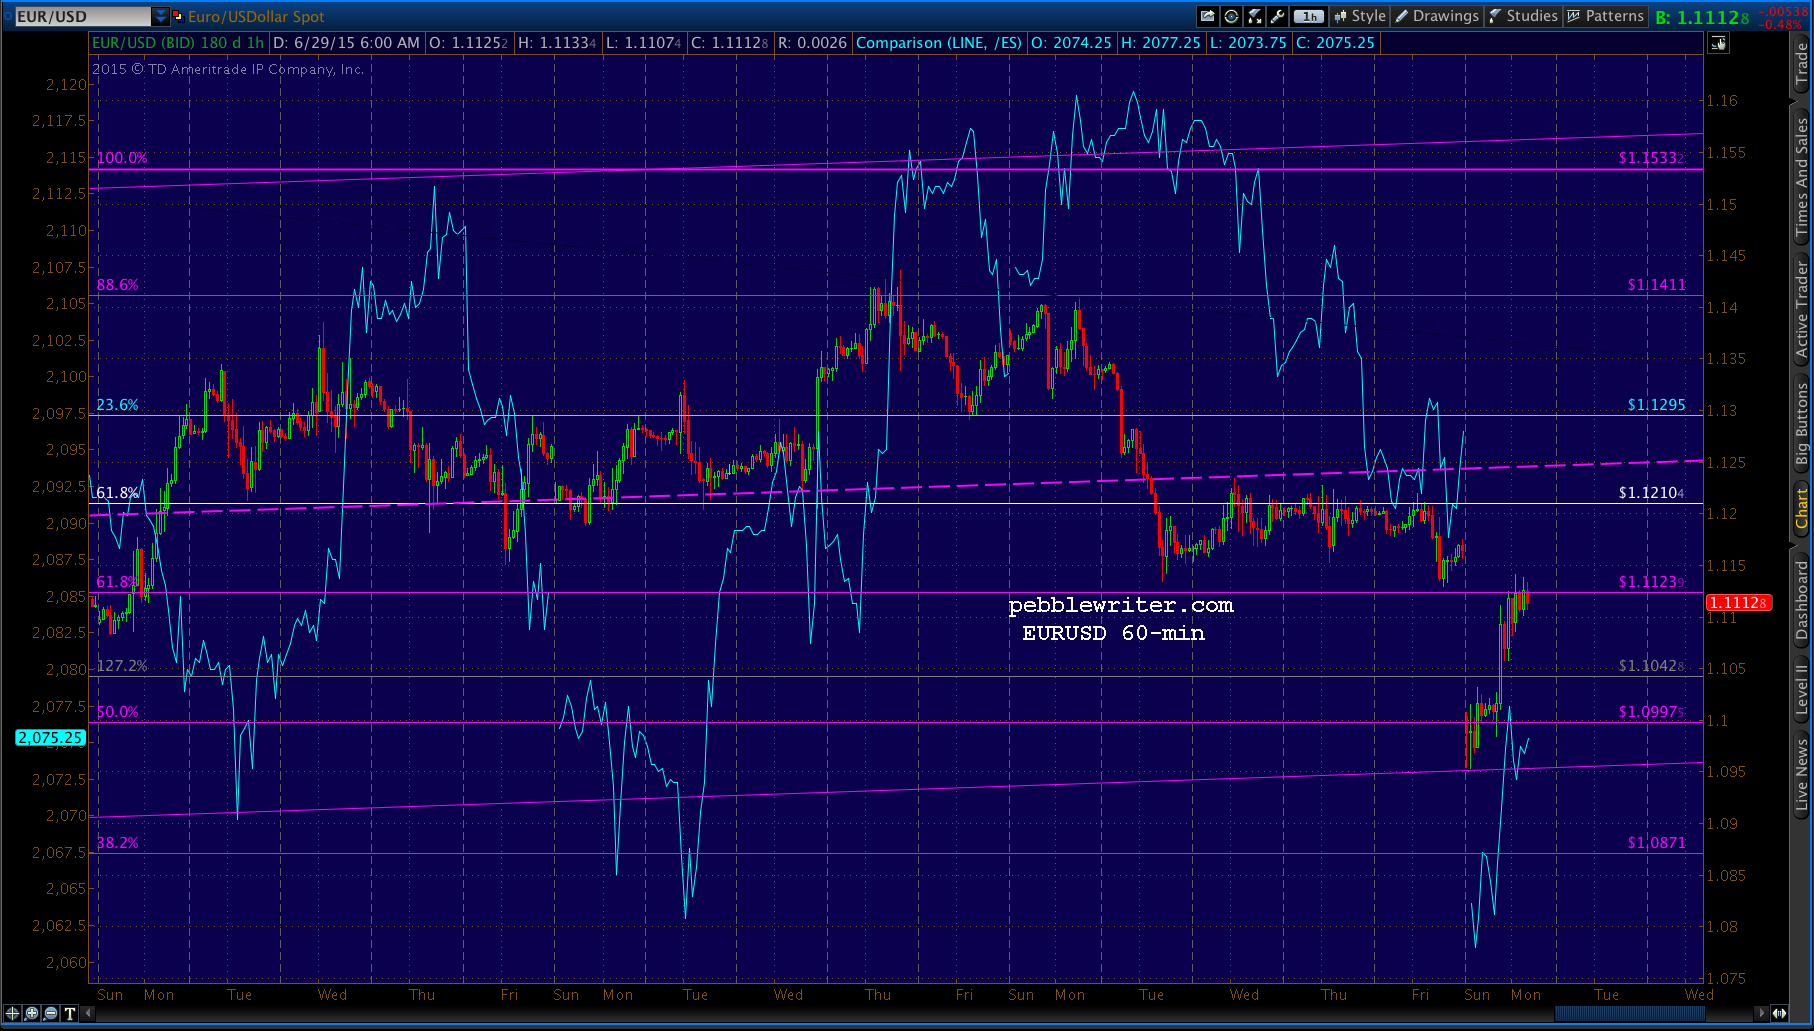
    Then there’s EURUSD, which is straddling the fence between bullish and bearish.2015-06-24-EURUSD daily 0345Yesterday’s dip below the purple channel midline and today’s backtest suggest further downside.  I like the idea of it, but the timing suggests a 4th of July low.  As we discussed yesterday, that would be unusual.

    Yet, several of the potential downside targets for SPX suggest the same outcome — if, of course, the white channel bottom can be broken and the SMA200 tested.

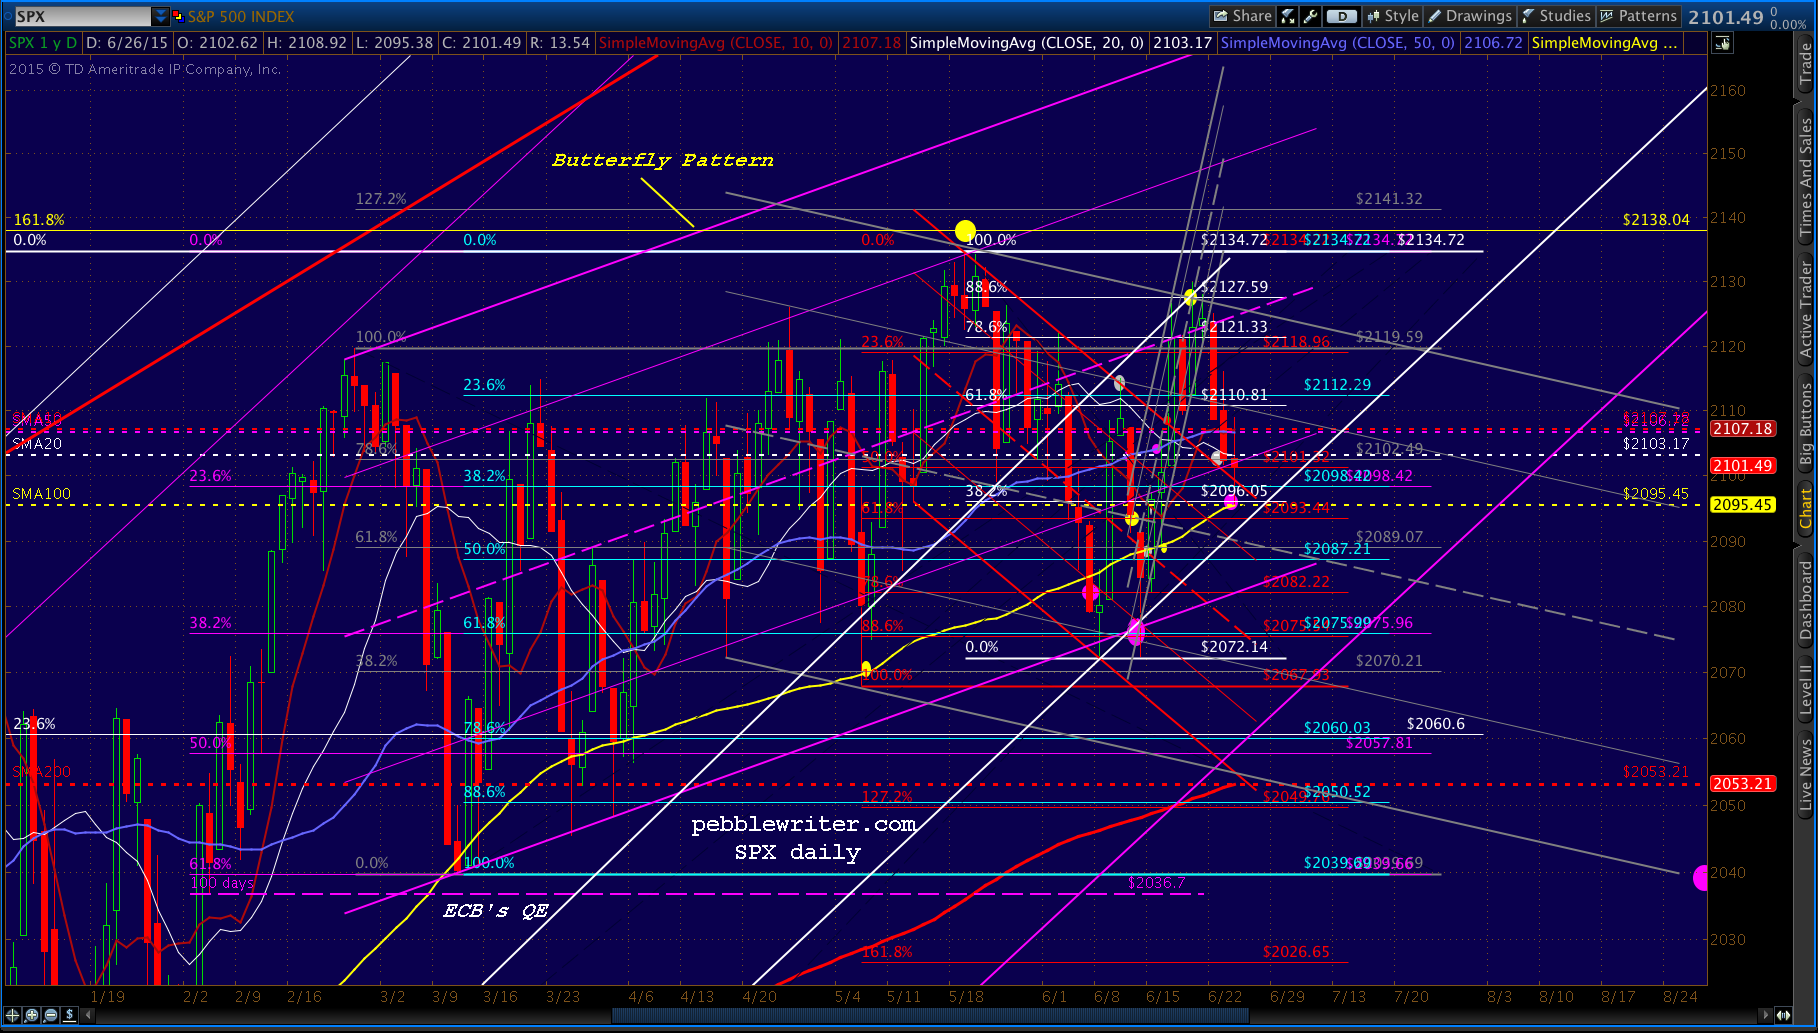
    Shorter term, our targets remain the same as yesterday’s.  SPX should find support at the bundle of moving averages between 2105-2107 (the 10, 20 and 50.)  2015-06-24-SPX 60-min 0400But, if those fail, a backtest of the falling red channel is in order — followed by our 2050 target.  The SMA200 is now up to 2051.57.  The rising gray channel should provide strong clues as to the intra-day moves.   A close-up:2015-06-24-SPX 60-min CU 0400 Last, note the negative divergence between SPX’s price and its daily RSI — which is bumping into a falling TL (white) from early in the year.  Of course, it’s also bouncing back and forth in a rising channel (purple.)  2015-06-24-SPX RSI wo either

    The bearish case is highlighted by the sequence of lower lows represented by the dashed red TL:  2015-06-24-SPX RSI w TL

    It can also be captured by a falling channel, shown below in red:  2015-06-24-SPX RSI w red

    I have to be out of the office today, but will try to check in during the day.

    GLTA.

  • The Waiting Game

    SPX finally reached our yellow target yesterday, slipping just past 2127.59 and testing our resolve before reversing into the close.  From yesterday’s member section:

    Recall that Thursday’s highs came up just short of a .886 tag, so it’s entirely possible that SPX will make it back to 2127.59.  We’ll set that as our upside target for now. For wave watchers, it would constitute a truncated 5th wave in a very mild 3rd from the 2072 lows [or, taking the bearish view, a completed C wave in the corrective wave from 2072.]

    2015-06-23-SPX 60 0610 While investors wait patiently for the latest great news out of Greece, currencies are racing around like crazy.  The euro is taking a beating…

    2015-06-23-EURUSD daily 0610…which has sent the dollar soaring…2015-06-23-DX daily 0610…which, of course, is boosting USDJPY…2015-06-23-USDJPY 60 0610…which is enabling the eminis to cling to a slight gain.  But, will it hold?

    continued for members(more…)

  • A Strange Brew

    strangeCombine one part meaningless press conference, one part unfounded rumor and two parts goal-seeking algos and you end up with a 19-pt ramp job overnight.

    The Greek situation remains volatile, though it seems pretty clear that deadlines will continue to be extended until TPTB can announce something they consider a “success.”

    Friday’s drop easily tagged our initial downside target and within 4 points of our secondary one.  At the current pace, this morning’s ramp is likely to undo all that downside.

    2015-06-22-SPX 60 0615continued for members(more…)

  • Time to Pivot

    Yesterday’s forecast worked out reasonably well.  From the member section:

    In the meantime, I can easily imagine a pseudo-breakout that reaches the white .786 or .886 (yellow dot) into the end of the week.

    The 26-pt spike took SPX to 2126.65, less than one point away from our yellow dot at the .886 Fib — close enough for government work, which is pretty much what it was.

    2015-06-18 SPX 60 1725

    The mainstream media consensus was that the factors which produced the single biggest opening minute ramp job since 2011 [per Eric Hunsader at Nanex, see HERE] consisted of mixed economic news and lower-than-expected inflation that would cause the Fed to hesitate in raising rates later this year.

    This, on the same day that the IMF floated the idea that central banks will need to act as the buyers of last resort the next time “markets” crash — which, of course, is exactly what will happen if investors ever get the sense that the central bank intervention (which drove prices to unsustainable levels in the first place) is waning.

    While we’ll never tire of nailing our forecasts, we yearn for the days when something other than central bank intervention and joined-at-the-hip algorithmic HFT ramp jobs determined stock prices.

    On to today’s forecast.

    continued for members(more…)

  • No Backbone… No Clue

    yellenYesterday morning, we titled our daily post with the rhetorical question: “has the Fed found its backbone?”

    After 7 years of currency, interest rate and stock market manipulation, is the Fed finally ready to let the “markets” find their own equilibrium and hazard even a 0.25% increase in interest rates?  Apparently not.

    From the rearrangement of the dots, we can surmise that the FOMC has become, if anything, more cautious regarding the forward outlook.  Rate increases will likely be later and lower than last forecast.  Our outlook remains that the increase will be minimal or, more likely, non-existent in 2015.

    Surprisingly, even the mainstream media is starting to pick up on the “Fed backed into a corner” narrative.   See this INTERVIEW, which aired on CNBC of all places.

    The S&P 500 loved this news, and bounced nicely where/when we expected.  Yesterday morning, we suggested a short at 2103.64 (2103.67 was the high) and covering at 2095.61 for conservative traders and the SMA100 (2089) for more aggressive types.

    2015-06-18 SPX 60 0600

    These proved to be the correct turning points, which were followed by an algo-driven melt-up into the close as expected.

    Remember, at least 75% of the time, FOMC announcements/press conferences have led to a frenzy of algo activity that drives prices higher into the close.  It’s part of the “FOMC has got our back” meme that investors have come to accept/expect.

    The algo was of the crude oil futures variety, with a 3.6% spike from yesterday’s lows through last night’s ramp job which has left the eminis 6.50 points higher a few minutes before the cash open this morning — despite USDJPY’s continuing slump.

    2015-06-18 CL 15 0600

    Where to from here?

    continued for members... (more…)