Author: pebblewriter

  • Bad Good News

    Yesterday, SPX nailed our downside target from May 26 — a drop from 2134.72 to 2093.44.  It was a whopping 1.93% — though, from all the excitement, you’d think the “market” was crashing.  That’s what happens when investors come to expect uninterrupted daily gains.2015-06-05 SPX 60 0530With this morning’s better than expected jobs report, investors are once again being reminded that their success has come courtesy of central bankers.  And, if employment looks especially rosy, how much longer will the Fed keep rates in the cellar? [hint: a long, long time.]

    Our targets are being hit left and right — some in reaction to the “bad” good news — others in an attempt to mitigate its effects. USDJPY just tagged the white 1.618 we discussed yesterday…

    2015-06-05 USDJPY daily 0530
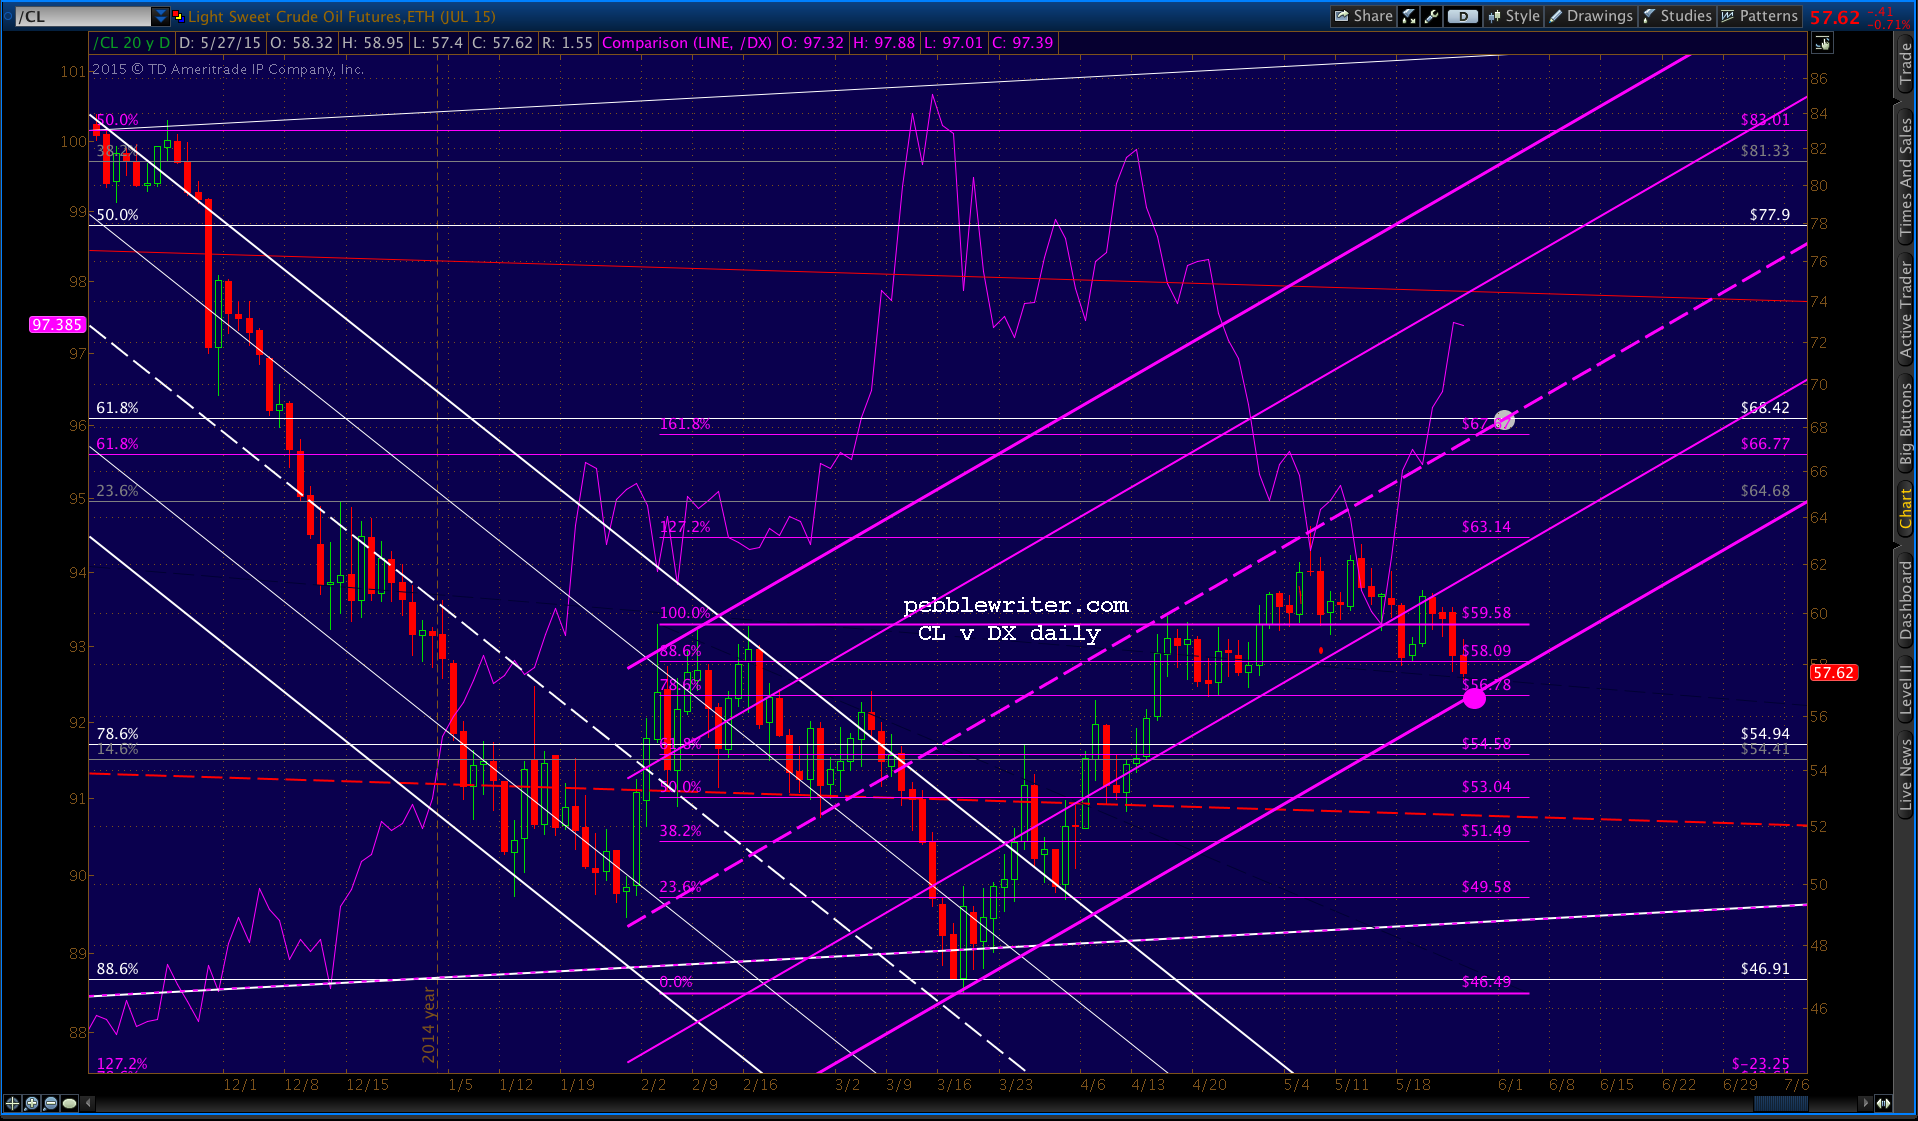
…and, CL reversed after slightly overshooting our downside target at 57.59 (even after OPEC members voted to maintain current production levels.)

    2015-06-05 CL 60 0530TNX slightly overshot the white channel midline — but, ran right into the red channel midline.2015-06-05 TNX daily 0530
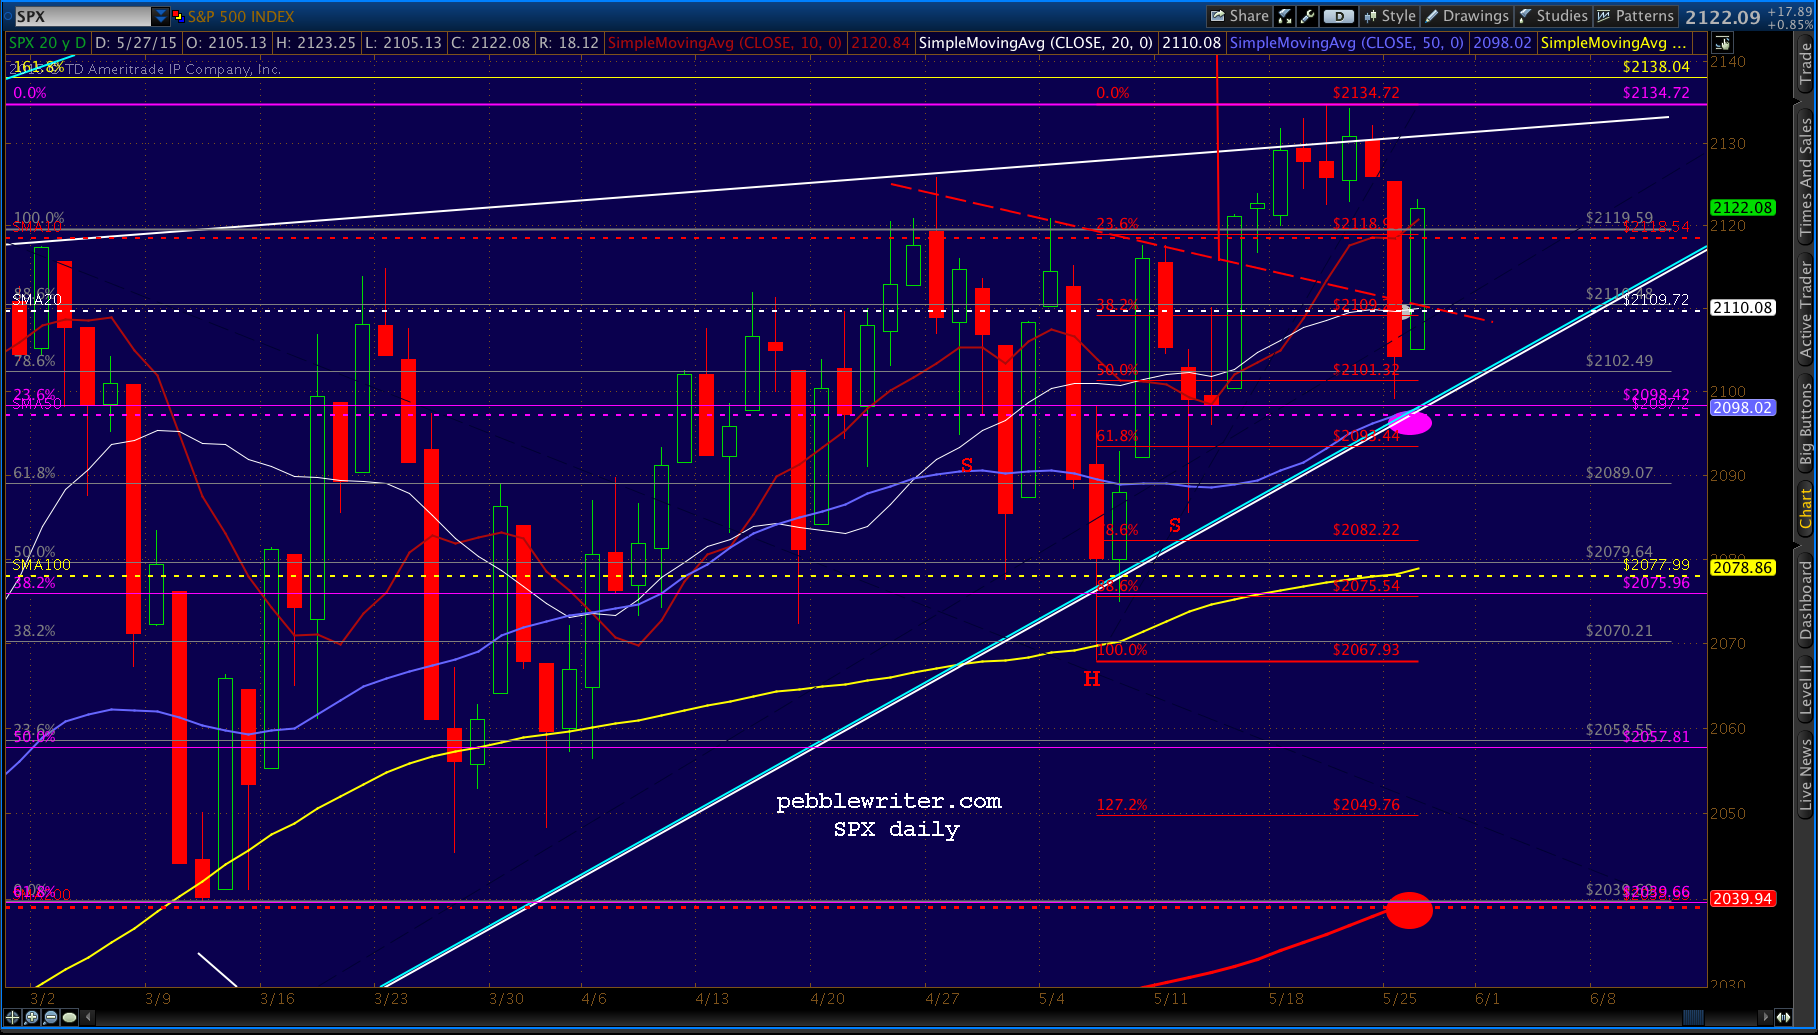
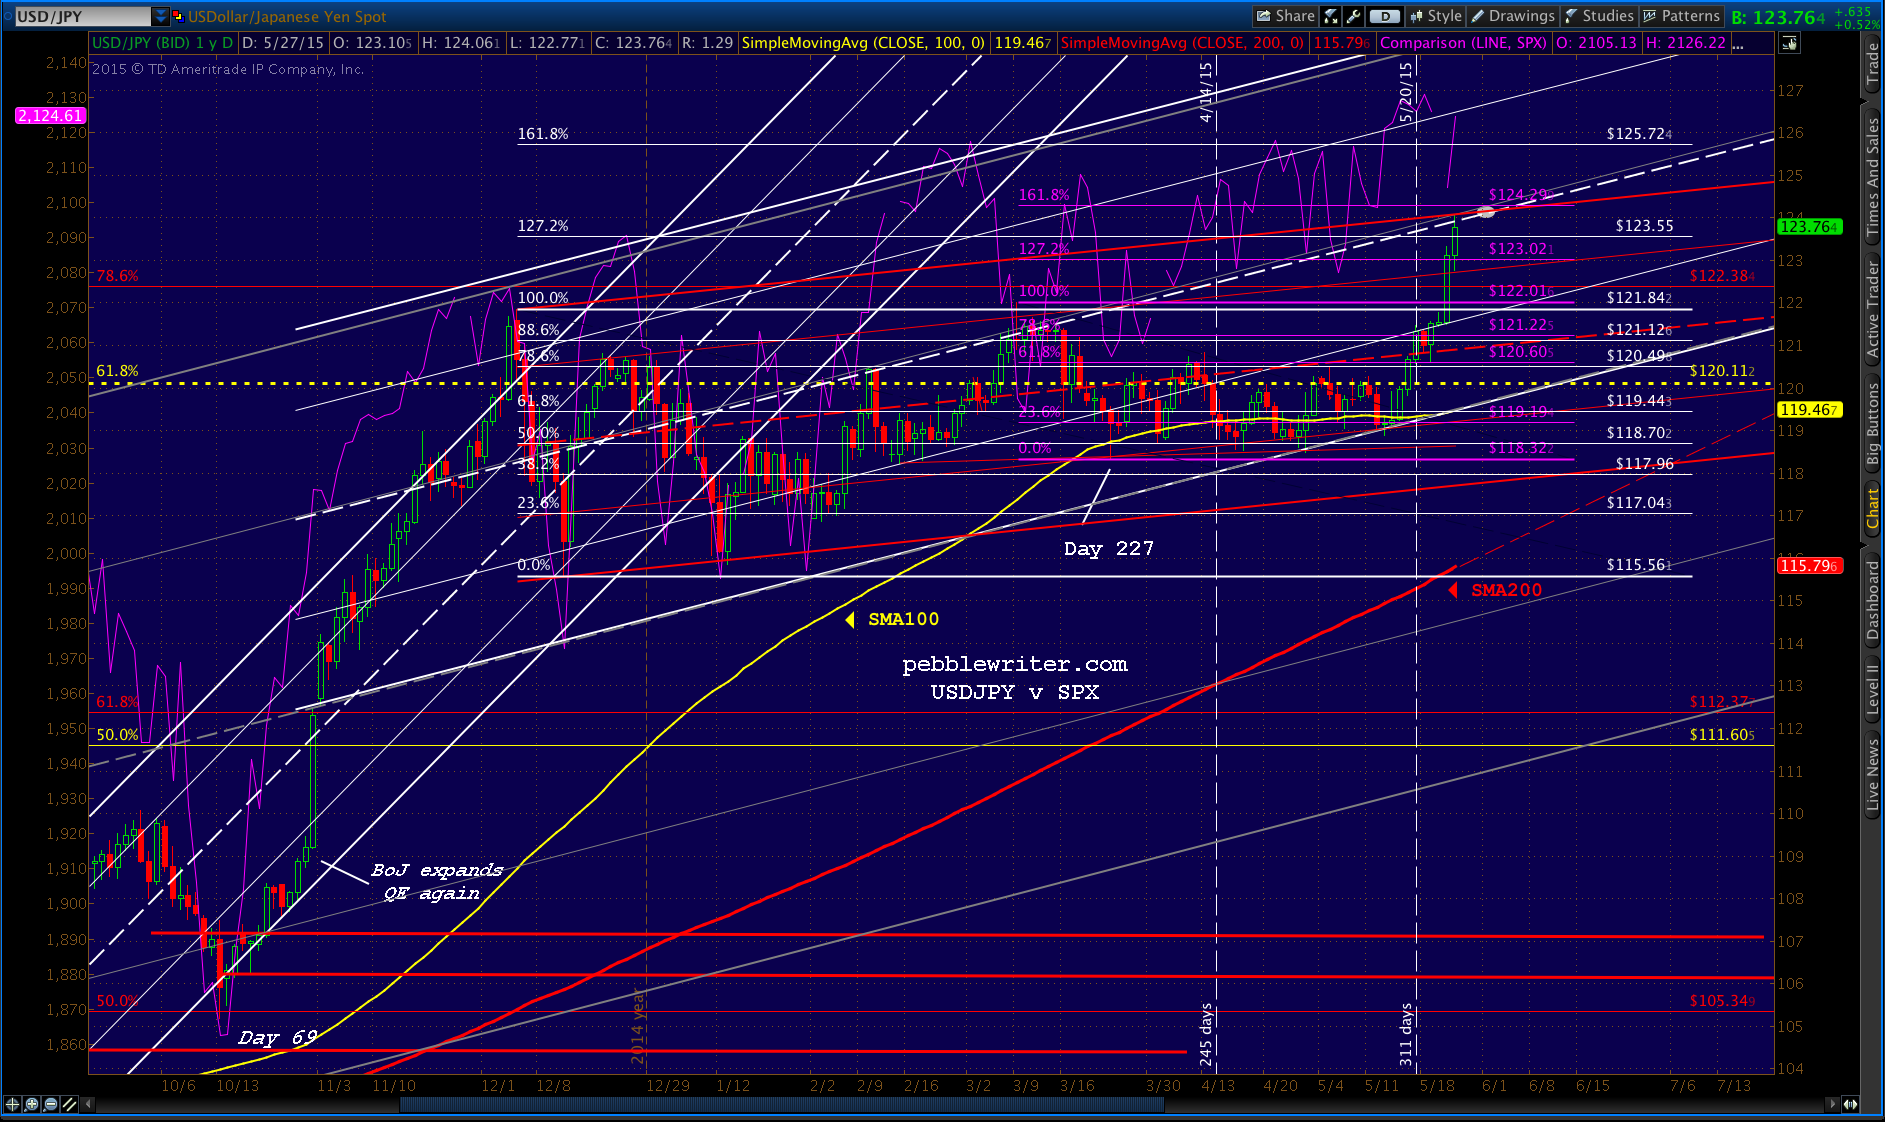
I have to be away from the office for a few hours this morning, so I’ll dispense with the members’ section today.  Assuming (as we do) that USDJPY runs out of steam at 125.72 and CL bounces back at 57.09 or so and TNX tops out at 24.38, SPX should have little trouble tagging our next downside target at 2082ish, with an overshoot a distinct possibility.

    Note this is the SMA100, which has provided strong support over the past many months.  Of course, that was before completion of the Last Big Butterfly Pattern.


  • Update on Bonds: Jun 4, 2015

    We posited yesterday that after over a year of constant bond market manipulation (the latest instance), TPTB had broken the link between lower interest rates and lower stock prices.  It was a strong positive correlation that we wrote about quite some time ago in forecasting a stock market correction (that obviously never happened.)

    2015-06-04 TNX weekly 20yrThat correlation worked both ways insofar as rising interest rates were often (but, not always) a sign of a recovering economy and, hence, stock market rally.  The correlation broke down altogether in early 2014 when interest rates fell, but stocks continued soaring.2015-06-04 TNX wkly 2007-15We wondered whether it would, thus, be difficult to reestablish the correlation (or, at least the perception thereof) in the event that rates started rising.  There are about 18 trillion reasons to think it just might be a challenge.

    As even former Fed presidents have admitted, a return to normal interest rates is not an option — not with $18 trillion nominal in federal debt outstanding.  We might be able to manage as long as the FOMC buys all the bonds in sight, keeping interest rates below 2-3%.  But, a return to the long-term 10-yr note average of 6% would surely bankrupt the US.  Japan and the eurozone would be right there with us.

    Janet Yellen keeps talking higher interest rates because there’s this illusion that higher rates are evidence of a healthy economy.  But, with this much debt outstanding, higher rates would mean impending disaster.

    With that cheery thought, we present a simplified daily chart — showing that 10-yr note yields have tested and been rejected by the midline of the 20-year old falling white channel.

    2015-06-04 TNX daily 1222As Lawrence Lindsey ominously states in the above-reference discussion:

    “…the Fed has almost no credibility when it comes to a sense that they will be able to stay on top of this ticking monetary bomb.”

    With SPX reaching our next downside target [Charts I’m Watching: May 26] earlier today, we can’t help but agree.  For today’s updated equity forecast, see: Unintended Consequences.


  • Unintended Consequences

    We posited yesterday that after over a year of constant bond market manipulation (the latest instance), TPTB had broken the link between lower interest rates and lower stock prices.  It was a strong positive correlation that we wrote about quite some time ago in forecasting a stock market correction (that obviously never happened.)

    2015-06-04 TNX v SPX wkly 0700That correlation worked both ways insofar as rising interest rates were often (but, not always) a sign of a recovering economy and, hence, stock market rally.  The correlation broke down altogether in early 2014 when interest rates fell, but stocks continued soaring.

    We wondered whether it would, thus, be difficult to reestablish the correlation (or, at least the perception thereof) in the event that rates continue to rise (and, bond prices fall.)  The past two weeks have suggested it might just be.

    2015-06-04 ZN v ES 60 0606Yesterday’s call to short SPX at 2121 worked out well, and — with the eminis currently off 10 points — our downside targets are looking better by the minute.  Factors?

    China broke down again — and, recovered again — overnight.  Screen Shot 2015-06-04 at 6.13.30 AMWhile, CL is again faltering.  The rising wedge that became the rising red channel is now a broken channel, and CL is solidly back in the month-old falling white channel (though the rising purple channel bottom isn’t far below at 57.59ish.

    2015-06-04 CL v ES 60 0724The only question is whether USDJPY will get another stock-saving bounce off the red trend line (neckline?) that’s prevented a more serious sell-off over the past week.

    2015-06-04 USDJPY v ES 60 0606Updated SPX charts in a moment…

    continued for members(more…)

  • Charts I’m Watching: Jun 3, 2015

    Yesterday’s initial equity sell off was abruptly arrested by the usual CL, USDJPY and EURUSD ramp jobs — but with a couple of twists, which we’ll get to in a moment.

    USDJPY sold off initially, but was propped up at a minor TL — which was enough given the expectation of a corrective retrenchment that would normally follow an uninterrupted rally from the bottom of a channel to its .786 line.2015-06-03 USDJPY v ES 60 0615CL set up a bullish rising wedge, which it promptly bailed on after “markets” closed.  It has since transformed that broken wedge into a bullish rising channel — coincidentally just in time for this morning’s open.

    As of yesterday’s high, CL had risen about 9% in three days — all in order to drive algos that produce higher stock prices.2015-06-03 CL v ES 60 0615continued for members(more…)

  • Charts I’m Watching: Jun 2, 2015

    Futures fell as much as 23 points from yesterday’s highs overnight, which led to CL’s sudden departure from the falling white channel it’s been in for the past month.

    2015-06-02 CL v ES 0615Given that the dollar is sliding and the yen appreciating, it’ll probably be too little, too late.  We’ll stick with Friday’s downside targets for now.

    continued for members(more…)

  • Sell in May, Go Away?

    SPX rose only 1% in May, largely on the back of rebounding oil futures and a last-minute surge by USDJPY.  Given the recent completion of the Last Big Butterfly pattern, will the old admonition to “sell in May and go away” apply in 2015?

    2015-06-01 USDJPY daily 0600Crude light futures (largely disconnected from reality these days) continue to provide daily boosts — particularly when USDJPY is unable.   But, in May, it was CL’s turn to lose some altitude.  And, it hasn’t (yet) bothered to break out of its month-old falling channel.

    2015-06-01 CL v ES 60 0600CL and DX are strikingly inversely correlated these days. So, any sell-off by USDJPY — which would normally send stocks into a tailspin — is typically accompanied by a dip in the dollar, which of course, sends CL higher.  CL-driven algos kick in, and voila! Stocks are propped up with little effort.  It’s happening this morning.

    Somewhat surprisingly, the effects of the ECB’s long-awaited QE program have fizzled — producing only a 3% gain in the last several months.  Unlike the yen, the euro’s plunge in value inflicted losses rather than gains and was massively front-run.  It seems it’s not ready to take over carry trade duty from the yen anytime soon.

    With USDJPY needing to do some retrenching, and CL losing ground over the past month, what’s going to keep stocks from following the “Sell in May, Go Away” script?

    In several hours of charting over the weekend, I see no reason to change my current downside bias.  The fact that USDJPY has shot up on no news indicates TPTB are willing to inflict at least a little more yen weakness on the unsuspecting public.

    But, it’s the huge drops that have traditionally been responsible for getting SPX up and over the important humps such as 1823.  And, huge drops are produced by huge increases in QE — which typically don’t happen unless the stock “market” is plunging.

    2015-06-01 SPX daily 0712

    Stay tuned.


  • Charts I’m Watching: May 29, 2015

    Yesterday played out very much as planned, with SPX coming within 2 points of our downside target before crude light’s rebound spoiled the bears’ fun.

    Recall that we were looking for CL to reverse at 56.78 — the purple .786 — when the cash market opened.  And, that’s exactly what happened.

    2015-05-29 CL 60 0600This nearly 4% bounce off its lows provided all the ammunition SPX needed to abort a full backtest of the IH&S neckline and SMA20 and nearly close in the green.2015-05-29 SPX 60 0600It was a near repeat of Tuesday’s plunge which also came up short.  The eminis are currently off 4 points, but were down as much as 10 points overnight before the euronext “broke” — which is code for “let’s turn this puppy around, but fast!”

    Then economic elephant barging into the algos’ room today is the BEA report that the economy contracted 0.7% in Q1.  From Briefing.com:

    Screen Shot 2015-05-29 at 6.43.54 AMAs Briefing.com points out, the 1.1% decline in retail sales is the biggest quarterly drop since the Great Recession.  Then, thanks to the dollar’s lofty levels, there’s the continuing plunge in exports…

    Screen Shot 2015-05-29 at 6.44.52 AMGiven all the above, we’re left to wonder whether SPX can defy week-end and month-end convention of a stirring display of all-is-well-ism and follow through to the downside.

    As usual, USDJPY holds the key.   continued for members(more…)

  • Charts I’m Watching: May 28, 2015

    I had to laugh this morning when I read about the BATS crackdown on algo FX rigging.  One look at USDJPY (which reached our intermediate upside target yesterday) explains why BATS’ actions won’t change anything (other than for some HFT firms themselves — good riddance!)

    It certainly won’t make any difference to the FX markets, where the biggest perpetrators of FX rigging are central banks themselves!

    2015-05-28 USDJPY daily 0600The BOJ understands the yen carry trade [see HERE] extremely well.  It’s brilliant in its simplicity: crush the yen, and stocks go up.  They have control over the yen, and they now own tens of trillions in Japanese and global stocks in a very highly leveraged balance sheet. Of course they’re going to manipulate the yen!

    CL, by the way, also hit our downside target when and as expected.  From yesterday’s members’ section in Oil’s Plan B:

    As such, we should see SPX sell off tomorrow.  But, an overnight slump by CL followed by a rebound as SPX opens wouldn’t be a huge surprise… On balance, I’d rather be short than long from here at 2126.

    It just slipped down to our target as the cash market is about to open.  We’ll find out very soon whether or not that rebound is in store.

    2015-05-28 CL 60 0630With the Shanghai Composite plunging 6.5% overnight, there’s a very good chance.

    continued for members(more…)

  • When Chasing the Tape – Please Mind the Lemmings

    An excellent article from former Director of OMB David Stockman.  Check out David Stockman’s Contra Corner.

    *  *  *  *  *

    May 27, 2015

    Prior to today’s open MarketWatch provided a reminder that the lemmings are still rampaging in the casino. With respect to Tiffany’s (TIF) pre-market earnings announcement, it telegraphed the reason why TIF soared by 12% or about $1.5 billion during the course of the trading day:

    Tiffany & Co.’s stock climbed 3.5% in premarket trade Wednesday, after the luxury jewelry retailer reported better-than-expected fiscal first-quarter profit and sales, and provided an upbeat earnings outlook for the year.

    Well, not exactly. Worldwide sales fell by 5%  from $1.01 billion in the April quarter last year to $962 million during the current the quarter. Same store sales dropped even more—-by 7%.

    Likewise, net income of $105 million represented a 17% plunge from last year’s $126 million. Not surprisingly, however, this was greeted as rip-roaring good news because the street “consensus” had marked down expected earnings to just $91 million or by 27% from last year’s QI level.

    As for the “upbeat”  earnings guidance, it amounted to this:

    For the full fiscal year, Tiffany said it expects “minimal growth” in earnings per share from the $4.20 earned in fiscal 2014….

    Apparently, flat is the new “upbeat”, but even then TIF didn’t actually earn $4.20 in the year ending in January. That’s the ex-items fiction that they use in the casino. TIF actually earned $3.73 per share last year.

    So at today’s close of $94.50 the company was actually trading at 25X a net income number that management itself attested will be dead in the water this year; and which is at serious risk of shortfall because TIF is starting 2015 deep in the hole based on these crummy Q1 results.

    Actually, upon today’s announcement Tiffany’s LTM net income computes out to $463 million. That happens to be the exact same number as the $464 million it posted for the LTM period ending way back in September 2013.

    In short, TIF’s earnings have been dead in the water for several years now, but that’s not the half of it. Tiffany is the very embodiment of a piggyback rider on the worldwide financial bubble fueled by the central banks.

    Its earnings have already stalled out due to the crackdown on luxuries in China, but that’s just the tip of the diamond. The real crackdown will come when the third great financial bubble of this century finally bursts and the top 5% ratchet back sharply on their luxury jewelry purchases as they did in 2000-2001 and 2008-2009.

    At that point sales will plummet by double digits and TIF will be lucky to earn $2 per share. So the lemmings had a profitable day in the casino. Yes they did—–chasing a stock sitting at the very apex of the global luxury bubble to a valuation that would amount to 50X what the company might actually bring to the bottom line in the post-bubble world ahead.

    But don’t say the lemmings are totally undiscriminating. Stampeding in the opposite direction, they marked down the stock of Shake Shack (SHAK) today by fully14%. This happened upon the news that its $50 million per unit hot dog and hamburger stands might not be suitable as “Chicken Shacks”.

    But in taking down SHAK’s market cap from $3.0 to $2.7 billion, its not as if the casino experienced an outbreak of old-fashioned price discovery. The stock closed for the day trading at a round 1,333X its $2 million of earnings recorded for the year just ended.

    More importantly, the broad market made another chop upward on extremely thin volume and completely phony news about Greece. Accordingly, with each passing session the casino is getting more dangerous, but the lemmings have no clue and the narrative gets ever more specious.
    ^SPX Chart

    ^SPX data by YCharts

    So today the NASDAQ made a new all-time high, and the S&P 500 returned to its nose bleed valuation of 21X reported earnings. That is, earnings that are already down 6% from the September LTM level, and which have a long way yet to plunge as the global deflation/recession gathers force.

    Needless to say, the Fed’s liquidity saturated casino is not on the level, not in the slightest. Today you had to be gulping down nearly toxic doses of Kool-Aid to believe that Tiffany’s earnings bore any resemblance whatsoever to “upbeat”.

    But, then, still another market rip was just a further reminder that the casino remains crowded with rampaging lemmings, and that the dip buyers will keep hitting the “offer” until Wall Street’s fast money gamblers have nothing left to sell.

     *  *  *  *  *

    Not much to add, except that this sort of nonsense is now a daily occurrence.  It’s endemic to nearly every asset class and, needless to say, the stock “market” as a whole.  It wouldn’t be so dangerous except for the fact that it will unwind some day — leaving those who come to trust these machinations twisting in the wind.

  • Oil’s Plan B

    Oil has been a great friend to stocks over the past several months, picking up the slack when USDJPY failed to deliver algo-driven gains.  But, every once in a while, enough investors pay attention to fundamentals that algos are — however temporarily — overridden.  Such is the case for CL.  From Bloomberg:

    Iraq About to Flood Oil Market in New Front of OPEC Price War

    (Bloomberg) — Iraq is taking OPEC’s strategy to defend its share of the global oil market to a new level.

    The nation plans to boost crude exports by about 26 percent to a record 3.75 million barrels a day next month, according to shipping programs, signaling an escalation of OPEC strategy to undercut U.S. shale drillers in the current market rout. The additional Iraqi oil is equal to about 800,000 barrels a day, or more than comes from OPEC member Qatar. The rest of the Organization of Petroleum Exporting Countries is expected to rubber stamp its policy to maintain output levels at a meeting on June 5.

    The rapidly rising channels from the March lows have all fallen by the wayside, and CL’s best shot at helping to prop up stocks lies in a reversal at the purple .786 (56.78) later today.

    Should it play out this way, the script would revolve around a widened purple channel that offers the white .618 as a midline waypoint.  But, the odds of reaching the target get more and more remote with each passing day.  We’ll see…

    2015-05-27 CL daily 0625USDJPY has reasserted itself, breaking out prematurely to new highs in a reminder that it is still the undisputed primary driver of stock prices via the yen carry trade.  What else is new?  Sorry, Japanese consumers and manufacturers; but, an increase in your import expenses is a small price to pay for keeping stock prices on the rise.

    2015-05-27 USDJPY 0625All these machinations leave DX in a state of nonsensical chartitude, again making a mockery of basic channel theory as it did in mid-March.  If CL finds support the the purple .786, look for DX to run out of steam at the red .618 (97.558.)

    2015-05-27 DX daily 0625I don’t mind if prices occasionally dip above or below an acceleration channel in moments of exuberance or abject terror.  But, the chart above shows an abject disregard for maintaining even the appearance of legitimacy.

    Such is the environment in which we find ourselves — where the determination to keep SPX on the rise trumps nearly all other financial and economic forces.  We’ve wondered for the past month whether or not the Last Big Butterfly pattern would produce the kind of downturn it should.

    continued for members

    Bottom line: as long as USDJPY’s rise is unrestrained…no, it won’t.  The algos are in control almost all the time.  And, all it takes these days to prompt a rally or recovery is a shot of forex manipulation which, as the headlines assure us, is not only possible but commonplace.

    Here’s the SPX daily chart, showing how yesterday’s target was close — but not quite on the money.

    2015-05-27 SPX daily 1154From this vantage point, I’d say USDJPY is due for a reversal at the target we set earlier…2015-05-27 USDJPY daily 1255…and, CL has a little further to go to reach 56.78.2015-05-27 CL daily 1255As such, we should see SPX sell off tomorrow.  But, an overnight slump by CL followed by a rebound as SPX opens wouldn’t be a huge surprise.  In that case, chalk this one up to another miraculous recovery on absolutely no news whatsoever.

    On balance, I’d rather be short than long from here at 2126.