

The S&P 500 has plunged precipitously many times since the 2009 lows. Yesterday’s 40-pt swoon not only reached our downside target range, but tagged the channel bottom from May 2009. A reversal here would allow the appearance of an ever-improving market to continue. So, that’s exactly what we’ll get today.
 As we noted in yesterday’s Big Picture, SPX’s low yesterday tagged the target we first set on June 1 [see: Sell in May, Go Away] and made official on June 8 with this chart:
 Without last week’s fakeout breakout, the timing would have worked better for a tag of the intersection between the purple channel bottom and the SMA200 (thick red line.) Yesterday’s close definitely broke the channel bottom by a tick or two.
 Given that USDJPY has now backtested the December/March highs…
 …and, CL has rebounded off the lowest possible point that would permit us to consider the white channel midline intact…
 …we’re left with two important questions. How big a bounce will we get today? And, is sell-off over?
continued for members…Much will depend on what happens with the Greece situation today. However, the charts suggest that the bounce could easily reach 2072 (the red channel midline) or, with a little more effort, 2081 (a backtest of the broken purple channel bottom.)
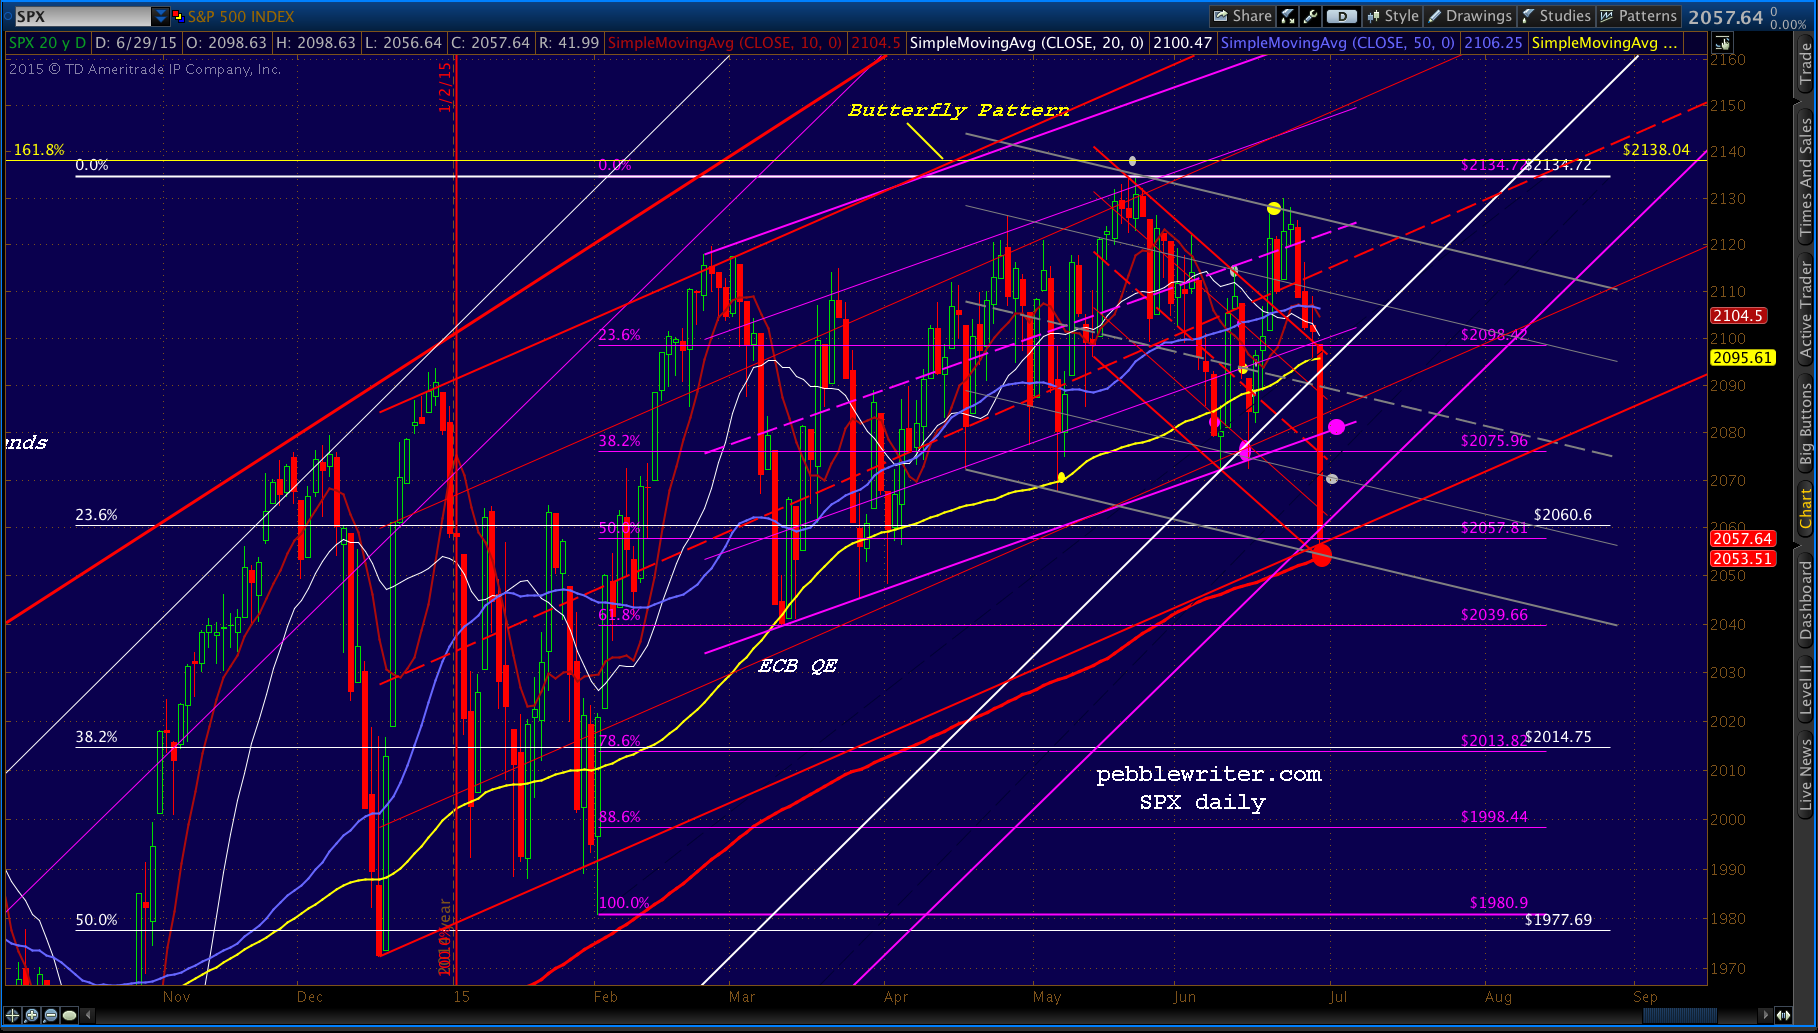 Note the introduction of the rising red channel which might be coming into play in the wake of the rising purple channel having given up the ghost.
The question of whether the plunge is done depends not only on Greece, but on whether the BOJ was sufficiently spooked by a 2% selloff in SPX to expand QQE in the next month. It is absolutely required if the yen carry trade is to survive.
While they have plenty of money tied up in US stocks, it’s the Nikkei 225 that they care most about. And, yesterday’s sell-off did some technical damage to the NKD. Note the break of the red channel bottom and today’s backtest.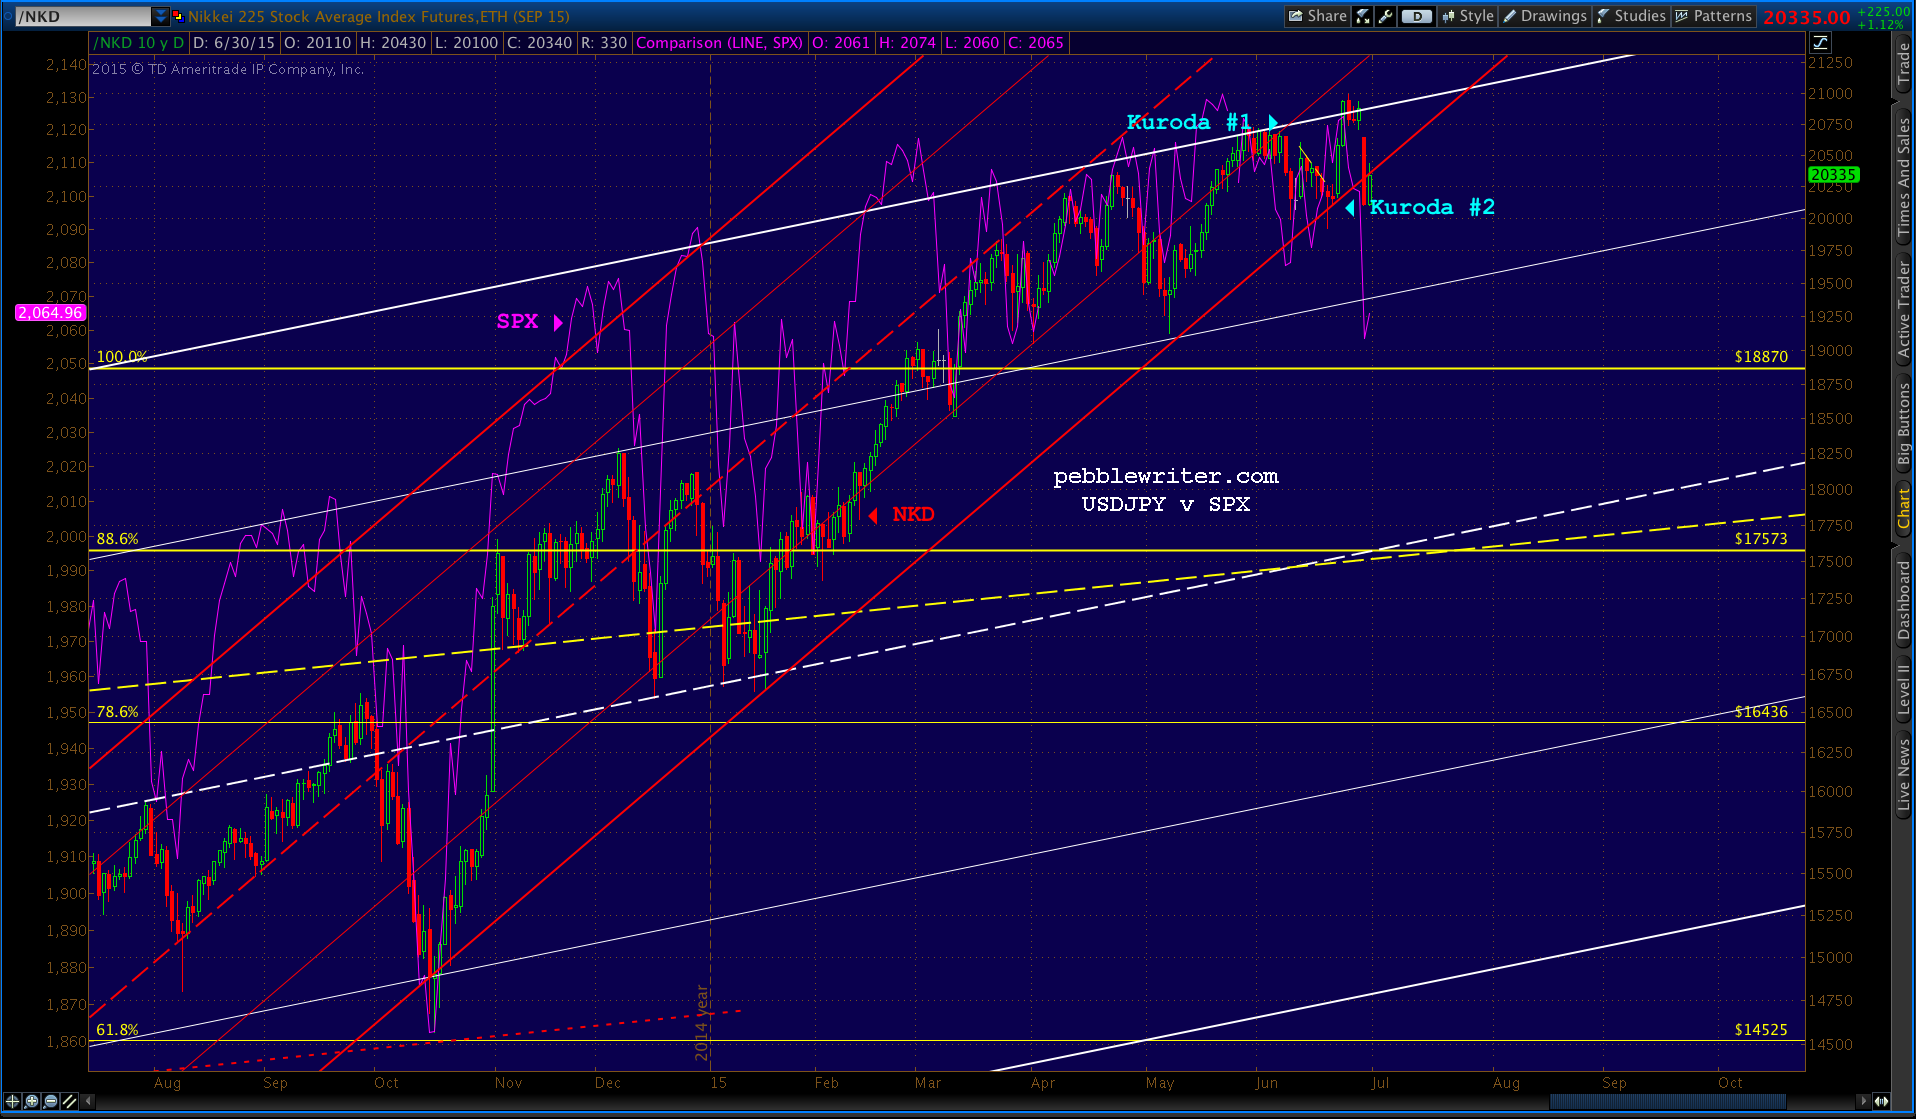 I have thought it more likely that SPX’s SMA200 would be broken and a more serious sell-off threaten the status quo. As we noted yesterday, the SMA200 wasn’t even tagged, let alone broken. This has happened before, notably on Feb 2; so, it could happen again. But, at least then, we were left with a reversal candle for the day.
Bottom line, there’s probably another lower low coming, even if it’s early next week rather than today (the last day of the month.)
Comments
One response to “All That Matters”
[…] On to that “market.” Yesterday, SPX nailed our bounce target offered on Monday, topping out at 2082.78. From Monday’s post All That Matters: […]