

Part I of a two-part post. Continued in Part II HERE.
* * * * *
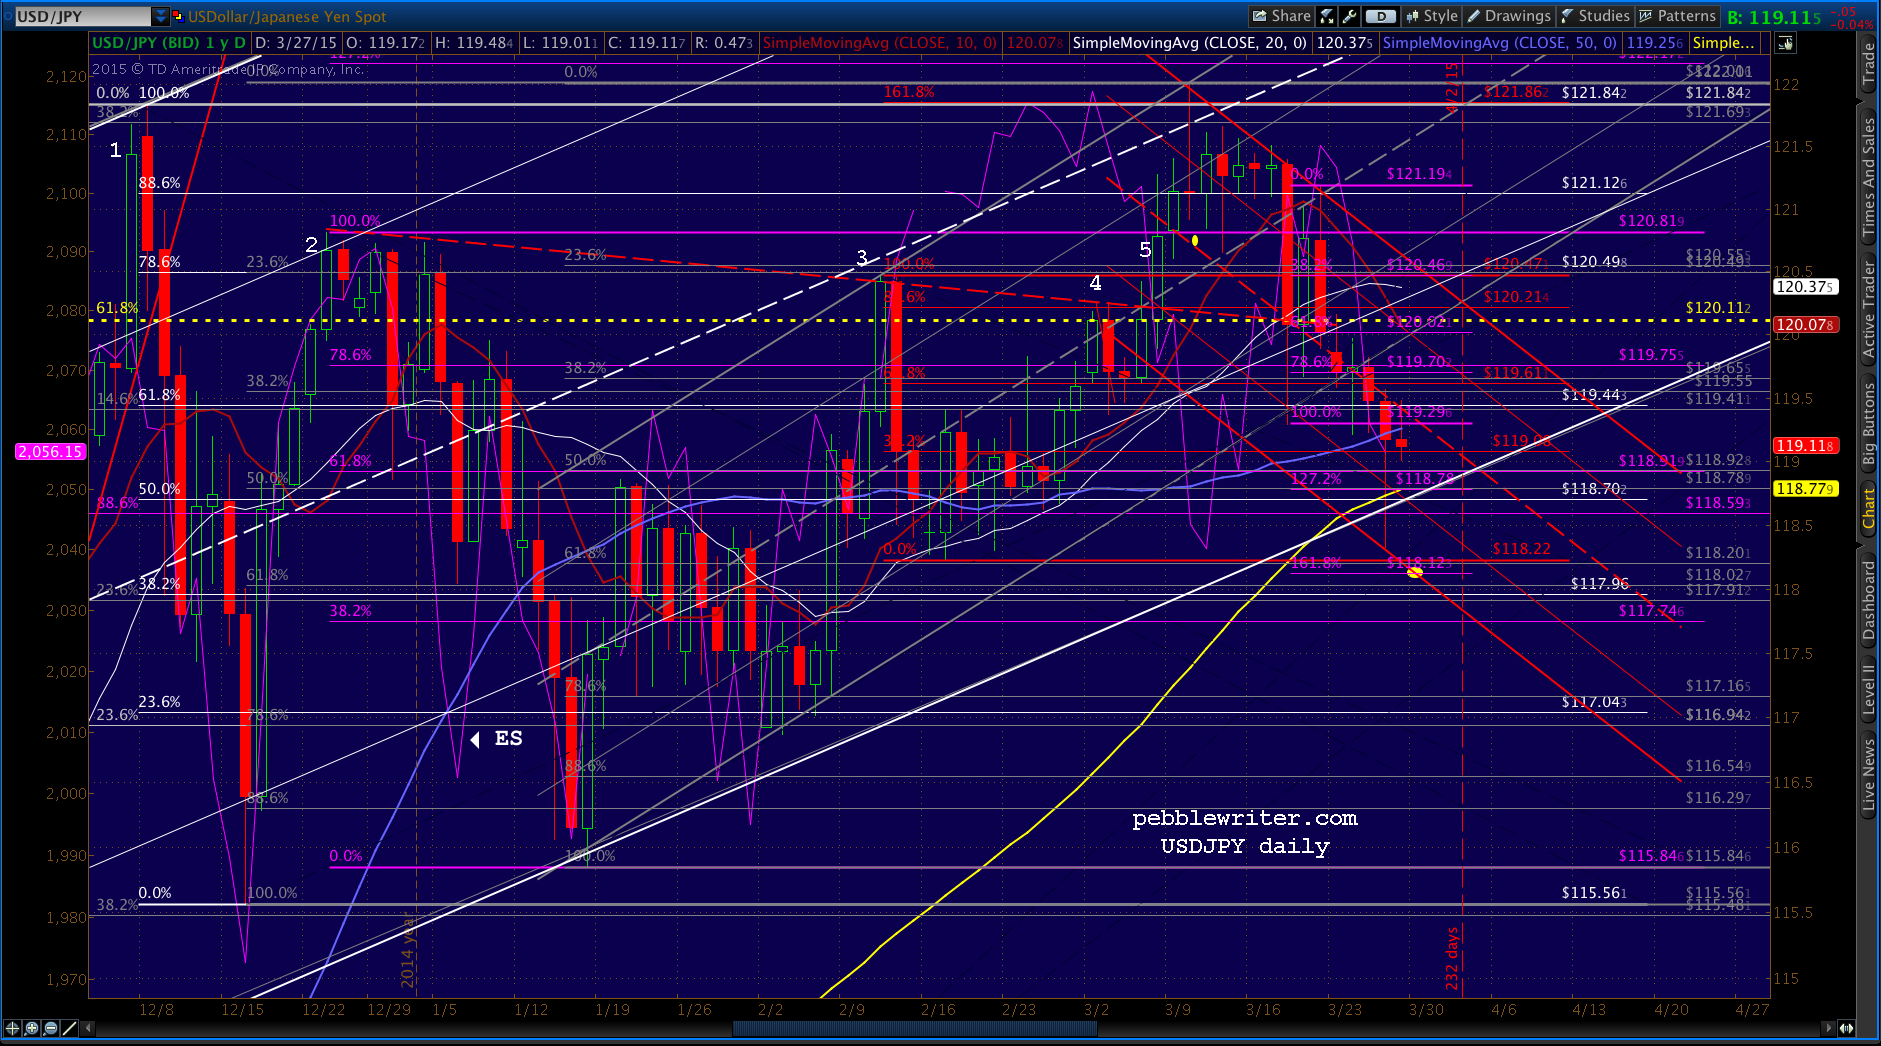
SPX held our initial downside target of 2048.26 yesterday. But, as we detailed in the members’ section of The Middle East Heats Up, the trend should continue lower. CL helped overnight by backing off the .786 Fib line as well as the purple channel midline. And, USDJPY, while it rebounded strongly off an important channel bottom, isn’t done with its decline.
But, our most important charting yesterday involved moving averages. Several were tagged yesterday, which led me to discover an analog that, should it play out in the coming days, could lead to some significant downside.
It was the discovery of an analog that allowed me to accurately forecast the 22% correction between July and October 2011 to the very day and dollar [see: Why do Analogs Work?] So, analogs are always interesting to me.
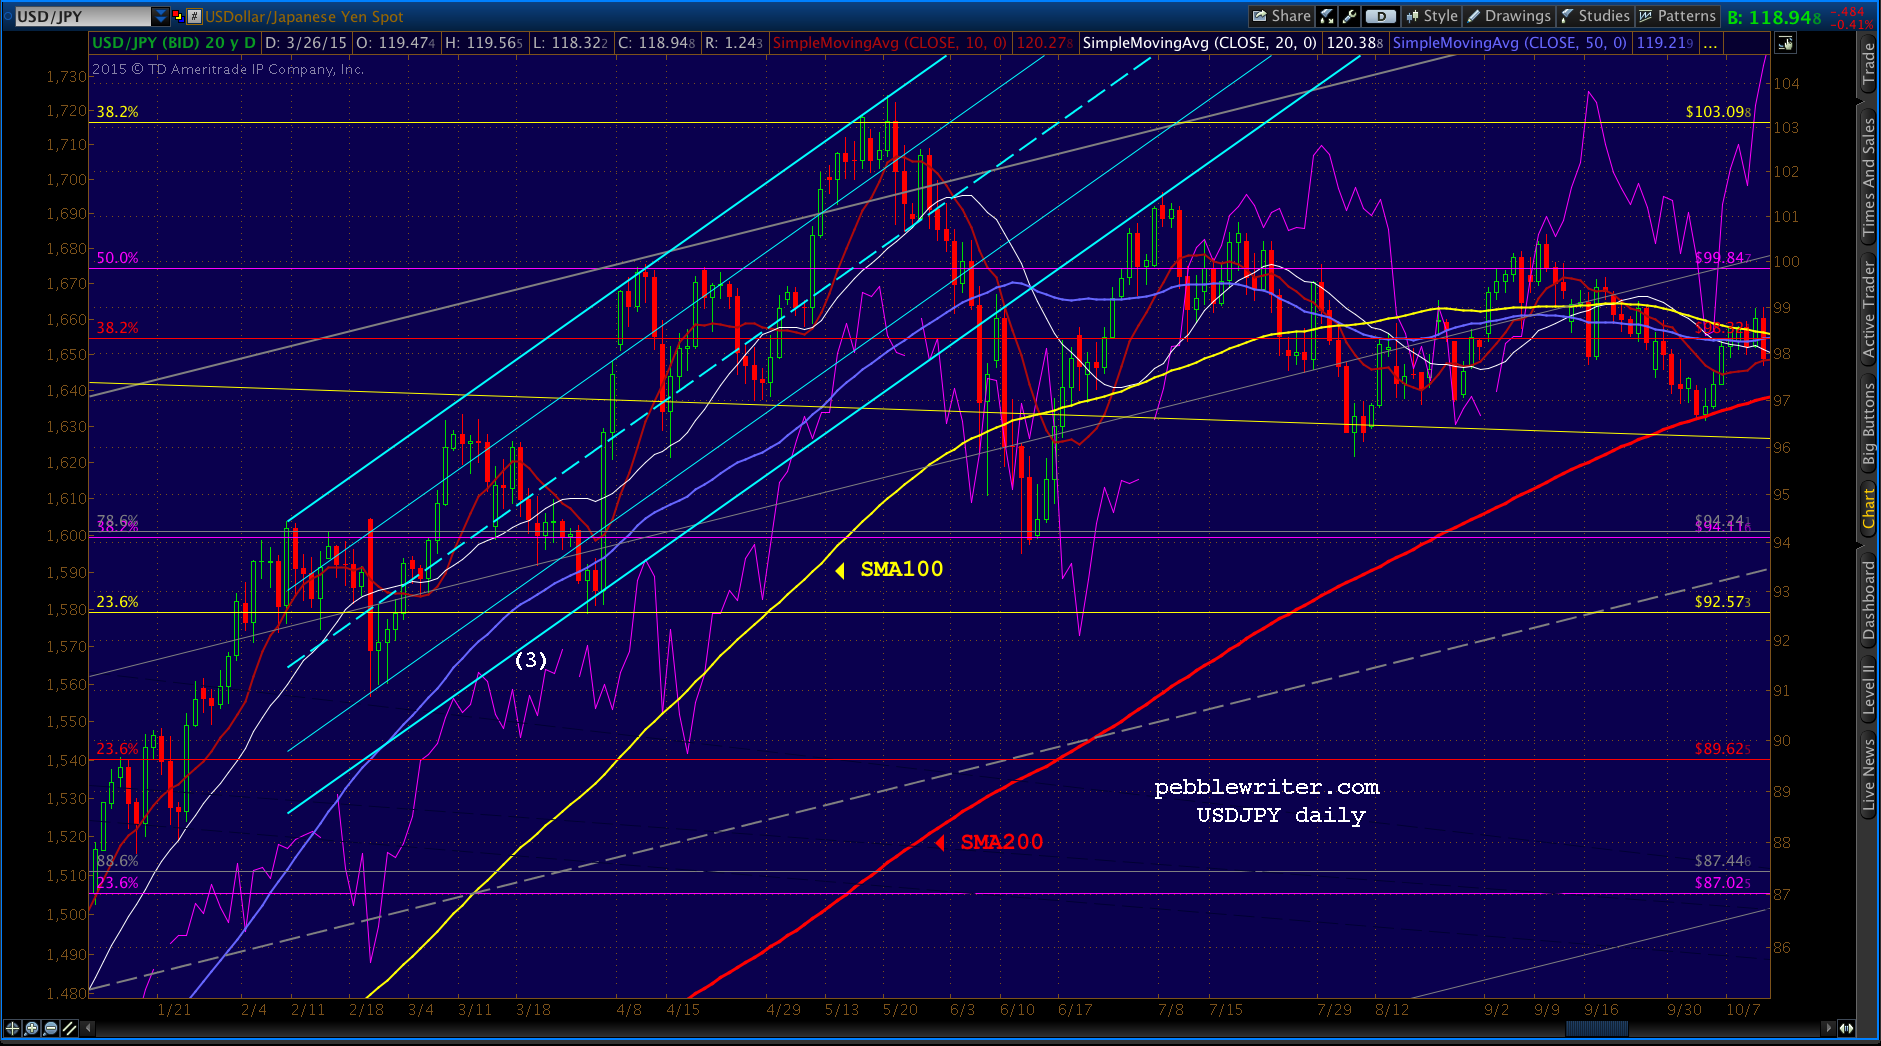
First, both SPX and ES closed below their 100-day moving averages (SMA100.)
 And, USDJPY tagged its SMA100 for the first time in over seven months.
 Which led me to discover some very interesting coincidences. As long-time readers know, I don’t believe in coincidences.
continued for members…
We noted above that USDJPY tagged its SMA100 yesterday for the first time in over seven months. In fact, it has been 227 days since USDJPY last closed above both its SMA100 and SMA200 on Aug 12, 2014.
The previous stretch, from Oct 22, 2012 to Jun 6, 2013, was also 227 days. Did I happen to mention I don’t believe in coincidences? It closed below its SMA100 five days later.
The equivalent for the current time frame would be Apr 1 (coincidentally, April Fool’s Day in the States.)
Back to the 2012-13 timeframe: USDJPY first closed at or below (at) its SMA200 again on Oct 23, 2013 a total of 366 days (≈1 year) from Oct 22, 2012.
The equivalent this time around would be Aug 13, 2015. Though, I should mention that there was a Oct 8, 2013 tag (but, no close below) back then that would equate to July 29, 2015.
 According to my calculations, USDJPY’s SMA200 — which is currently at 111.91 — should arrive in the vicinity of the critical yellow .618 at 120.11 around the end of July. Wouldn’t it be interesting if it happened just in time for USDJPY to make its next move? What would that mean for stocks? Naturally, I looked back to see what happened last time.
All Dressed Up and No Place to Go
In September of 2012, SPX had just tagged a major 88.6% Fib (of the 1576 – 666 crash) and had started dropping. The decline surprised many, as it was the very next day after the Fed announced QE3. Thanks to the completion of a very large Bat Pattern, it didn’t surprise us [see: The World According to Ben.]

The long-term picture had already been looking downright bearish. Combined with the completion of the Bat Pattern, the stage was set for a meaningful decline a la 1974. I spent several days and shredded a considerable number of gray cells in comparing the then current situation with similar crash setups of the 30’s, the 70’s and 1987 [a must-see for hard-core chart geeks: What a Wonderful World.]

But, the 22% correction in 2011 had me wondering whether SPX wasn’t instead aiming for a Butterfly or Crab Pattern completion at 1823 or 2138 respectively. This could imply a more modest reversal from the September 2014 highs.
The channel picture was compelling. When it reversed at the .886, SPX dropped through the gray channel midline — breaking a trendline (red, below) from the Oct 2011 lows and another (purple) from the Jun 2012 lows.
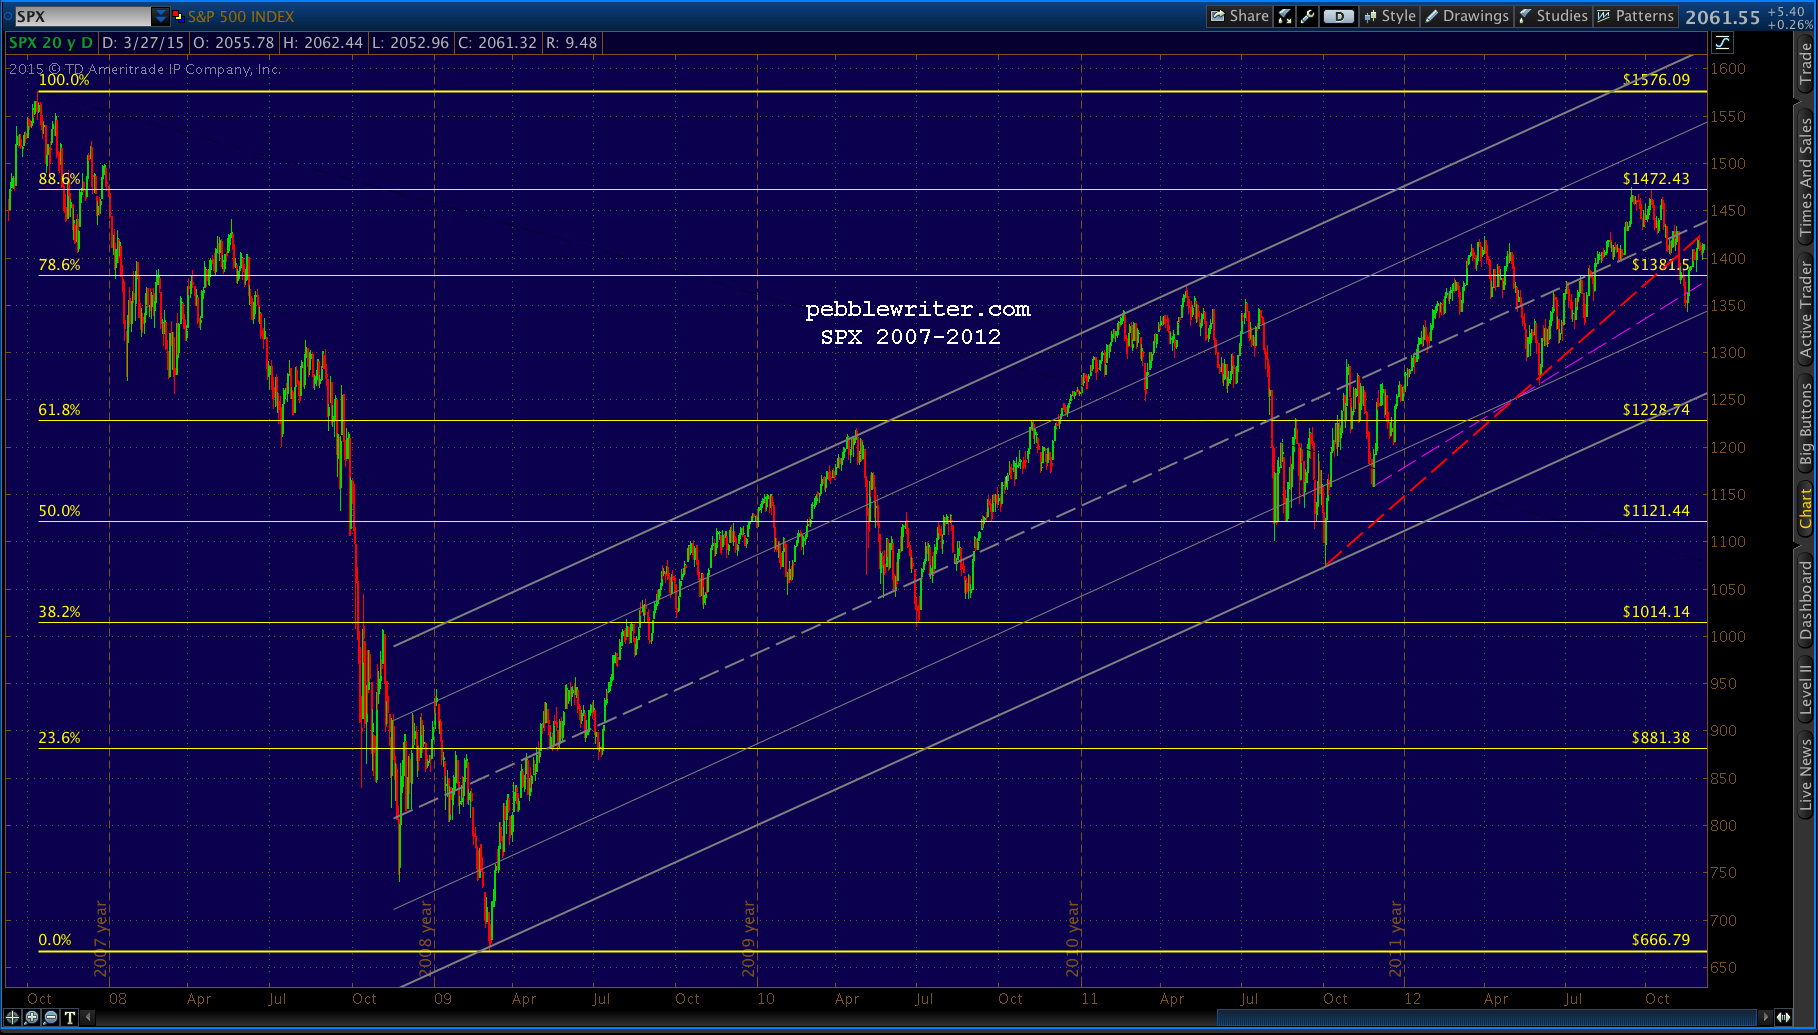 More importantly, it had plunged right through the .786 at 1381 — a very significant top (led to that 22% correction.) If SPX kept on going, the entire climb from 666 could be construed as a corrective wave following the initial plunge from 1576 to 666. In other words, another crash to below 666 was a distinct possibility.
At the very least, SPX looked likely to decline to the .236 line or bottom of the rising gray channel. From a Fibonacci standpoint, the .618 at 1228 was a strong candidate. But, there were only six weeks left in 2012, and that would have left the S&P500 with a loss for the year (SPX began the year at 1257.)
USDJPY Saves the World!
Back in 2012, I wasn’t paying much attention to the yen. The Bank of Japan had revved up its QE machine, propping up their markets. But, aside from that, I hadn’t noticed just how intertwined the USDJPY and SPX had already become.
The chart below shows just a few of the times when USDJPY’s price action greatly impacted SPX’s — in both positive and negative ways — by completing patterns, breaking down, breaking out, etc.
When the Bank of Japan increased QE on October 27, 2011, it wasn’t by all that much. The much more important event was that they put a ceiling on the yen. This translates, of course, into putting a floor under USDJPY — which had already dropped nearly 50% from its 2007 peak.
It was poised to drop much further, particularly following the Fukushima earthquake and nuclear disaster which sent Japanese risk assets flooding back into the yen (silly as it seems now, as a “safe haven.”)
In fact, on Aug 1, 2011 — when USDJPY dropped below the Mar 17 “Fukushima low” — SPX plunged through its SMA200 and didn’t stop until it had lost 206 points (-15%) six sessions later.
Coincidence? I think not. Thanks to the yen carry trade, the correlation between USDJPY and SPX was strong, and was growing stronger.
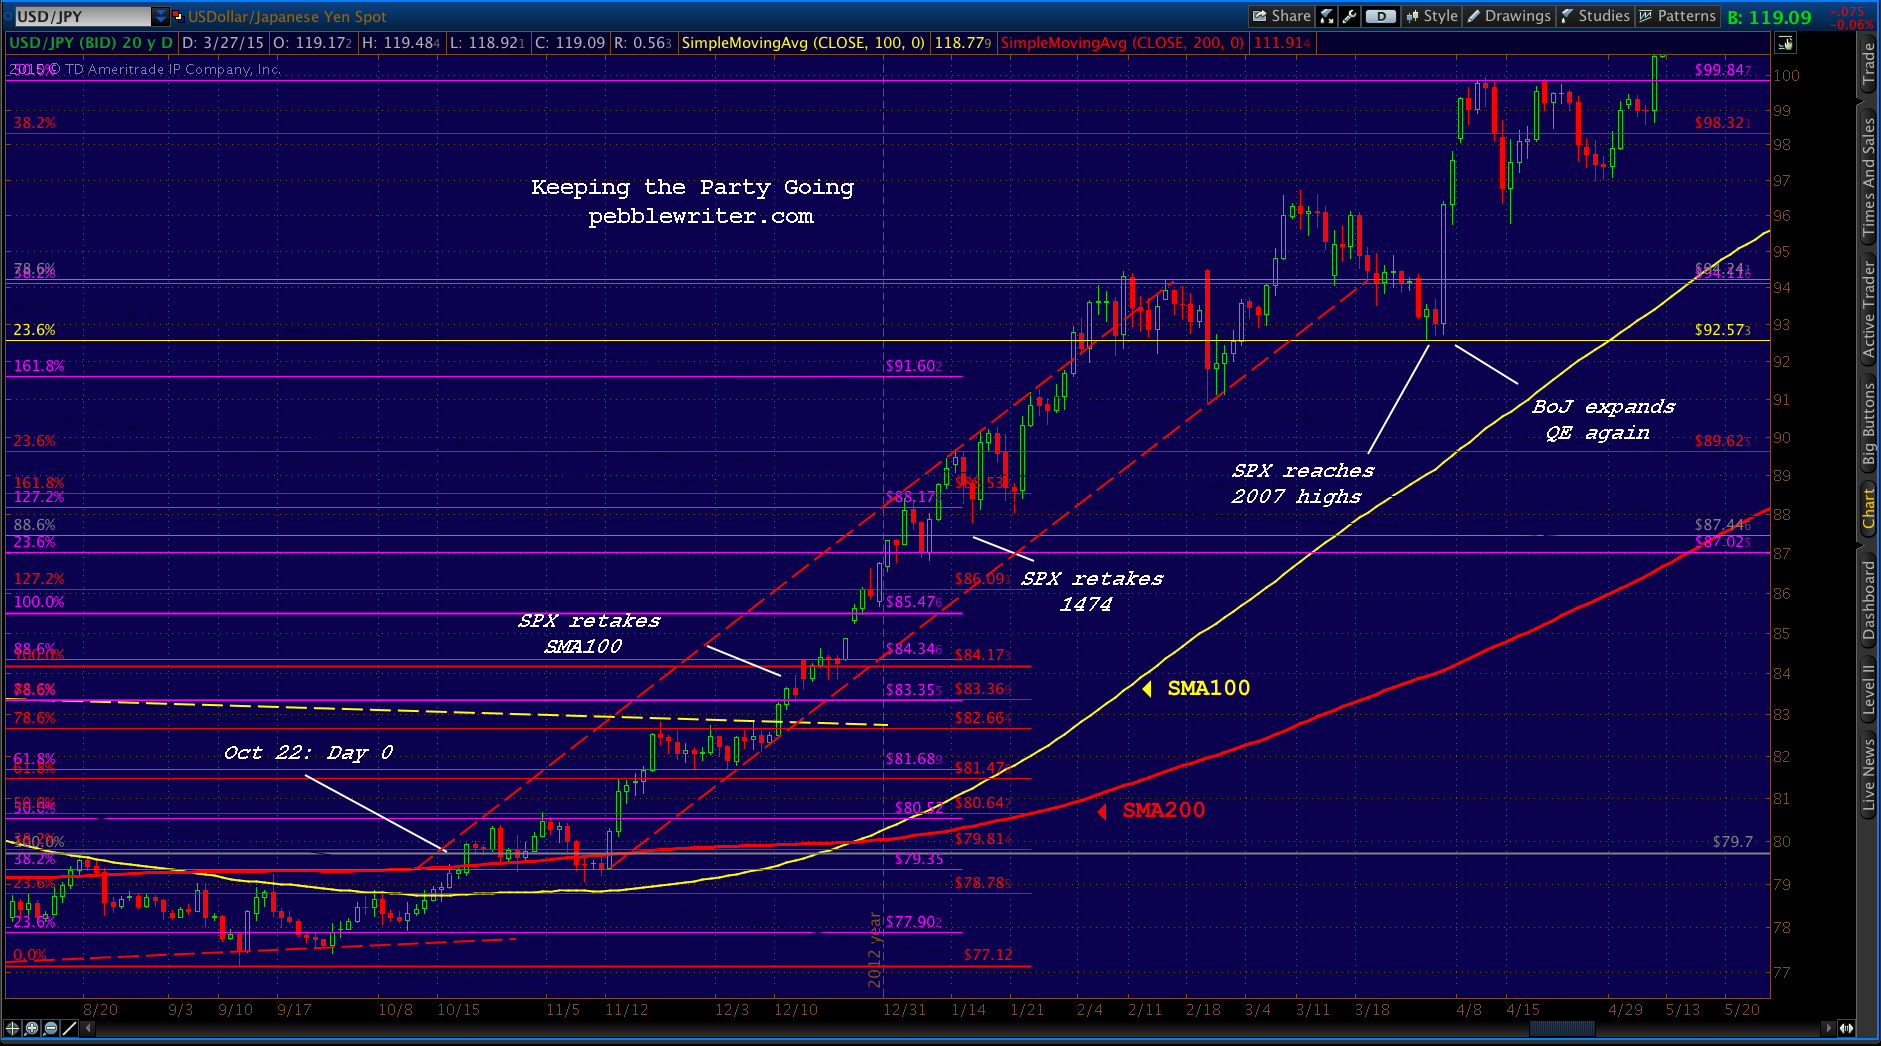
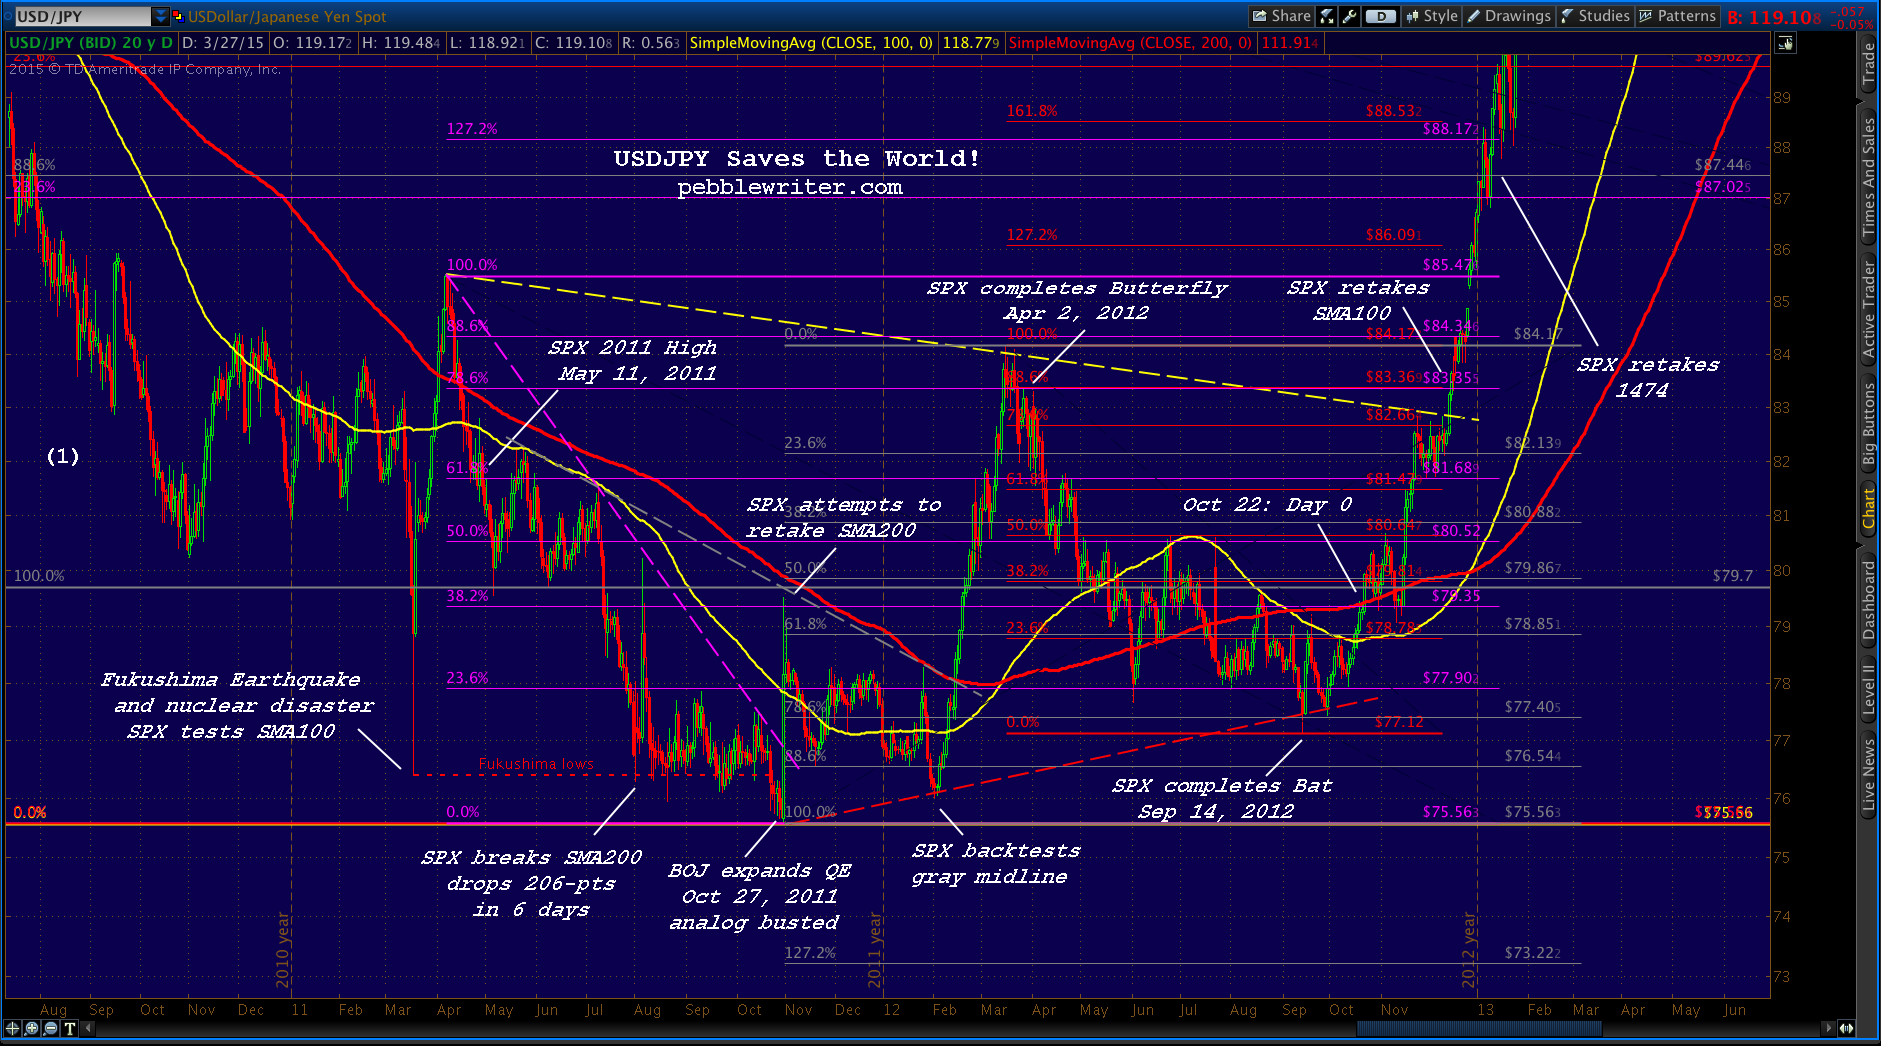 It took over 19 months post-Fukushima for USDJPY to leave the doldrums for good, breaking above the SMA100 and SMA200 on October 22, 2012. Why did they pick that day? Why was it so important that it break out then?
Keeping the Party Going
This brings us full circle to the SPX charts up above. Remember, SPX had just completed that Bat Pattern, and had fallen through the midline of the channel that had brought it all the way from 666 to 1474 — a stunning 121% return.
Wall Street needed this recovery. They weren’t going to give it back without a fight. They desperately needed a way to keep the party going.
USDJPY’s Oct 22 breakout served as the start of a steep channel that would allow SPX to bottom three weeks later at 1343 rather than 1228 or somewhere much, much lower.
From then on, every time SPX faltered — be it retaking or backtesting an important moving average, breaking through the .886 at 1474, or ultimately topping the 1576 high from 2007 — USDJPY was there to provide a critical assist.
This last effort came after USDJPY ran out of steam and broke below the red channel it had constructed from Oct 22. USDJPY had slammed into the Fibonacci 38.2% retracement (94.11) of its drop from 124.13 in 2007 to its low of 75.56 on Oct 31, 2011 (in purple below.)
 It was a natural place for a breather; but, it couldn’t have come at a worse time for SPX. Having finally regained all of its losses from the financial crisis, the last thing Wall Street needed was a significant reversal — the dreaded double-top — at 1576. What to do?
As luck would have it, the Bank of Japan announced another expansion of QE only two days later. How about that for a coincidence?
For Part II: CLICK HERE