Author: pebblewriter

  • Opening Up the Country

     President Trump says he wants the country “opened up and just raring to go by Easter” — about 2 1/2 weeks from now.  Some business leaders and titans of finance are publicly agreeing.

    Hopefully, this is nothing more than the latest ploy to goose the markets higher. The alternative is that he really plans on doing it, which would subject the country to scores of additional, needless deaths.

    And, it’s not only the elderly or those with serious underlying conditions. Read this account of a 26-year old currently in the hospital or this one by a woman taking care of her critically ill 56-year old previously healthy husband.  Think of the people you know who are immuno-compromised due to heart disease, lupus, cancer or diabetes. Imagine being pregnant, facing the prospect of delivering in a hospital already swamped by COVID-19 patients.

    We have seen so many government missteps over the past several months. But, this would be one of the worst. Even leaving parts of the country not under lockdown has been a colossal mistake, as those with the means simply leave the locked-down hot zones and head for those areas less affected.

    We saw this in Italy, when the northern part of the country was shuttered. Within a matter of days, many people made their way to Southern Italy, Switzerland, France, etc.  The same thing has happened and will continue to happen in the US. Locking down New York was smart, but many had already headed to states not locked down – seeding spikes in cases in those states as well.

    The number of cases in the US is increasing sharply. But, since test kits are still widely unavailable, that number continues to be meaningless. Look, instead at deaths – which increased 41% between Mar 23 and Mar 24 and have averaged a 30.2% daily growth rate over the past 10 days.   At 30% per day, the number of deaths reached yesterday (780) will reach 1,000 today. It would reach 10,000 by April 3, 100,000 by April 12 (the day Trump wants the country to be open again) and 1 million by April 21.  At 41%, we would reach 1 million dead by April 14.

    This is not about politics. This is about human lives. It’s time for our leaders to start recognizing it as such and make responsible decisions. A week ago, the President said, “Nobody knew there would be a pandemic or epidemic of this proportion.” He has made countless such comments that are equally ridiculous.

    I’m a guy doing his own research, with no medical training or insider knowledge, and I started writing about this months ago. By simply paying attention to publicly available data, I knew enough to sound the alarm on Feb 24….

    Even though the US has relatively few cases, it’s only a matter of time before the coronavirus affects every single person in the US. My projections indicate we’ll see over 500 deaths within the next month. How many businesses will remain open?

    …even as President Trump was actively playing down the threat – seemingly prioritizing market gains.

    Why are we just now ramping up PPE and ventilator manufacturing and imposing lockdowns – a neat euphemism for quarantines?  What could possibly justify the delay? How many must die before our elected officials take this seriously?

     *  *  *

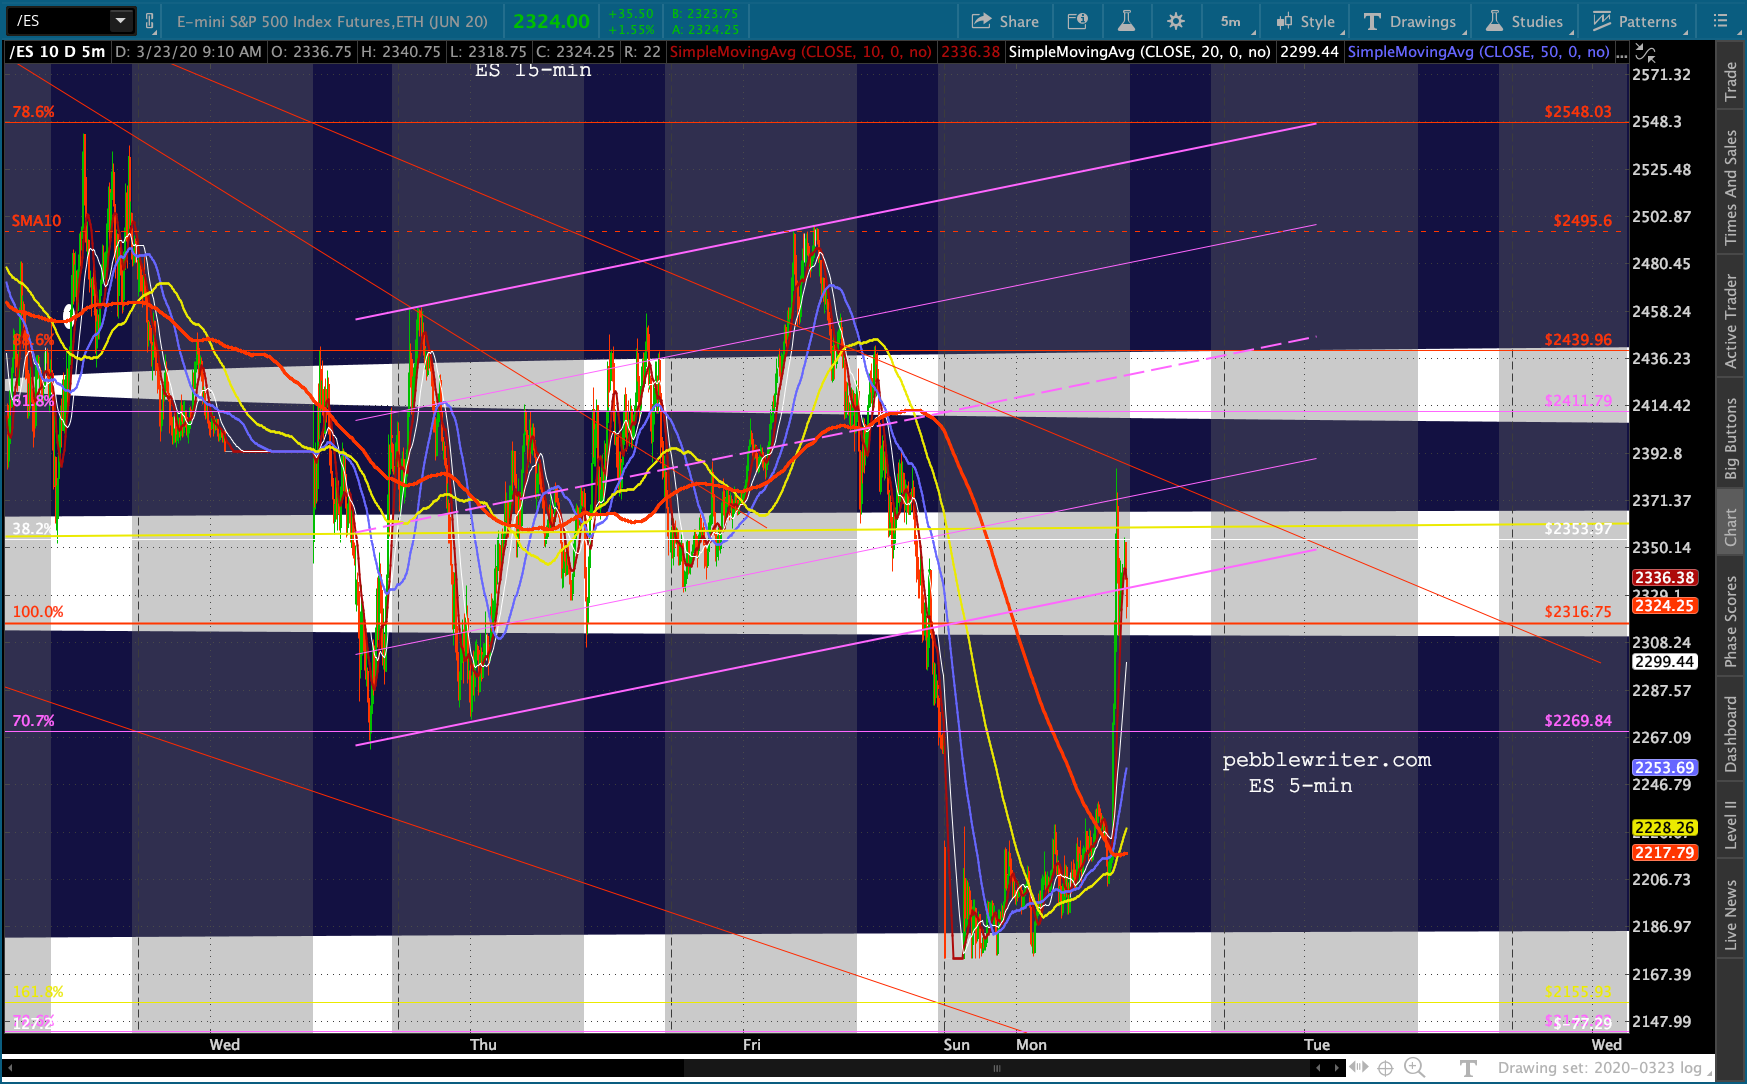
    Futures have been all over the map following yesterday’s algo-driven short-covering extravaganza. But, the initial objective was achieved: SPX and ES both broke above the trend line in place since the February highs. As has been the case after each of these Tuesday spikes, the big question is whether the gains can hold.

    continued for members(more…)

  • Italy: All Better?

    First, let me address the comments in the news this morning that Italy has turned the corner on COVID-19. The number of new cases and deaths has fallen the last two days, which is to be expected with the tightening of quarantining standards.

    While this is encouraging, it’s important to note that we’ve seen daily dips before – both in total cases and deaths.  From our COVID-19 post, pinned at the front page of this website.

    It’s also important to note that Italy is far ahead of the US in terms of outcomes – with closed cases representing 21% of the totals and deaths 44% of closed cases.

    In the US, closed cases are only 2% of the total, and 3/4 of those resulted in death.

    And, Italy’s mortality rate continues to tick higher. It recently topped 9% of total cases and should reach 10% by the end of today.Even if Italy has turned the corner, it remains at least 10-14 days ahead of the US – possibly much more. It it way too early to talk about the US doing the same, especially since still have no ability to test those who should be tested. It is therefore much to early to talk about ending social isolation. Things are going to continue to get much worse.

    The daily rate of growth in deaths fell from 39% on Sunday to 32% on Monday. But, this is one single data point — not a trend. The 10-day moving average is nearly 28% and rising – up from 18% a week ago.

    At 39%, we’d reach 1,000 deaths tomorrow, 10,000 on April 1, and 100,000 on April 8.  At 32%, we’d reach 1,000 deaths on Thursday, 10,000 on April 3, and 100,000 on April 11. Neither is exactly good news and neither argues for removing the quarantining which is our best chance for flattening the curve.

    Meanwhile, we’ve had another algo-driven overnight ramp to the same trend line which has marked previous bounce tops for the past several weeks.This one was aided by the Italy comments as well as a well-timed hammering of VIX as futures backed off their limit.

    The primary goal remains to get DJIA back above 18,974 – the 1.618 Fib the Dow broke through post the 2016 election. As we discussed last week, this remains the score card that matters the most.

    continued for members(more…)

  • FOMC Embraces MMT

    The FOMC is officially in the short-squeeze business. After futures came within 19 points (trading was halted there) of our next downside target – ES’ 1.618 Fib extension at 2155 – the Fed unleashed QEinfinity.  In other words, they’re prepared to spend whatever it takes to keep stocks from melting down any further.

    With the Dow set to test the Nov 8, 2016 (election day) lows, we can assume the White House is vigorously egging the Fed on (if not threatening them with bodily harm.)

    Consider VIX (hammered by 20%) and the 10Y (cratered from Friday’s high of 1.265% to a low of 0.711%, crushing the 2s10s as low as 41 bps.) This is an all-hands-on-deck emergency, and they’re throwing everything they’ve got at it.

    After all that, ES spiked 212 points, and is knocking on the door of a breakout above the falling TL from Feb 19.  Will it be enough?  And, if “everything they’ve got” isn’t enough, what then?  Full-on BoJ-style equity/ETF purchases? With very desperate doves clearly in control, I wouldn’t be surprised.continued for members

    The big picture for ES and SPX:

    Remember, ES and SPX’s 1.618 Fibs are very different. While ES is at 2155, SPX is way down at 2138 – 7.2% below Friday’s close and 6.8% below its low.

    If ES can’t top this little red TL, the Fed’s efforts are for naught. It’s moving fast, but the 2s10s is still not back below breakout status. Both the 10Y and the 2Y are trying to find some equilibrium – with more volatility than I can remember.The white TL is at about 48 bps.

    Though VIX has been knocked below its SMA10, it is bouncing off its lows. This is concerning, because CL and RB still aren’t bouncing much at all… …and, USDJPY’s response has been lackluster: no new highs yet. UPDATE:  9:47 AM

    That certainly fell apart quickly. Important line in the sand here for ES… …while DJIA is dipping below the important 1.618 Fib at 18974 and – more importantly – is testing its post-2016 election lows. Anyone questioning the administration’s determination to preserve and protect its post-election gains hasn’t been paying attention.It will be important to keep VIX below its SMA10.

     *  *  *

    I had a request for a Bitcoin chart which I will take a stab at. First, some disclaimers: I don’t follow BTC; I suspect BTC is heavily manipulated; and, I wouldn’t put more than a small, speculative percentage of my investments in BTC. With that said, I’m sure some of you would be interested in what the charts indicate.

    Two major chart patterns jump out at me: first, the obvious triangle pattern on the weekly arithmetic chart (it isn’t there on the log chart) suggests BTC should bounce from here and return to the top trend line (which failed, BTW, to hold a recent tiny breakout.) It currently stands around 9,925.Second, the daily log chart shows a TL was broken last week but BTC has since rebounded back above it.  For those wondering, the retracement of the rise from the Dec 2018 lows to the Jun 2019 highs reached about 81%. Had the TL held, we’d be looking at a Fibonacci 78%.

    If you believe that BTC will necessarily rise (as gold will) as QE explodes, the charts support a continuing bounce. If you believe the FOMC will do whatever it takes to support the USD and crush surrogates such as BTC and GC, then keep an eye on that TL (5,000ish) as a fairly clear stop level.

    UPDATE:  4:00 PM

    Probably not the outcome the Fed was hoping for…  SPX closed down nearly 3% (4.4% above 2138) and ES is struggling to close above a 4% loss.

    USDJPY actually lost a little ground……while CL held its red TL… …and RB gave up a stunning 15% on the day.DJIA is closing below its 1.618 but, not surprisingly, the 2016 election price level has held… …and, no surprise, VIX is actually off for the day.While the lack of a congressional deal no doubt played a role in today’s weakness, what does the 3-4% drop say about the Fed’s action? What might they roll out 30 minutes before the open tomorrow that would prevent a drop below 2138?  Direct stock purchases by the FOMC?

    Having seen this many times before, we know the drill.  Get SPX back above its SMA10 (currently 2559) and hold it there until the SMA20 catches down, then gap it up over both of them in conjunction with the 10/20 cross.  Next thing you know, new highs!

    Stay tuned.


    (more…)

  • Time to Buy?

    The Dow serves as a pretty good barometer of the seriousness with which our political leaders have treated the COVID-19 crisis.  As it has approached the 2016 election levels, there has been a discernible shift in the tone of comments and measures undertaken by the president, congress and the Fed.  Here are just a few comments/actions which have come out of the White House and Fed over the past month.As DJI tagged our 18974 target, we started looking for a bounce. We’ve seen the early stages of one forming, especially in ES. We’ve even seen some managers brazenly declare that this is a real buying opportunity. But, we’ve been down this road before.  Can the bounce last?

    continued for members(more…)

  • Currencies to the Rescue

    In response to increased demand, we are renewing our membership promotion through the end of the week: the first month of an auto-renew Monthly Subscription at only $99 and the first quarterly of an auto-renew Quarterly Subscription at only $299. To sign up, CLICK HERE. Note that we no longer offer Annual Subscriptions unless you are a returning annual subscriber. In that case, please contact us for details on how to resume your subscription.

     * * *

    Yesterday’s meltdown was partially mitigated by oil and gas bouncing at our downside targets……but primarily by the strong moves in USDJPY and EURUSD which allowed an 8% spike in DXY.Now that USDJPY is back to an important overhead resistance, EURUSD is testing a channel bottom from 2000 and SPX/ES are weighing whether to maintain the channel from 2009, what can we expect from currency pairs?

    continued for members(more…)

  • Update on DJIA: Mar 18, 2020

    In our last dedicated update on the Dow [see: July 2019 Update], we noted the intersection of a number of overhead resistance features in its chart and offered some thoughts on its downside potential if it managed to reverse.

    Note that our 18974 target represents a backtest of the red channel from which DJIA broke out and backtested between 2014-2016 as well as the white 1.618. A May 2020 bottom at 18974ish would align nicely with the SPX 2138 target indicated by our analog.

    I posted my charts on July 29 (the yellow arrow) and was roundly cheered when he Dow cratered 7% over the next two weeks, even closing below its 200-DMA……and was loudly jeered when it made that up and went on to new all-time highs. I’ve seen this sort of thing so often from the Dow that I was pretty hot under the collar. I’m pretty sure an older (yes, there are a few) wiser colleague took me aside and muttered “Forget it, Pebble, it’s the Dow.”

    So, I did. You see, when it comes to manipulation the Dow is the all-time champ: share price weighted, with the ability to kick out losers and slide in winners whenever you like? How is this even an index?

    When the market reversed on cue in mid-February [see: A New Day, Same Old Nonsense]  I don’t think I even checked to see where the Dow was (the blue arrow below.) I’ll admit I got curious when it closed below its 200-DMA on Feb 25. But, I didn’t inhale. I stayed focused on real indices, cratering oil prices and the bond market.Well…guess where it landed today?  Go ahead.  I’ll wait.

    You guessed it. Right where our July 2019 forecast said: the bottom of the falling red channel where it intersected with the top of the rising red channel and the 1.618 Fib extension at 18974. It’s a 33% drop from stem to stern. You can’t make this stuff up.

    Knowing we have a global pandemic on our hands and a minimum of a quarter of negative GDP ahead of us, surely it’ll keep going, right?  I mean, did you hear Bill Ackman today?  Hell is coming!  So, the Dow is positioned for a bounce.  That’s right.  IF oil and gas can continue bouncing, and IF USDJPY can pop up through its SMA200 and IF VIX breaks down and IF the 2s10s craters back below 48 bps, then DJIA will definitely probably bounce.  At least a little.

    continued for members(more…)

  • The Big Bang Theory

    One of the more compelling relationships I recognized over the years is what I have dubbed our Yield Curve Model. Simply stated, it pointed out that every time the 2s10s broke down below significant support, stocks would suffer. But, the bigger disasters – think 2000-2003 and 2007-2009 – occurred when the 2s10s broke out after inverting.

    We got our latest inversion last August after a series of breakdowns and minor breakouts, each of which visited downturns on the major averages.  The biggest breakout, however, occurred yesterday, when 2s10s soared as high as 73 bps. It has since settled lower, but remains broken out — a signal that we might very well be headed for a GFC style crash.

    continued for members(more…)

  • Saved by the Bell

    Futures have been all over the map since yesterday’s meltdown with a 198-pt swing in ES since it tagged our .382 Fib target.

    As we’ve discussed, this was important support and allowed SPX/ES to bounce prior to dipping below Dec 2018’s lows.

    Overnight, we’ve seen minor bounces in oil and USDJPY, which has encouraged the algos.  The CB efforts continue to focus on supporting DXY and suppressing VIX, which came within a breath of its 2008 highs after slightly topping our 80.30 target.The big picture log and arith charts for SPX and ES all agree: any lower would trash the trends which have been in place since 2009.

    continued for members(more…)

  • What’s Next?

    The futures are lock limit down again this morning, with ETFs trading in the after-hours indicating losses on the (eventual) open of up to 10%. This is probably not what the Fed had in mind when they unleashed the massive, emergency rate cut and $700 billion in new QE an hour before the futures opened on Sunday.

    As before, the factors are all aligned bearishly, with the bond market failing to swing back to a bullish alignment yet despite the Fed’s desperation move. There are, however, some glimmers of hope.

    continued for members(more…)

  • Just Two Charts

    Two charts best define the day we had yesterday.

    First, VIX tagged our next highest target: the intersection of the .786 Fibonacci retracement and the trend line connecting two previous highs.

    The other one was the SPX arithmetic (as opposed to log) chart, which stopped on a dime at the channel bottom.The bleeding continued well past the Fed’s ineffectual $1.5 trillion injection and had to wait until the low-volume aftermarket to be staunched. At that point, central bankers went to work – pumping oil and gas, the dollar, interest rates and currencies in order to restore confidence whip up the algos. It worked…at least so far.

    I’ll have a separate post up later regarding COVID-19, including my latest projections for the US.

    continued for members(more…)