

Futures have been all over the map since yesterday’s meltdown with a 198-pt swing in ES since it tagged our .382 Fib target.
 As we’ve discussed, this was important support and allowed SPX/ES to bounce prior to dipping below Dec 2018’s lows.
Overnight, we’ve seen minor bounces in oil and USDJPY, which has encouraged the algos. The CB efforts continue to focus on supporting DXY and suppressing VIX, which came within a breath of its 2008 highs after slightly topping our 80.30 target. The big picture log and arith charts for SPX and ES all agree: any lower would trash the trends which have been in place since 2009.
continued for members…
First, the arith charts…

 …and the log:

 SPX actually closed slightly below channel bottom and Fib support, but will rebound on the open.
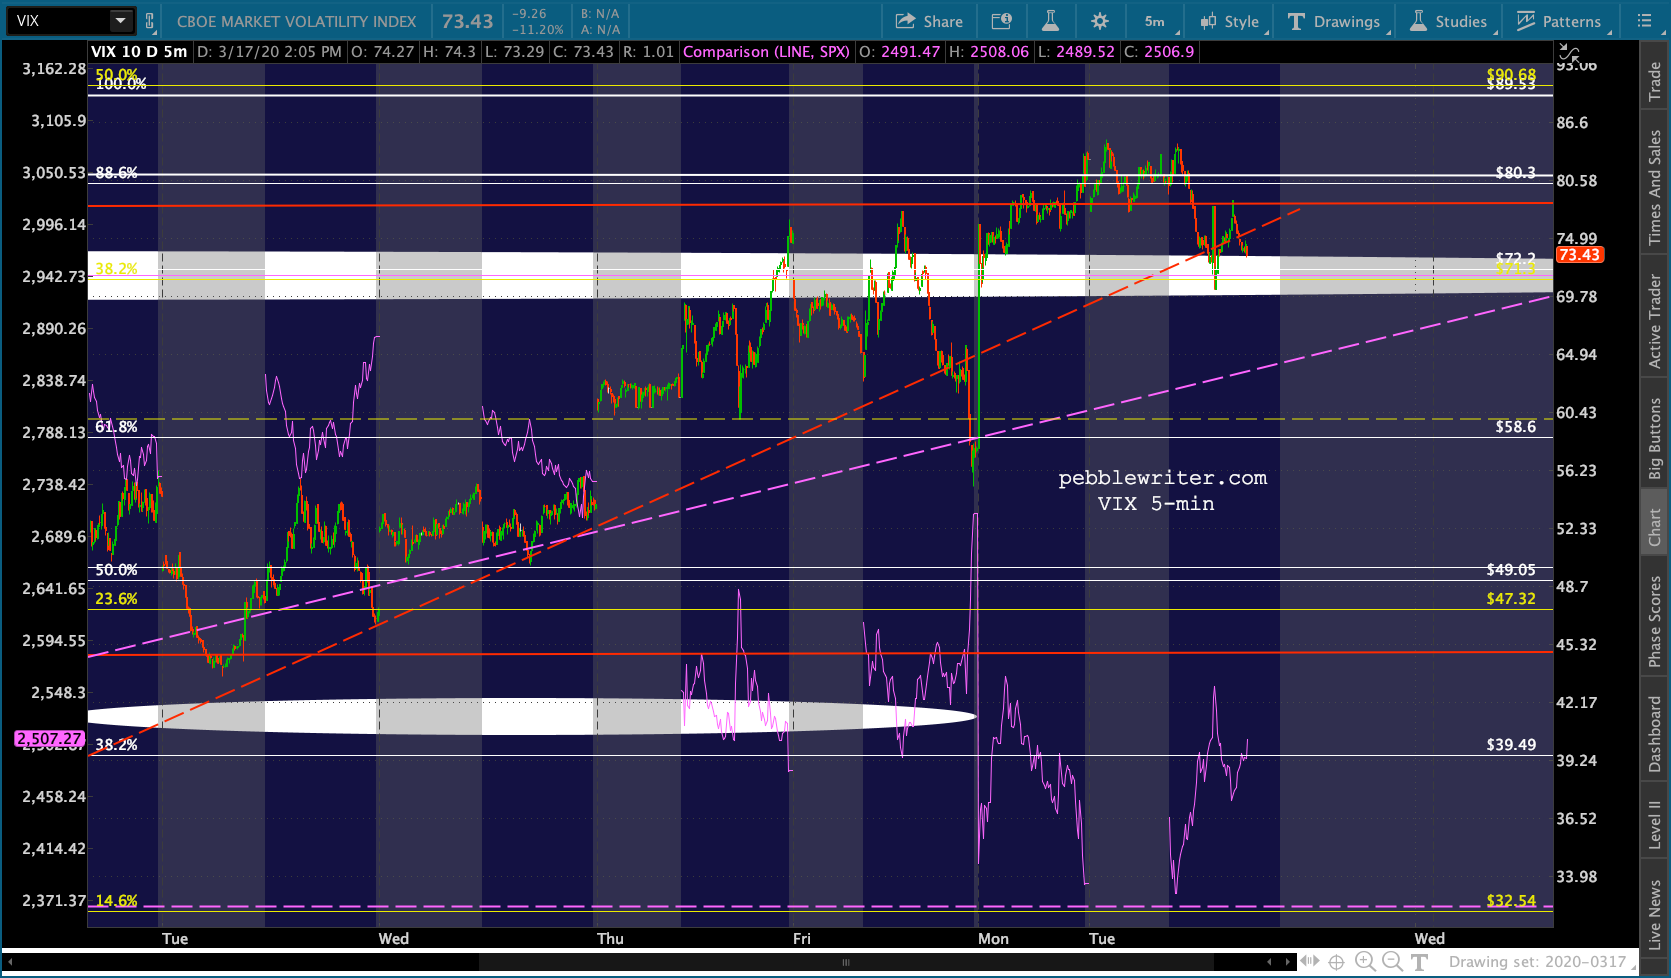
 VIX’s picture is key. If it tops the 2008 highs, stocks’ losses will likely accelerate.
 Keep an eye on the purple TL.
 The currency picture remains unchanged: the DXY continues to melt up mostly on the back of the EURUSD which has finally dropped through its SMA200. Don’t be surprised if we see new highs on DXY.
 USDJPY continues to backtest the broken small white channel and .236 line of the much bigger white channel. If the USDJPY gets nervous enough, the tendency of USDJPY to crash to the 98.997 target will be obliterated by the BoJ and we’ll see new highs.
 Gold continues to hold on to the channel midline and SMA200 – but just barely. It is clearly a victim of the rising DXY as well as being available funds for margin calls.
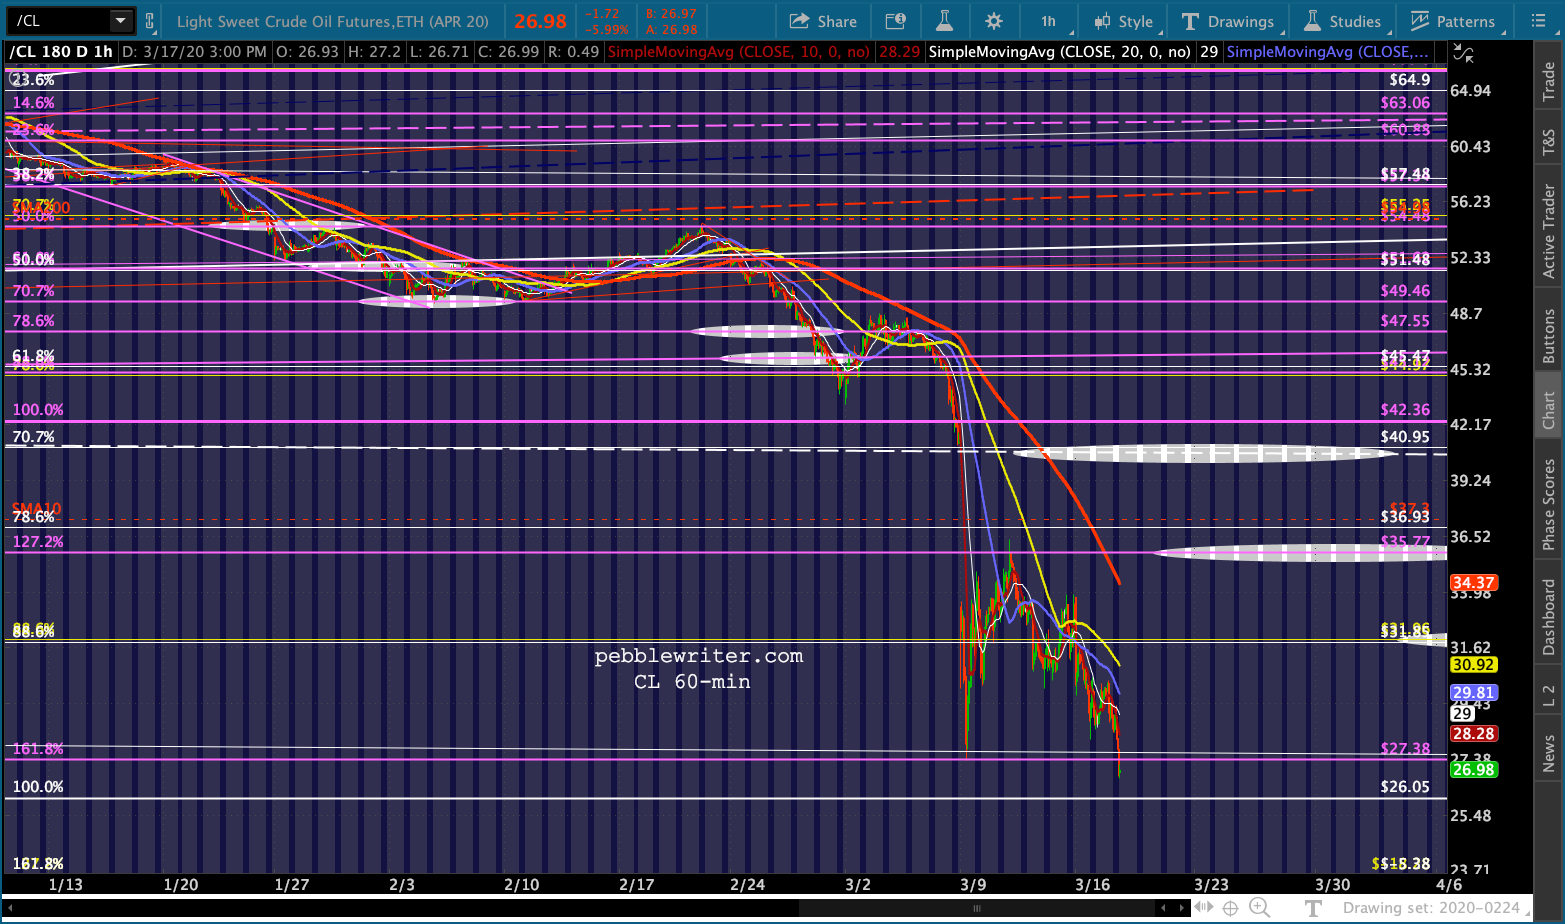
 Oil has seen a floor put in at 28ish.
  This is because they’re trying to hold the .2365 channel line shown on the wkly chart – not to mention the 2016 lows.
 Gas continues to melt down, and why not? The lower a CPI reaching we get, the more cover the Fed has for taking extraordinary actions. Plus, it’s a cheap way of offering financial aid to the most needy who are most impacted by food and gas prices. If Congress really wanted to hand out free money quickly, they could start by suspending gas taxes on all gas sales.
  The bond market continues to vacillate between bullish and bearish signals. ZN is back below the important 138’200 threshold…
 …but TNX hasn’t pushed above the equally important 8.16 level.
  The 2Y has rebounded back to the 40 bps level…
 …which puts it above the horizontal support from 2010 and safely above the armageddon levels of 2010.

 This has allowed the 2s10s to remain below the danger zone starting at 48 bps.
 This is a good place to pause and discuss a few things, especially for the new subscribers to the site.
Central banks, treasuries and their functionaries are very heavily involved in supporting stocks — it is more clear today than it was when we first started discussing it years ago. Back in 2008, it was QE. Then various forms/iterations of QE. Then the yen carry trade and the USD. Then managing oil/gas prices. Then, hammering VIX. Managing interest rates have always been part of the equation.
Each of these things plays an important role in driving algorithms’ decisions to buy/sell stocks. Think about it this way: if you were going to create a program to decide buy/sell decisions, you’d obviously include whether SPX rose above or dropped below its 200-DMA, right? Today’s algos do, too. They also include hundreds or thousands of other signals, including the ones listed above.
Because 90% of daily volume is driven by algos and the ETFs, index funds, smart beta and other machine-driven vehicles that cue off them, all a central bank needs to do is to, say, drive up the USDJPY above an obvious level of overhead resistance like a moving average, former high, etc. They could also short VIX or ramp oil prices or any other technique which has proven effective.
This always works. Except, and this is a big exception, when carbon-based investors wake up and start freaking out over big changes in the macro picture such as the one we now face with COVID-19.
We just had a very clear example of the way the algos work around 10am, when ES threatened to take out yesterday’s lows and SPX came within 21 points of its Dec 2018 lows.  Someone decided that would be bad for investor confidence (or rather, would trigger the algos to start selling again.) That someone simultaneously bid up oil and USDJPY and shorted VIX. If things start to get too bearish again, it would be a simple process to push USDJPY above yesterday’s 107.181 highs. If that didn’t work, the SMA200 is just overhead at 108.22.
  Note that CL turned up at about the same time…
 …and VIX turned down before making a new high.
  This is all computerized, of course, so the fine-tuning of the market this way is normally very effective – unless the system is overwhelmed by actual people who read the news, assess the risk, and place sell orders. These are people, by the way, who have been very effectively trained over the past 11 years to BTFD. It takes a lot to get most of them bearish enough to trim positions or, heaven forbid, short something.
Things were just starting to shift when I started this website 11 years ago. Fundamentals still mattered. When “bad news is good news” and “BTFD” became investment strategies, that was when markets fundamentally changed. Corporations got on board and started borrowing essentially free money to buy back their shares and increase dividends — many of them the same corporations which are now seeking government bailouts.
Anyways, when you see multiple targets on a chart, it’s intended to illustrate the most likely turning point IF the markets are able to turn. SPX 2465.93 was an important retracement: .886 of the rise from the Dec 2018 lows. Just below it at 2414.97 was the .618 retracement of the rise from the 2016 lows at 1810.10. The Dec 2018 lows at 2346.58 are important horizontal support and are just below the .382 Fib retracement of the rise from 2009 at 2354.24. 
When you see a target straddling two of these support levels, it’s intended to convey the fact that either could serve as a legit target. If you’re trying to buy the dip or decide when to sell, for instance, you’d want to take that into account in thinking about stops, etc.
Personally, I believe in swing trading. I like to pay attention to bigger trends and make sure I’m on the right side of most of them most of the time. The rising channel from 2009 is important and this channel bottom could be a great buying opportunity. But, I believe there’s a good chance it will break down as things become worse with the virus.
So, I have a discreet level at which I’d either cut longs or adopt shorts, and start focusing on the 2138, 1990 and 1823 targets. I would reevaluate at each level in the same way. It’s an if-then approach that usually works pretty well.
The only hitch is that many of these same price targets are also identified by the folks propping up markets. It’s much easier and cheaper – especially when you make money by borrowing at negative interest rates – to manipulate a currency pair than the entire S&P 500. It’s the tail wagging the dog.
So, it’s not unusual to see stocks drop through support levels and then magically recover above them. In other words, it’s easy to get whipsawed. I can’t tell you at exactly what level TPTB will start to panic. But, we usually get them pretty close.
In the time it took me to write all that, I see that USDJPY has pushed above the horizontal resistance at 107.181…  …and VIX has dropped below its .886 Fib…
  …both signals to algos to bid up ES. With a little more “effort” it will reach the SMA5 200 and TL at 2453.85. With a little nudge past the SMA5 200, it might even try for the larger TL at the .500 Fib at 2600. It would make a nice trophy for the machines to capture.
 UPDATE: 2:10 PM
VIX has tumbled over 11%, which together with USDJPY and DXY’s rally has been enough to keep ES on the rise even though CL seems determined to test recent lows. 


 Note that below 27.34, CL loses all support until its next downside target of 26.05. After that, it drops to 17.12 – its 2001 lows.
UPDATE: 3:50 PM
Oops! VIX is turning back up as CL continues to melt down and the 2s10s has pushed above 53 bps. Not an ideal set of circumstances for ES trying to reach that upper TL. This is setting up for a pretty weak close.


 If it holds and increases, this is very damaging to the equity market.
stay tuned…