

One of the more compelling relationships I recognized over the years is what I have dubbed our Yield Curve Model. Simply stated, it pointed out that every time the 2s10s broke down below significant support, stocks would suffer. But, the bigger disasters – think 2000-2003 and 2007-2009 – occurred when the 2s10s broke out after inverting.
We got our latest inversion last August after a series of breakdowns and minor breakouts, each of which visited downturns on the major averages. The biggest breakout, however, occurred yesterday, when 2s10s soared as high as 73 bps. It has since settled lower, but remains broken out — a signal that we might very well be headed for a GFC style crash.
 continued for members…
The bigger picture shows that the initial breakout starts the ball rolling. Eventually, the trend is broken, which is essentially the second-third wave of the crash. This means our lower targets are very much in play, even if the channel hasn’t yet broken down.

 On a positive note, TPTB have managed to hold VIX below yesterday’s highs. I can’t imagine how large the central banks’ short positions have become.
 The downside will continue to be driven by the continuing crash in oil and gas prices, though downside support is coming into view at CL 20.65 and RB .639ish. If these channel bottoms don’t hold, the downturn could be worse than 2007-2009.
 We’ve had 17.12 as our cycle model low, but the cycle didn’t indicate it would be reached until April 2023. Here we are three years early!
 Currencies are doing their best to stem the tide, but even DXY’s new highs haven’t helped much. Note that DXY tagged our .786 target overnight on EURUSD’s continuing cratering and USDJPY’s continuing meltup.

 Gold has managed to hold the midline – no doubt on continuing government accumulation.
 Looking again at the bond market, 10Y yields have popped back above the 1.272, meaning prices have tested the prior highs. This is supportive of the DXY, of course, but it feeds right into our yield curve model’s bearishness.

 UPDATE: 11:10 AM
The early bounce is unwinding a bit – with a likely test of yesterday’s lows coming up.
 VIX is testing an overhead TL.
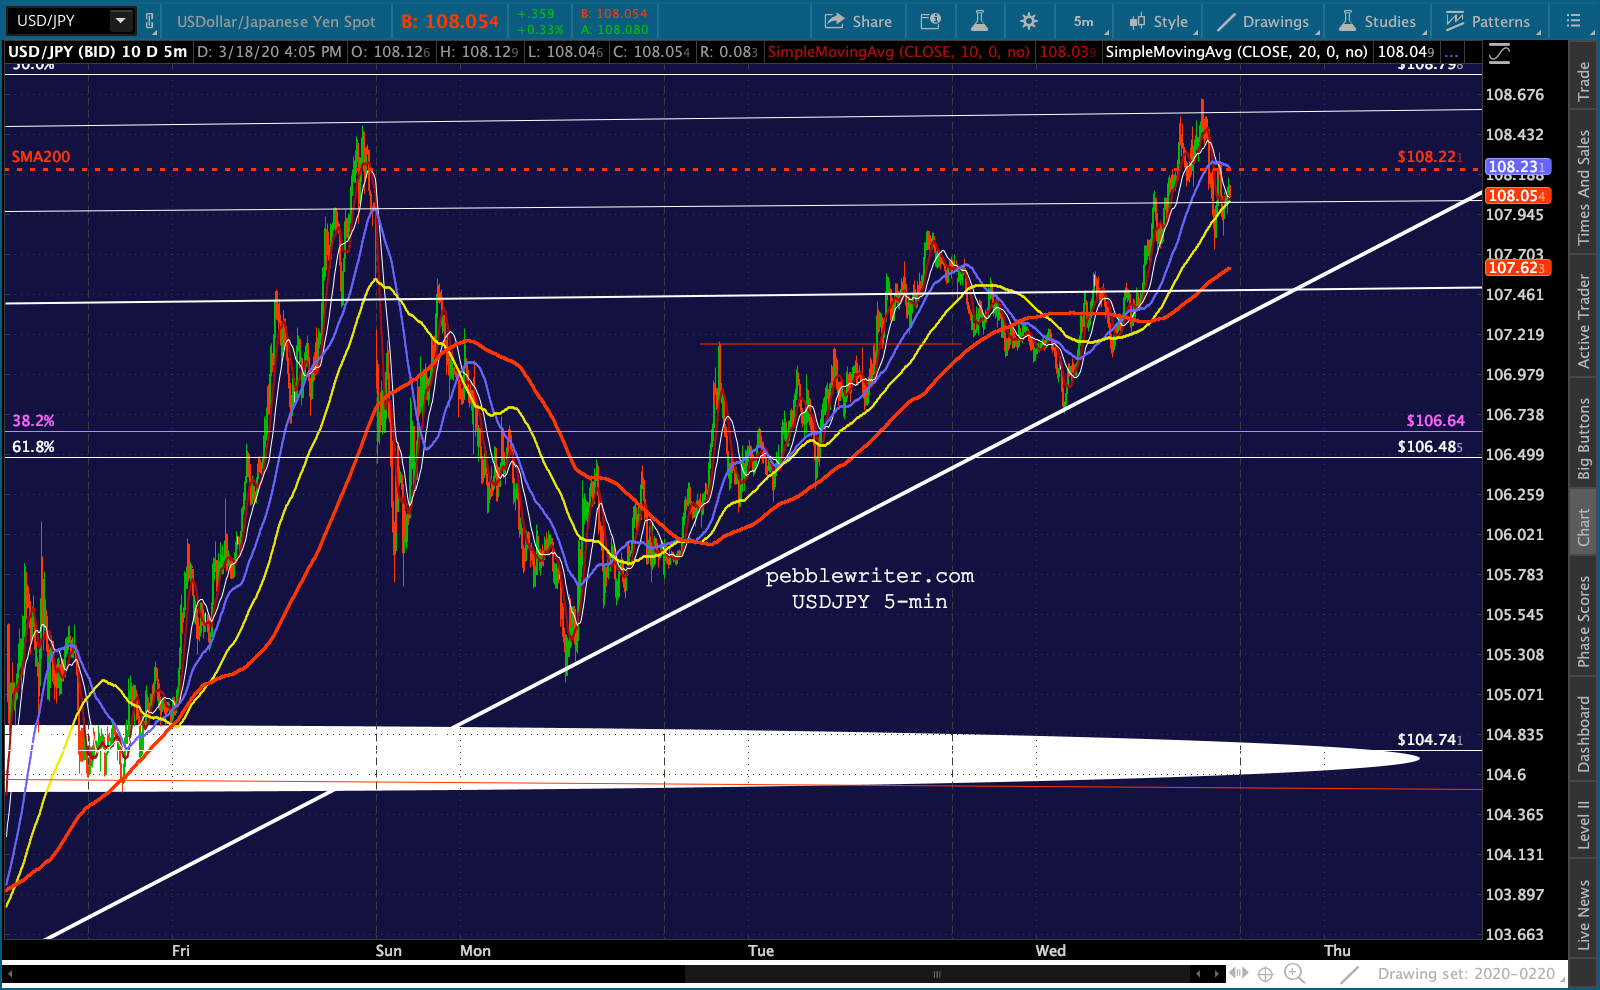
 But, USDJPY is readying a test of its SMA200. Remember, a push above it could help stocks. A reversal would most certainly not.
 DXY has already pushed through the .786 and is on its way to the .886 and, potentially the 2017 highs at 103.82.
 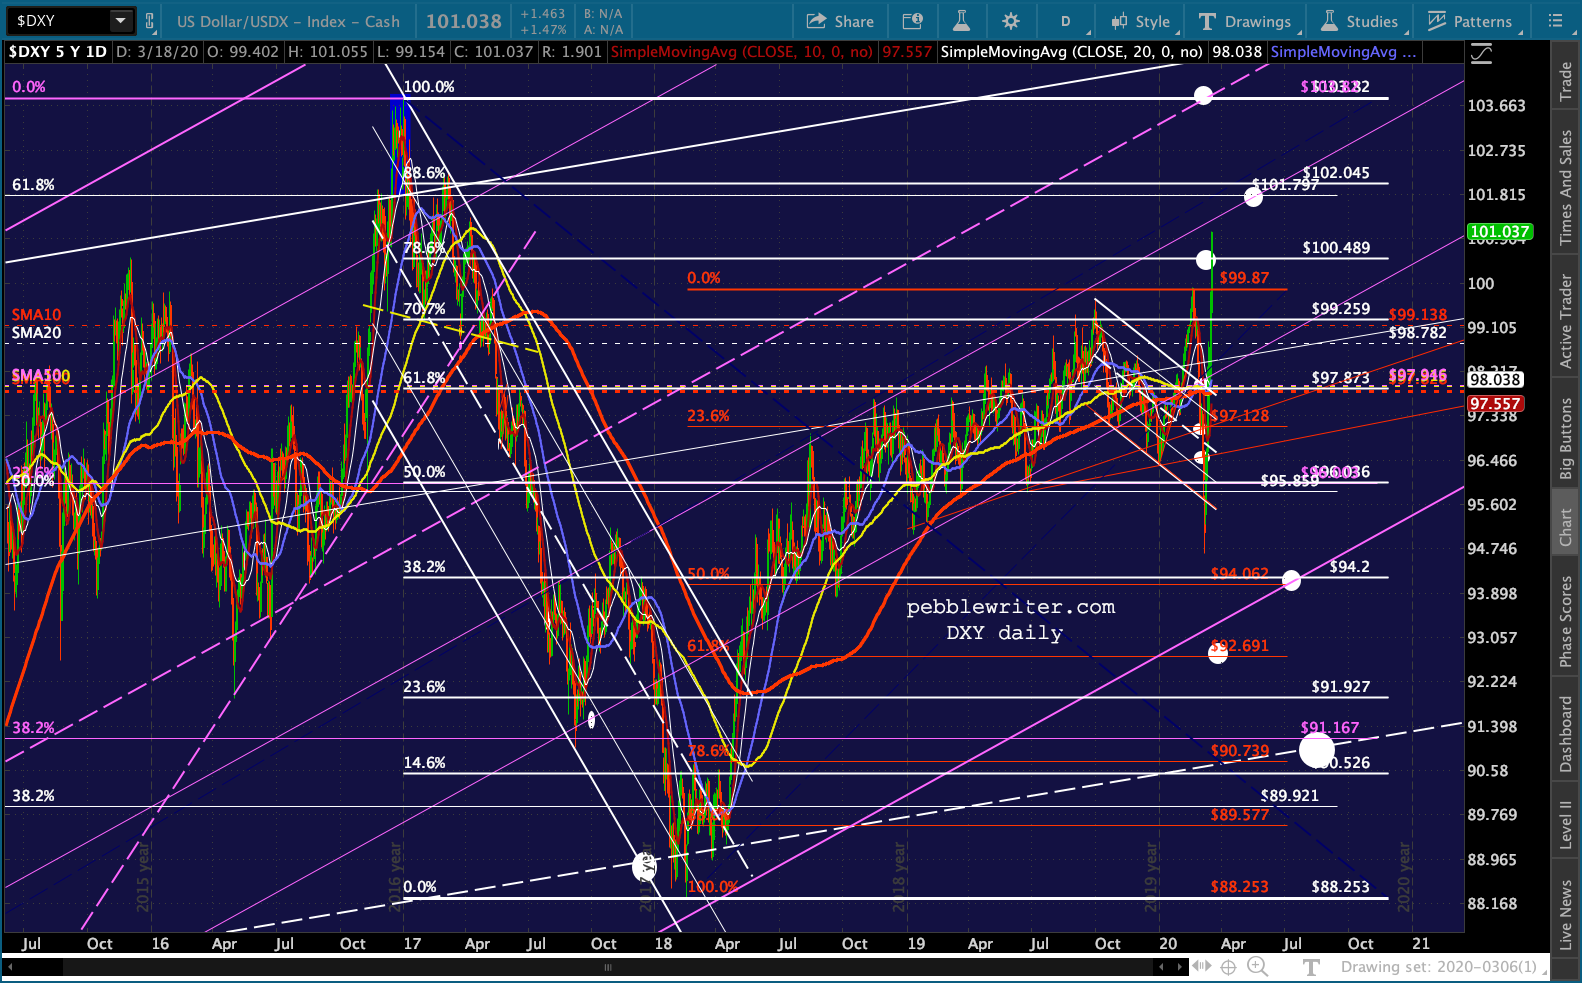 EURUSD continues melting down. The white channel bottom is coming up at 1.08ish.
 If that breaks down in favor of the 1.0592 .886 Fib, it would mean a breakdown of a very important channel in place since 2000.
 IMPORTANT: Something I hadn’t put on the CL chart yet was a trend line connecting the 2009 and 2016 lows. Since much of the world focuses on trend lines more so than channels, and since the channel is subject to adjustments based on specific highs/lows, I’ve added it to our chart as a red, dashed line. Currently, the line is at about 22.63-22.70. A big bounce here could preserve SPX/ES’s yellow channels, at least temporarily.
 UPDATE: 12:34 PM
Here we are at CL’s red TL. 
 We should find out very soon whether it holds, and whether ES and SPX can hold their prior lows.
 VIX has broken above the little red TL, but is still well below its lows.
 USDJPY pushed above its SMA200 and is likely to remain close by in order to effect a rescue.
 UPDATE: 1:52 PM
CL and RB have both almost tagged their channel bottoms, but 2s10s is up to 70 bps.


 SPX and ES are dropping through their Dec 2018 lows.
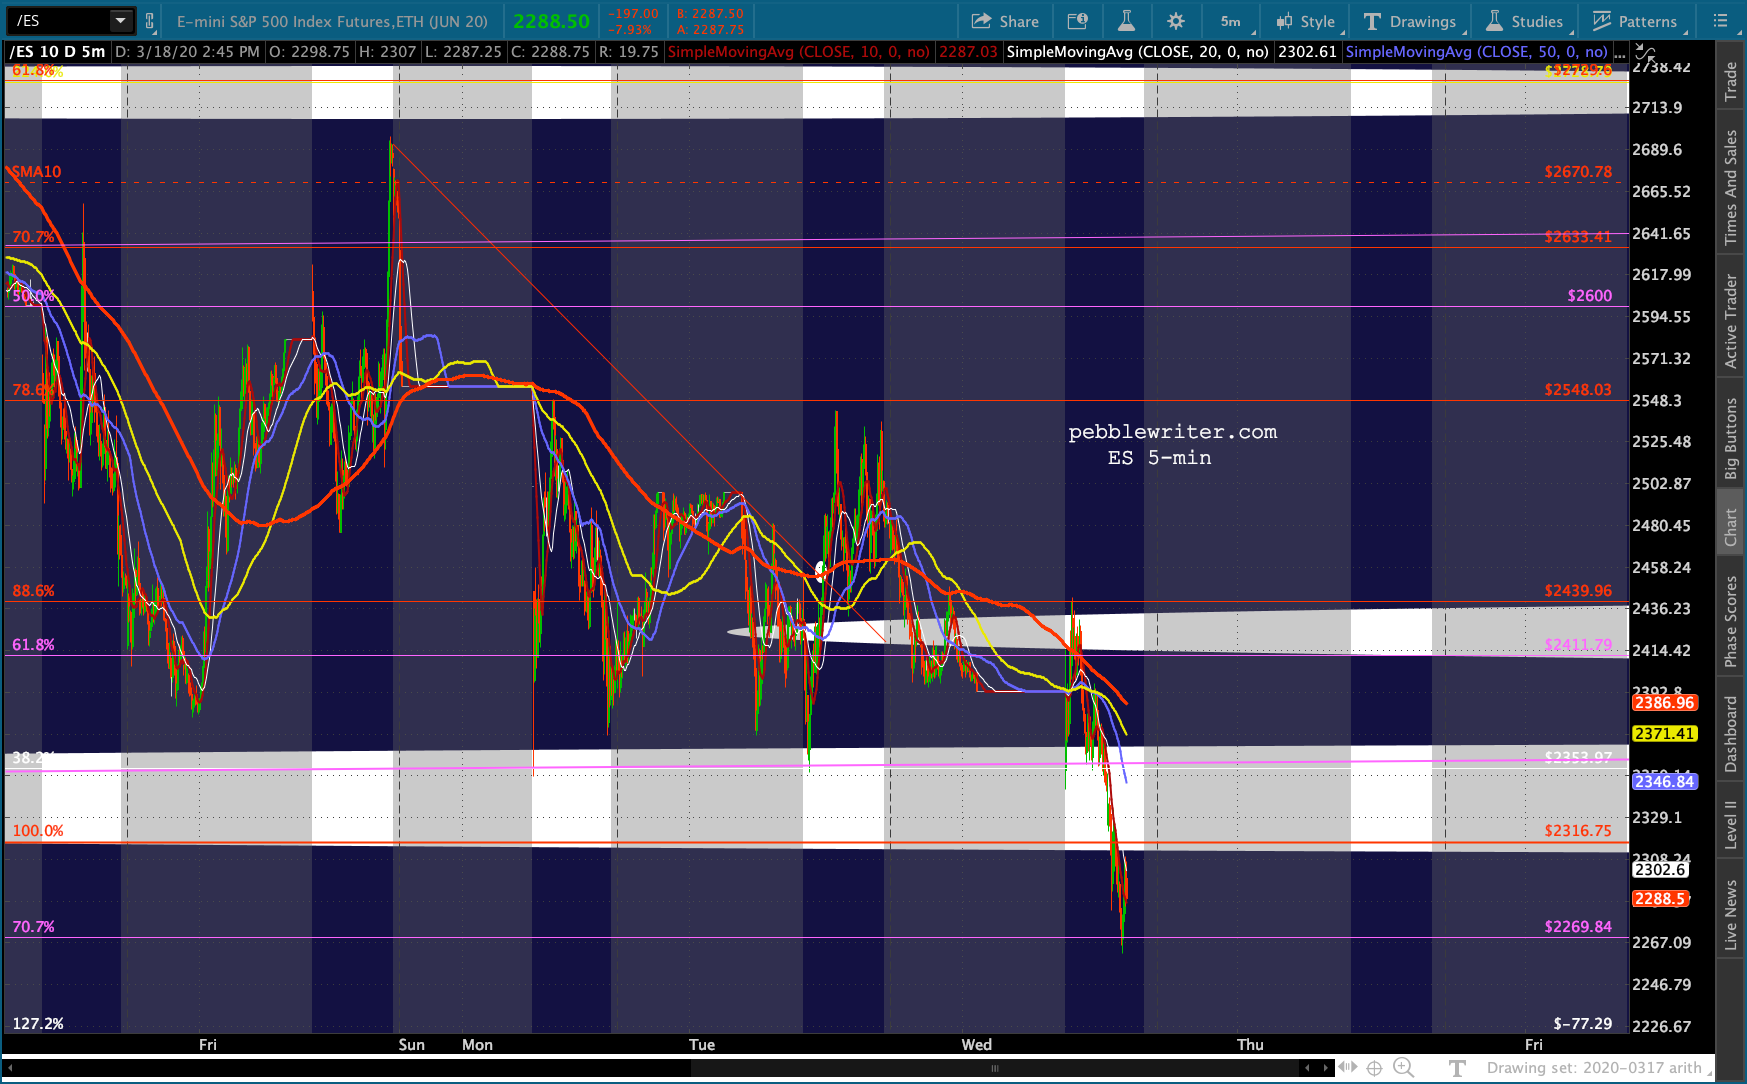
UPDATE: 2:45 PM
A little better tag on the channel bottoms…


 Note that VIX has made a higher high.
 And, the 2s10s has risen to 76 bps.
 While the bounce in CL/RB might help, the 2s10s is pushing stocks lower, as are DXY’s reversal at its .886…
 …courtesy of EURUSD’s bounce on the channel bottom…
…and USDJPY’s retreat from its SMA200.
 Stocks are getting a little bounce here on their .707, the least appreciated Fib retracement. If oil/gas bounce enough, they might be able to get SPX/ES back above their Dec 2018 lows. But, stocks really need those other factors to pitch in.
 UPDATE: 4:10 PM
Tricky closing. CL backtested to just above the red TL but no further.
 SPX rebounded to the yellow channel but no further.
ES failed to break out. VIX backed off but didn’t break down.
USDJPY did the same.
 If CL/RB bounce 5% higher as the result of a Saudi/Russia deal or the BoJ spanks USDJPY up to 110, shorts are screwed. The fundamentals are still terrible, as the last time I checked COVID-19 is still with us and we’re facing a nationwide shutdown a la Italy. Tough call.
DJIA indicates this bounce will have legs as it has finally reached out 18974 target – the backtest of the 1.618 and the rising red channel from which it broke out in 2014-2016.
 The 2s10s has retreated to 64 bps but is still broken out…
 …though the 10Y might be approaching a ceiling as it nears 13.36 resistance…
 …while the 2Y is already at horizontal resistance. In other words, we might see the 2s10s run out of steam in the short run, possibly making a lower high.
 Bottom line, I have little confidence in a rational, fundamentally-justified bounce. But, I have even less confidence in TPTB’s ability to leave the markets alone now that they’ve seen how much selling pressure is out there. Caution is strongly advised.