Author: pebblewriter

  • A Stall, or More?

    A few days ago, we looked at the outsized influence of oil on algorithms.  It’s one of the big three: oil, VIX and USDJPY. This morning, it’s USDJPY’s turn.

    Futures, which were down 17 points late last night, are suddenly up 35 points as we approach the opening bell. It happened in the absence of any particular news and without any particular support level having been reached. It was just USDJPY which, on its way to backtest its SMA200, made a sudden reversal well short of it and went up to test the same overhead TL which has stopped it multiple times since Monday. This time, though, as futures were having a hard time exceeding the overnight highs, it popped through that TL – a breakout that the algos couldn’t ignore.Will it be enough to outweigh yesterday’s disappointing reversal of fortune precipitated by oil’s sudden fall from grace?

    Meanwhile, the “slowdown” in COVID-19 cases and deaths in the US took a turn for the worse yesterday…


    … as new evidence emerges of the administration’s failure to heed pandemic warnings from Peter Navarro from as early as January 29 even as President Trump and key administration officials were downplaying the risk. Copies of the full memos can be found here.

    January 29 memo to the National Security Council, chaired by President Trump:

    The February 23 memo addressed directly to the President:

    ABC reports that US Intelligence officials’ warnings about the virus were first aired in November 2019 and began appearing in the President’s daily briefings in early January.

    I suspect this won’t play well in Peoria.

    continued for members(more…)

  • What Line in the Sand?

    Another massive overnight ramp job…nothing new there. But, this one has led ES to an important Fib level where it seems to be pausing: the 2.24 extension of the 2007-2009 drop.  Will it matter?

    The great thing about ES’ overnight ramp jobs is that they allow SPX to gap right over its own overhead resistance – which in this case is SPX’s 2.24 Fib extension at 2703.62. It’s the Fib that SPX spent from Jan 3, 2018 to Feb 11, 2019 endlessly crisscrossing.

    continued for members(more…)

  • Update on Oil: Apr 6, 2020

    Many seasoned investors are surprised to see how positively correlated stock returns have been to oil prices. Energy stocks make up 8% of the overall market, so you’d expect them to have some influence. But, thanks to the increasing prominence of algorithms and quantitative trading, the impact has grown well beyond what 8% should contribute – with most of the market’s significant highs and lows perfectly aligned with oil’s over the years.A 2017 study by JP Morgan estimated that only 10% of trading volume is by discretionary investors who focus on fundamentals. This means that 90% of all volume is driven by passive and quantitative techniques including everything from index funds and ETFs to high-frequency trading and corporate buybacks.

    The tail that wags the quantitative dog is algorithmic trading, where hundreds or even thousands of factors are constantly monitored and provide instant input for trading decisions.  While these factors include big picture economic data such as interest rates, inflation or employment figures, the Big Three that consistently drive big moves on a daily basis are VIX, the USDJPY and the price of oil – specifically WTI futures [CL.]

    Oil is the only one of the Big Three which has an almost immediate and substantial impact on the US economy. So, when prices are manipulated higher or lower, we see a change in inflation data, interest rates and, of course, stock prices.

    This is why we were able to call the top on October 3, 2018:

    CL and RB…not only reached overhead resistance by our measure, but must deal with inflation that’s too high, bearish API data, another round of Trump tweeting, and a large build in EIA inventory. I think the time has finally come to revert to short…

    CPI had recently reached almost 3%, dragging interest rates higher as well. The 10-YR reached 3.25% on Oct 5, threatening to break out of a channel dating back over 20 years at a time when debt was exploding higher.

    Trump had been jawboning and tweeting his desire for lower oil prices. But, his entreaties had fallen on deaf ears until Oct 3, when journalist Jamal Khashoggi was brutally murdered and dismembered by agents of Saudi Arabia for criticizing Saudi Crown Prince Mohammad Bin Salman (MBS.)

    As details emerged and MBS’ complicity became evident, Saudi Arabia suddenly needed friends in high places. Trump was happy to oblige, but had one condition: oil prices needed to decline immediately – which they did.  CL plunged 45%  over the next 11 weeks.The YoY drop in oil and gas prices was immediately reflected in inflation. CPI dropped from 2.52% in October to 2.18% in November and a low of 1.52% by February 2019.

    The 10-YR dropped from 3.25% in October 2018 to 2.36% by March 2019.  Prices at the pump plunged as well, and Americans rejoiced at more affordable commuting costs.

    Remember, oil is one of the Big Three drivers of stock prices. So stocks plunged as well – shedding about 20% by December, when Treasury Secretary Mnuchin convened the Plunge Protection Team to prop up the market – enabling stocks to reach new highs while CL merely enjoyed an extended bounce.Saudi Arabia needed the bounce every bit as much as did stocks. The troubled Aramco share offering had been delayed time and again, and higher oil prices made a larger raise possible. The plunge resumed within a few weeks of the IPO.Then came the slowdown.  Demand had already been ebbing and prices had been settling lower for weeks. But, after a very brief bounce, oil prices plunged when COVID-19 came onto the scene. Suddenly, fundamentals mattered again.

    Prices plunged to the bottom of a falling channel from 2008 over 3 years ahead of schedule per the cycle study we first posted in March 2019 [see: Macro Cycles and Regime Shifts.]This added fuel to the fire for stocks, which already had plenty of reason to plunge as global economic activity screeched to a halt.  Algos, which might normally have been employed to prop up stocks, were pressuring them lower.  At the same time, the USDJPY was falling as the Japanese yen rallied and VIX spiked higher on greatly increased volatility.

    Note that long-term trends in gasoline prices were also in danger of breaking down.

    Perhaps more alarming to Team Trump, the Dow had fallen to levels not seen since the 2016 election. The energy industry is vitally important to the US, with millions of jobs and billions in loans dependent on prices stabilizing. It’s no surprise that the federal government would support it as it has many other industries which have been decimated by the global pandemic. Many majors oppose price supports, perhaps hoping to scoop up highly-leveraged players at a bargain price when they failed.

    However, instead of making low or no-interest loans available to tide the industry over as it has with every other affected industry, Trump has focused on artificially inflating prices — first with a series of Tweets and lately with a threat to impose tariffs on imported oil.

    As a result, oil has spiked over 50% higher in a mere 4 sessions…

    …facilitating a 24% bounce in the Dow.

    While some are thrilled with the outcome, there are winners and losers. The biggest losers are those who can least afford it: consumers. Higher oil and gas prices are a regressive tax on those consumers who must still drive (disproportionately those less affluent) or buy heating oil or natural gas to keep their families warm during the waning days of cold weather.

    It’s important to recognize that Trump’s insistence on higher oil prices might be partly about saving oil industry jobs, but it’s really about saving the stock market which has learned to take its cues from oil prices.

    If Trump’s “friend” Mohammad Bin Salman — a “man of the people” — still owes any chits from 2018, oil prices could be well supported going forward. But, of course, it will require the assistance of Trump’s other friend, Vladimir Putin, whose willingness to cut back production involves slightly different priorities.

    With COVID-19 deaths in the US topping 10,000, Putin’s response will be important in crafting the next headline-stealing development. But, most studies I’ve seen indicate that supply now exceeds demand by at least 25 million bpd. So, even the 10-15 million cut suggested by Trump would do nothing to erase the massive oversupply but would merely slow the rate at which the excess is building.

    Rumor has it that Russia will play ball as long as every other oil producing nation is willing to share the pain – including US shale producers, many of were already on life support before COVID-19 (and expect a decent return on their political donations.)

    If I sell you 100 barrels at $30 instead of 200 at $15, have I made any more money?  Will I now be able to pay back that overdue loan?  Will the market reward my stock? Unfortunately, it only works if the pain is borne by the other guys — which will likely boil down to good, old-fashioned horse trading.  Trump’s opening ante is throwing down-and-out Americans under the bus. We’ll see if it’s enough.

    continued for members(more…)

  • Seems Like Old Times

    Another ramp job on awful economic news which pretty much everybody recognizes understates how bad things really are…

    …and a 46% spike in WTI futures in 4 days based on a Tweet referencing a deal: (1) which has yet to be confirmed by any of the parties; (2) could probably never get done; (3) which, if it were done, would simply slow down the rate at which supply vastly exceeds flatlining demand; and, (4) which, if it were done, would put the most vulnerable Americans deeper in an economic hole than they already are.

    You’d never guess the economy was in dire straits – just like old times.

    continued for members(more…)

  • No Joy

    “No Joy” is an expression pilots use when they’re unable to see another plane, typically when they’re on a potential collision course. If you can’t spot it, you just might hit it. Like seeing a hilltop or radio tower dead ahead through clearing clouds, it can be fairly nerve-wracking.

    Given that today’s jobless claims were worse than almost everyone expected and are just the tip of the unemployment iceberg, it’s next to impossible to bring the proverbial bottom into focus.  Is it 10 million claims?  Twenty?  Fifty?  No one knows, because no one knows how long the virus will be with us. [Our latest COVID-19 Update.]

    Source: Bloomberg

    Futures, which saw quite a bounce overnight on a bump in oil prices premised on a thaw in the spat between Russia and Saudi Arabia, have given up almost all of their gains and are about to turn negative.

    Oil and gas are still up 9% on the day – but, the algos are ignoring it for the time being.

    VIX has even seen a bullish 10/20 cross – all to no avail.  At this point, I imagine Fed and White House officials alike are wringing their hands, wondering what they have to do to get a bounce out of stocks.  The usual tricks are definitely not working.

    Our downside targets remain the same.

    continued for members(more…)

  • And Then There was Q2…

    S&P futures are off sharply, exceeding a 100-pt drop at their lows as the month- and quarter-end rebalancing has concluded and the coronavirus pandemic continues to worsen.

    As expected, the rising white channel from the recent bottom has broken down and the less aggressive purple one is the next line of defense between here and ES 2155/SPX 2138. The bottom is around 2352 (SPX 2363) – an 8.5% decline from yesterday’s close.

    Everyone ready to resume trading halts?

    continued for members(more…)

  • Charts I’m Watching: Mar 31, 2020

    Futures are off slightly as we approach the open, recovering 25 points from the overnight lows as the algos resume control.VIX continues to call the shots, as it has dropped through both the red neckline and the SMA20. Yet, it continues to bounce every time SPX/ES approach a breakout point, indicating that the bounce might indeed be petering out.continued for members… For its part, SPX is still below the purple trend line from 2016 and, like ES, avoided making a higher high yesterday.As expected, USDJPY has edged back above its SMA200, providing an extra nudge for stocks……and putting a little bounce in DXY’s step. EURUSD is contributing by continuing its decline after failing to retake its own SMA200.The 10Y has remained below the 1.272 support……squeezing the 2s10s back to a neutral 47 bps……with the 2Y still hanging on for dear life. A reminder, this is one of the last substantive support levels for the 2Y. The coming breakdown will likely widen the 2s10s, making any further equity gains difficult. Gold continues to be a model of restraint, backtesting its red channel again as it plans another assault on 1708-1735. Trump and Putin reportedly put their heads together yesterday to plan a rescue for oil prices. But, CL has yet to exhibit much of a bounce and remains mired at the lower end of our 20-26 range. Perhaps it has something to do with all that surplus oil sloshing around, searching for any storage facility with extra capacity. While higher oil prices would certainly help stocks – an important goal for many but none more so than Trump himself – they would be a tax on the many unemployed and beleaguered consumers who are wondering how to make ends meet while they await their government checks. For many of those in high-priced areas such as major coastal towns, of course, those checks can’t come fast enough and likely won’t cover rent/mortgage payments – a topic for a future post. Gas prices continue to loiter at the bottom of that falling channel, though the bounce off recent lows is looking rather tired. In the absence of any miraculous medical breakthroughs, it still looks like yesterday’s highs will continue to hold and ES/SPX’s trajectory will be lower, perhaps to the bottom of the rising purple channels around 2350 as early as tomorrow. That should be the next line in the sand, with ES 2155 and SPX 2138 still our preferred downside targets. While we’re in forecasting mode, I’m told that this site should be working normally sometime later today. If you’re reading this on pebblewriter.com, you’ve already figured that out. I’ll repost on pebblewriter.blogspot.com …just in case. I’m going to take some time and update our COVID-19 forecast which, sadly, continues to be on target. More later.   UPDATE: 3:25 PM As we wander into the final hour, things aren’t looking very bullish. Never underestimate the power of a last-minute VIX smackdown, but there are quite a few warning signs flashing red. First and foremost, the 2Y just dipped down to .191, the lowest it’s been since the US lost its AAA in 2011. It quickly snapped back to the .22 support, but this is a pretty big deal according to our 2Y model. The other pretty big deal continues to be the oil market collapse. Sure, it clawed its way back to the channel bottom, but for how long? The next lowest support is the Nov 2001 lows at 17.12. Then there’s DXY which, thanks to USDJPY and EURUSD, is having a hard time staying aloft. Although the USDJPY could still go either way, the BoJ apparently hasn’t signed off on a wholesale devaluation of the yen. This leaves poor little VIX with a lot of lifting to do. As the month- and quarter-end rebalancing winds down, can it continue to offset a very grim economic outlook which, according to Goldman, includes a -34% Q2 GPD read. The worst of the economic data has yet to roll in, but in the days ahead we’ll get ISM, EIA inventories, factory orders and payrolls. It won’t be pretty. ES and SPX might be able to hold support at the close, but I wouldn’t trust them overnight regardless of where they close – not on a bet. GLTA.
  • Algos: Still Ignoring Reality

    Yes, pebblewriter.com is still being worked on.  At least, that’s the last communication I got from Hostgator.  Apparently, their level 2 techs are all working from home and are not permitted to speak on the phone with customers — meaning all communication is being done by email.  It’s hardly ideal, but it’s what we have. With any luck, tomorrow’s post will be back on a properly working website.

     *  *  *

    Futures have been all over the map overnight, ramping from 2445 on yesterday’s open to as high as 2567.50 a few hours ago.

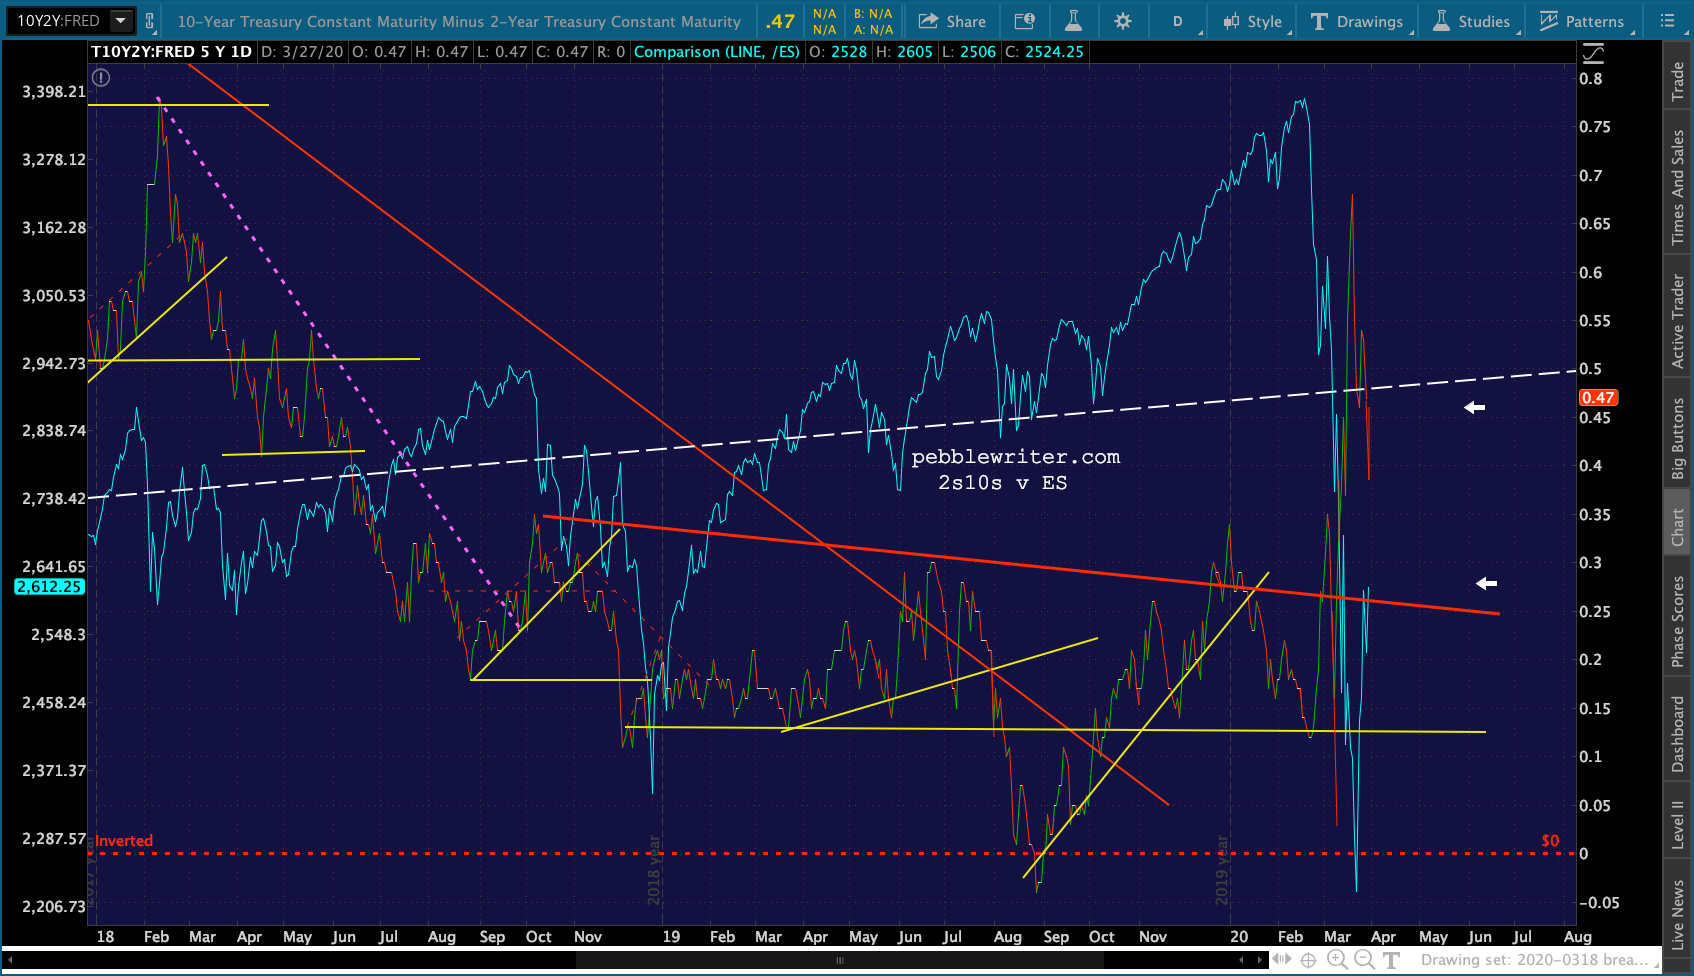
    Perhaps significantly, ES failed to retake the yellow neckline at 2568ish despite the usual smackdowns in VIX and 2s10s.  The 2s10s dropped back through the white TL support which has been the last line of defense for bulls…

    …and, VIX is threatening another breakdown – this time marked by the SMA5 200 and a TL from last week’s lows.

    We might assume that our 80.30 target — reached two weeks early — continues to be the line in the sand for another leg down.

    It makes sense since: (1) the economic picture continues to worsen; and, (2) neither SPX nor ES ever quite reached important Fib support – our 1.618 targets at ES 2155 and SPX 2138.

    If ES’ and SPX’s white channels are yielding in favor of the slightly less aggressive purple channels (channel tilting) then we can look for a .618 or .786 retracement of last week’s lows.

    Once the neckline is topped, however, both would have room to run.

    For now, the algos continue to follow VIX’s lead. A drop through the SMA5 200 would point to a test of the SMA20 and red neckline at 58.60. A drop through it would unleash the bulls for another leg up.

    Working against that outcome: CL continues to falter, dipping below 20 several times overnight.

    Remember, the white line at the bottom of the chart is critical support — reached, in this case, several years ahead of the what our cycle model charts indicated.  A slowdown shutdown of global economic activity will do that to you.

    RB, which saw a nonsensical bounce last Wednesday, is coming to its senses this morning.  Like CL, it is walking on eggshells in terms of support.

    Getting back to the bond market… The Fed appears to have finally figured out what our yield curve model has been saying for the past year or two: a breakout above critical support in the 2s10s would decimate stocks just like it did in 2000-2003 and 2007-2009.

    While the 2Y has dropped through support again…

    …the 10Y is more than keeping pace…

    …allowing the 2s10s to decline sharply.

    Of course, a drop back below the 1.272 Fib at 8.16 should also be expected to spook algos. So, this is a move that cannot really help the bulls longer term unless the 2Y were to spike higher – unlikely in the current central bank cash-for-trash environment.

    On the currency front, USDJPY found its footing overnight at its SMA20 and bottom of its formerly broken white channel and backtested its SMA200 – now at 108.306…

    …which, along with EURUSD’s temporary push above its SMA200…

    …enabled DXY to bounce before even reaching its SMA200.

    The algos might be forgiven for being slightly confused. There have been so many supportive actions on the part of bonds, currencies and VIX – but, not yet enough to force a breakout.  The implication is that they are being tasked with delaying the next leg down rather than engineering another leg up. This jibes with our belief that month- and quarter-end rebalancing is driving much of the upside.

    As always, I’m open to being proven wrong. But, at this point, the bulls are behind the eight ball – with a handful of gimmicks tasked with offsetting some compellingly bearish economic reality.  Trump acknowledged that things won’t be better by Easter, though he falsely maintains the virus will “peak” by then.

    Unless one of the treatment protocols being experimented with proves successful in the next week or so, the virus will be much worse by then.  Our model has been right on track and continues to indicate deaths (2,484 as of yesterday) will reach 10,000 by Friday or Saturday and 100,000 by Easter.

    On a positive note, Italy has seen a slowdown in the daily rate of growth in cases and deaths.  Over the past few days, cases have grown at 7% per day and deaths at about 10% per day. Unfortunately, deaths have topped 10,000 and the mortality rate (deaths as a percentage of total cases) now stands at 11%.

    It would be nice if the US could look forward to such a slowdown. But, in the absence of widespread lock-downs and given the continuing shortage of testing kits, this is hardly likely. Studies show that up to 50% of infections are from those who have few or no symptoms. Without widespread testing, we will see the lag between Italy and the US – originally 11 days and now down to 7 – continue to quickly erode until the US takes the lead in deaths.

    UPDATE:  3:00 PM

    ES has pushed above the neckline and is testing the SMA20, though SPX has yet to register a new high.

    VIX has broken below its SMA20 and neckline, but not yet the typical cratering that we often see in the final hour.

    CL and RB are rebounding somewhat, but lower lows and lower highs for both so far.

    This leaves USDJPY, which failed to retake its SMA200, and DXY, which has yet to backtest its SMA200.  Bottom line, this still looks like a stall and not a breakout to new highs, especially when you take the near breakdown in 2Y and breakout in 2s10s into account.


    For traders with a strong constitution and the ability to hedge overnight, this is another selling opportunity.

    UPDATE:  EOD

    SPX studiously avoided a higher high, thanks largely to USDJPY’s last second breakdown which offset the VIX dip at the close.  In other words, TPTB are working to keep the bounce contained (for a change.)  This doesn’t mean it won’t ramp higher overnight, but it’s a good sign (or a great head fake.)


    FWIW, ES even backed off its SMA20 and made a lower high…

    …while VIX found a little TL to backtest.

    GLTA.

  • Hostgator Strikes Again…Market Sinking

    While I’m waiting for Hostgator to undo the damage they did when they “upgraded” pebblewriter.com, here are the relevant charts for the day. I hope to be back on the main site by the end of the day.

      * * *

    The IH&S that ES completed yesterday failed overnight, but we’re still waiting to see whether the rising white channel bottom – currently 2487 – will hold.
    With ES and SPX back above their SMA10s, the momentum has been with the bulls.
    However, VIX has broken above the red TL from a week ago, offering the green light for lower prices.
    CL is also probing lower, with the same effect.And, as expected, USDJPY is backtesting its SMA200.Bottom line, everything that VIX, USDJPY and CL have done so far have been bearish, but ES has not yet broken trend.  If/when the rising white channel breaks down, we can say the trend has shifted. A drop back through the SMA10 (ES 2418 and SPX 2452) would be confirmation.

    UPDATE:  11:25 AM

    CL is testing former lows and USDJPY has dropped through its SMA200.  This has allowed SPX to find its channel bottom — though ES has not quite reached its.
    I suspect we’ll see ES’ white channel break down and the purple channel I just added take over very soon – something we call “channel tilting.”  Lately, of course, these sorts of things have been happening after-hours.

    UPDATE:  3:40 PM
    Things are shaping up for a bearish close all around.  The 2Y is sliding…
    …while VIX has held its breakout… …USDJPY has dropped through its SMA200… …and CL is still slumping.The past three sessions have seen large selloffs in the after-hours followed by ramp jobs into the next morning’s open. All the signs point to a sell-off, but you know that old adage about twice-burned?
    The folks in charge of guiding stocks higher have no doubt also noticed that the IH&S they worked so hard to engineer is in danger of failing. GLTA.
  • Good News, Bad News

    The good news is that the Senate passed a bill that will presumably help big and small businesses stay alive for the next month or so. Along with the Fed’s trillions, this has the potential to keep stocks on the rise.

    The bad news is that COVID-19 cases and deaths continue to rise unabated, with deaths reaching 1,000 yesterday as per our forecast. Market pundits seem to believe the curve will be flattened and the crisis limited to a few more weeks. But, the numbers don’t support that – not unless a vaccine or treatment is unveiled in the next week or two and the entire country is placed on lockdown.The 10-day moving average for the daily growth rate in deaths has ticked higher to 31.4%. At that rate, we will see 10,000 deaths by April 3 and 100,000 by April 11.  In Italy, the mortality rate has topped 10% of total cases – the result of hospitals being overwhelmed, which is currently the case in NY and increasingly the case in other rising hot spots in the US.

      *  *  *

    Futures are following the algos’ lead again this morning, with ES ignoring the 3.3 million unemployment claims and recovering 77 points off their lows…

    …following another timely VIX beat down from overnight highs.

    continued for members(more…)