Month: January 2020

  • Wuhan Coronavirus: Still Here

    In a stunning demonstration of the extent to which algos control the market, ES soared 56.50 points after the World Health Organization declared the Wuhan coronavirus a public health emergency of international concern.

    While it’s true the press conference felt more like a China tourism promo, the declaration in no way reduced the risk the virus poses. Nor did it reduce the potential economic risk or stock market downside.

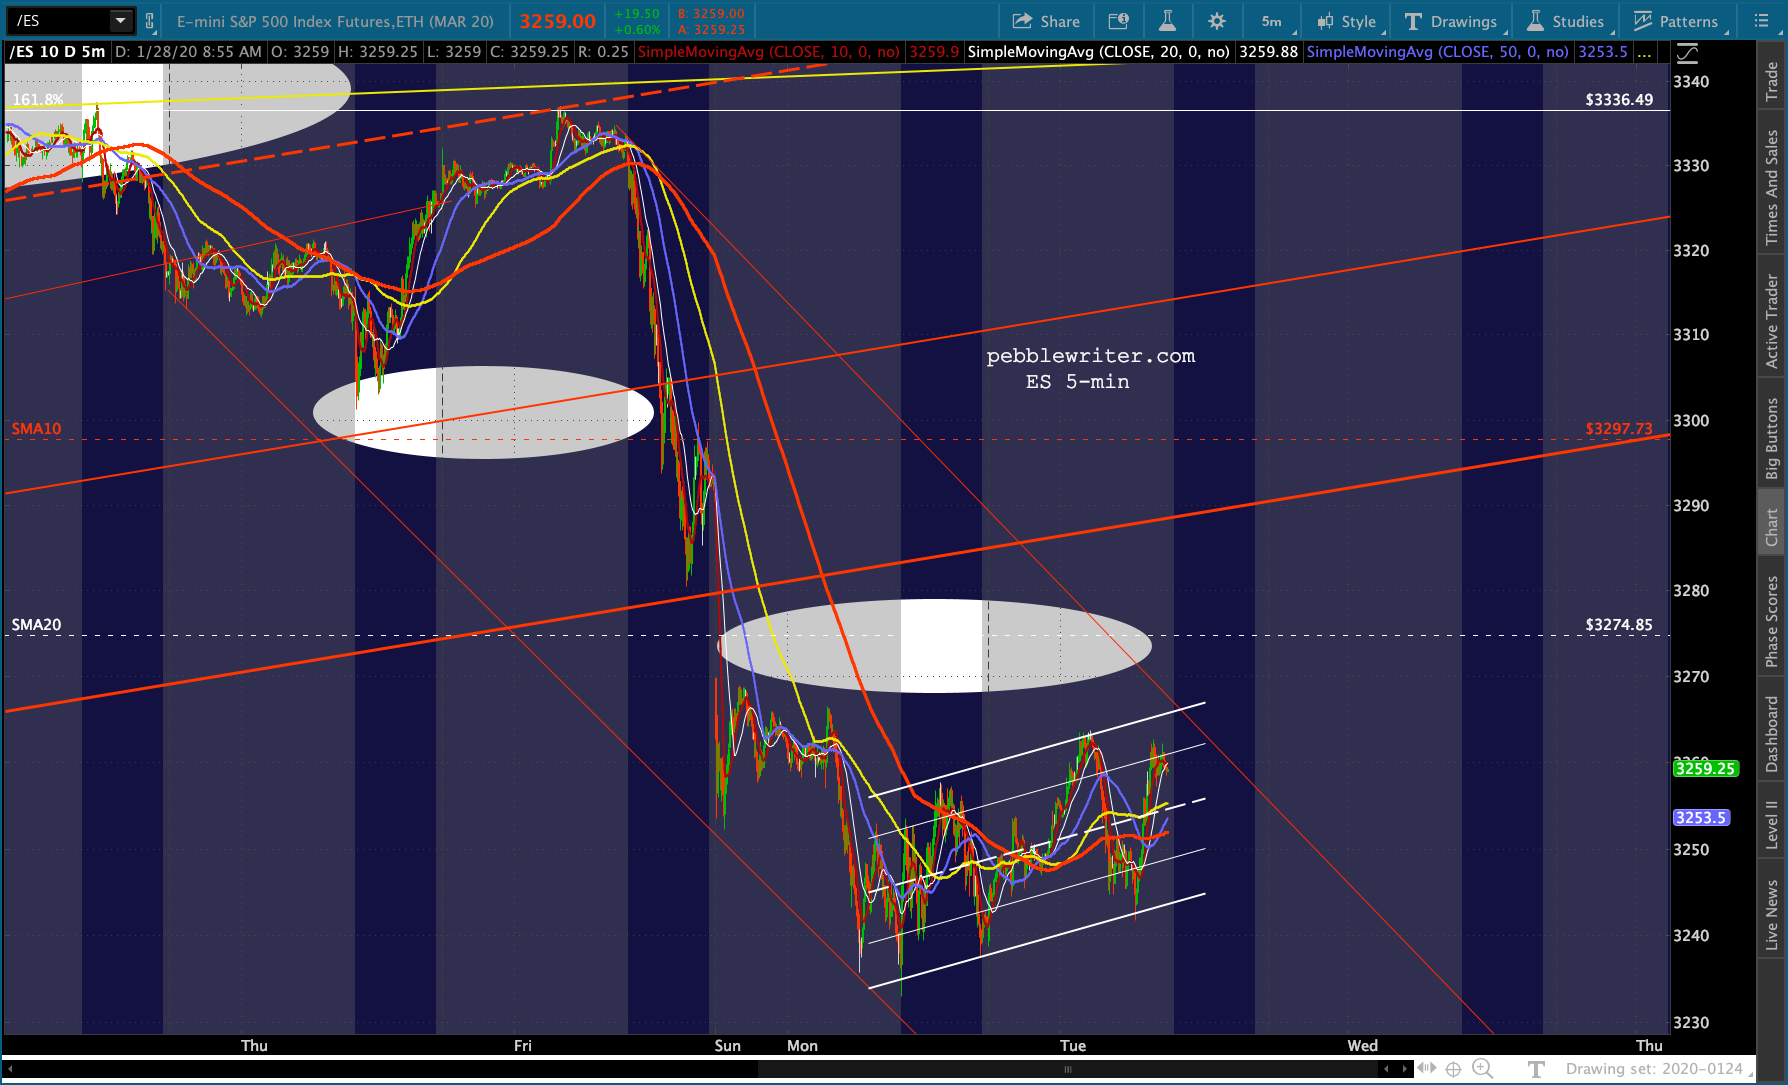
    ES came to its senses after the close, reversing at its SMA10 and dropping back through its SMA20. If today weren’t the last day in January, a month clinging to a positive return for posterity’s sake, we would have seen the next leg down already.Meanwhile, we have scads of economic data coming out at 8:30 and earnings galore to digest.

    continued for members(more…)

  • Just When You Thought it was Safe…

    The downside scenario triggered when S&P futures reached our upside target on Jan 22…

    …is playing out very nicely indeed.

    Credit VIX, which uncharacteristically didn’t collapse last night……and CL which, having come close to our 51.62 target on Sunday, is taking another gander.Needless to say, our downside targets remain unchanged.

    BTW, Boston folks, I’ll be downtown today and Friday. Drop me a line if you’d like to meet up.

    continued for members(more…)

  • TSLA on Autopilot?

    Ignore the sales projections and the hype. Keep an eye on the channel top and 2.24 Fib extension at 653. If it reverses here, the nearest support is at the 10-day moving average at 550, with 521 being the nearest strong support and the previous high of 389.61 the next most likely.

  • FOMC Day: Jan 29, 2020

    Futures are higher this morning on what is expected to be a non-event FOMC announcement and press conference. I suspect attention will again return to currencies, as the US dollar’s surge over the past month, combined with the big drop we had anticipated in oil and gas, will serve to tamp down inflation fears.  Of course, there’s a fine line between falling inflation fears and growing deflation fears.The bond market continues to reinforce the bearish case for stocks.

    continued for members(more…)

  • Reality Catches up with the Bond Market

    You can fake a lot of things in the stock market.  The bond market, not so much. Eventually, reality catches up with the narrative. If the two are as divergent as they’ve been over the past three months, the reconciliation can be ugly.The euphoric breakout we saw following the sharp reversal on Nov 1 was driven by algos, and now it’s failing thanks to algos. The appearance now, however, is that it’s a backtest of instead of a continuation of the falling channel from Sep 2018.Business investment fell more than expected in December, dropping 0.9% and ending 2019 with a meager 0.8% unadjusted gain. It’s not the sort of numbers you would expect if this were “the best economy ever.”

    Futures are doing what they do best after a horrid day yesterday, putting in a algo-driven bounce.If the charts are correct, though, this is merely a pause with additional downside to come.

    continued members(more…)

  • More Where That Came From

    We’ve been bearish on oil for quite a while, shorting it at 75.57 on October 3, 2018 after Jamal Khashoggi was dismembered and at each of the 3 subsequent peaks since then: just before the JCPOA breakup, the Abqaiq attack and the Aramco IPO — which should have been a peak, but resulted in a headfake “breakout” climaxing in the Al Asad attack.

    Last night, CL dipped to within 0.41 and RB within 0.187 of our next downside targets. As members know, these are critical support levels. A breakdown would be devastating to oil and gas and present stocks with very strong headwinds.Futures, now at 3260, are headed straight for our next downside target at 3200.Yes, the coronavirus is potentially a very big deal. But, this decline in oil and gas was baked into the markets over a year ago and is a strong endorsement for our inflation model.

    continued for members(more…)

  • Charts I’m Watching: Jan 24, 2020

    SPX hit our initial downside target yesterday: a backtest of the 1.618 Fib extension at 3306.51. USDJPY and CL also tagged their initial downside targets and bounced. Combined with VIX being hammered as it neared its SMA100, this was enough to produce a gain on the day which accelerated into the after-hours.

    Ironically, SPX missed tagging its SMA10, and even came up short of where the SMA10 would be after the close.  ES, however, tagged its newly minted SMA10 and has bounced back to within 0.50 of its all-time highs as VIX threatens another index-boosting breakdown.

    One might think it’s off to the races again, but oil and gas are signaling continued losses and the yield curve has taken another step in a bearish direction. Stay frosty.

    continued for members(more…)

  • Update on Oil & Gas: Jan 23, 2020

    ES is well on its way to our initial downside target, aided largely by the reversal we have been expecting in oil and gas. EIA inventory data is due out at 11:00 ET this morning, which should confirm what the charts have indicated for months: the YoY price change was inconsistent with the inflation and interest rate outcome that both the administration and central bankers desperately need.

    In goal-seeking markets, understanding this dynamic is more important than playing guessing games with inventory data. Unfortunately for equities, the free ride they’ve enjoyed on the back of rising oil prices is set for at least a pause.

    continued for members(more…)

  • Be Careful What You Wish For

    About five weeks ago, when ES broke out of the channel it had inhabited since May 1, we noted that there were some very distinct upside targets which suddenly came into play.  From Just Two Things on Dec 16:In Fibonacci patterns, upside targets are something to which stocks can aspire.  But, they are also potential turning points.  So, what does it mean that ES just reached that important Fibonacci target at 3336.49?

    continued for members(more…)

  • Tests All Around

    Futures are off about 10 points this morning in a rare holiday weekend drop……due primarily to a big drop in oil, which failed to top its plunging SMA10 and, instead, tested its SMA200 for the fifth time in the past six sessions.  More importantly, it broke a trend line dating back to Oct 3.Unless it bounces back intraday, stocks will be facing serious headwinds which include USDJPY’s failure to complete the breakout it threatened last week.

    continued for members(more…)