Month: April 2018

  • One Down…

    It took six sessions, but SPX is finally back above the neckline we laid out two weeks ago.  For the bulls, this was an important achievement.  It not only gives them a new, higher level of vital support than the SMA200.  But, it gives them a specific upside target which.

    Note that IH&S upside targets have eventually been achieved nearly every single time over the past 9 years.  It’s important to note, however, that the patterns themselves have sometimes busted before the price objective was achieved.

    VIX has reached our next downside target right on schedule.  As we’ve discussed, the path was almost a certainty given the difficulty USDJPY and CL face in continuing their bullish ways.  The algos aren’t picky.  VIX’s (unnaturally orderly) 32% collapse over the past 7 sessions has worked just fine.While this is an important milestone, there are two more important ones to achieve before we can say the bulls are in the clear.

    continued for members(more…)

  • Third Time a Charm?

    Friday marked SPX’s second attempt to top the neckline of a sizeable IH&S Pattern.  The  ramp couldn’t hold, however, and the index tumbled as much as 35 points from its highs.  The futures currently point to another attempt on 2670.  With the Syrian conflict seemingly on the back burner again, will the third attempt succeed?continued for members(more…)

  • Finally!

    Futures have opened up a 14-pt gain overnight, positioning SPX to finally break through its IH&S neckline at 2670.  Leading the way: USDJPY, which broke out yesterday… …and VIX, which is finally breaking down after weeks of indecision. The bulls are not out of the woods just yet.  SPX still has to hold 2670 and then its important 2.24 Fib extension (2702.63) in order to break out.  But, if the Dow is to be believed, this morning offers an important opportunity for the bulls.  Will they take it, or are we looking at another head fake?

    continued for members(more…)

  • The Waiting Game

    It’s day 4 of the nearly complete IH&S.  USDJPY, a drag on equities for much of yesterday, apparently got the memo and is threatening another breakout.On the other hand, CL and RB – yesterday’s algo treats – are slumping and VIX remains non-committal.  Put it all together, and SPX/ES remain within striking distance of a breakout.  But, there’s been absolutely no follow-through.  I suppose the absence of an affirmative statement is the statement.

    continued for members... (more…)

  • Update on Gold: Apr 11, 2018

    In our last major update [see: Jan 26 Update] we noted that gold, 1355 at the time, had reached the same price level at which it had frequently reversed.  Even though we’d had a bullseye at 1377-1380 for over a year, it had stopped short several times.

    GC is sitting just below the neckline of the huge IH&S that could result in a significant breakout.  The fly in the ointment: I don’t think TPTB will let it break out.  So, you should either take profits here in the 1348-1365 range, or at least set your stops at this level.

    As it happened, 1365 (reached the day before) was the cycle high.  Gold tumbled 4.1%, then bounced around between roughly 1308 and 1362 for the next two months.  Our interim posts caught most of the moves:

      * * *

    Feb 8: Analog Details  “[Gold] has dropped 4.1% since reversing where expected in late Jan, and just reached fanline and double channel support [1321.] Could it finally be ready to tag 1377-1380?”  Bottomed that day, rallied to 1364 over the following week (+2.51%.)

    Feb 15: Where to, Next?  “GC might have run out of steam here [1360.] Cautious types should consider taking profits, while the daredevils out there remain focused on 1380.” Topped out the following day at 1364 (+2.95%.)

    Feb 27: Powell’s French Toast   “Gold is getting clobbered…our analog suggests a Mar 1 turning point. The SMA100 should be around 1303 by then and would be a better bounce spot.”  Bottomed on Mar 1 at 1303.60 (+4.15%.)

    Mar 27: Algos to Markets – All Better  “GC, which tagged its 1362 resistance yet again, has retreated once more… It still has a good shot at 1380, but only if/when DXY finally breaks down.” Reached 1369.40 today (+5.05%.)

     * * *

    So, here we are, sitting on a tidy 14.7% gain.  It’s not terrible for 2 1/2 months work, considering gold has only netted a 0.9% gain during that period.  But, I hate to leave money on the table. Is it time to pull the plug on 1377-1380?  Or, are we about to reach or exceed it?

    continued for members

    The two major factors at work are the ongoing saga of the US dollar and the possibility of a shooting war with Russia in Syria.  I can’t speak to the question of a war other to say anything’s possible, especially with the crew currently running the ship.

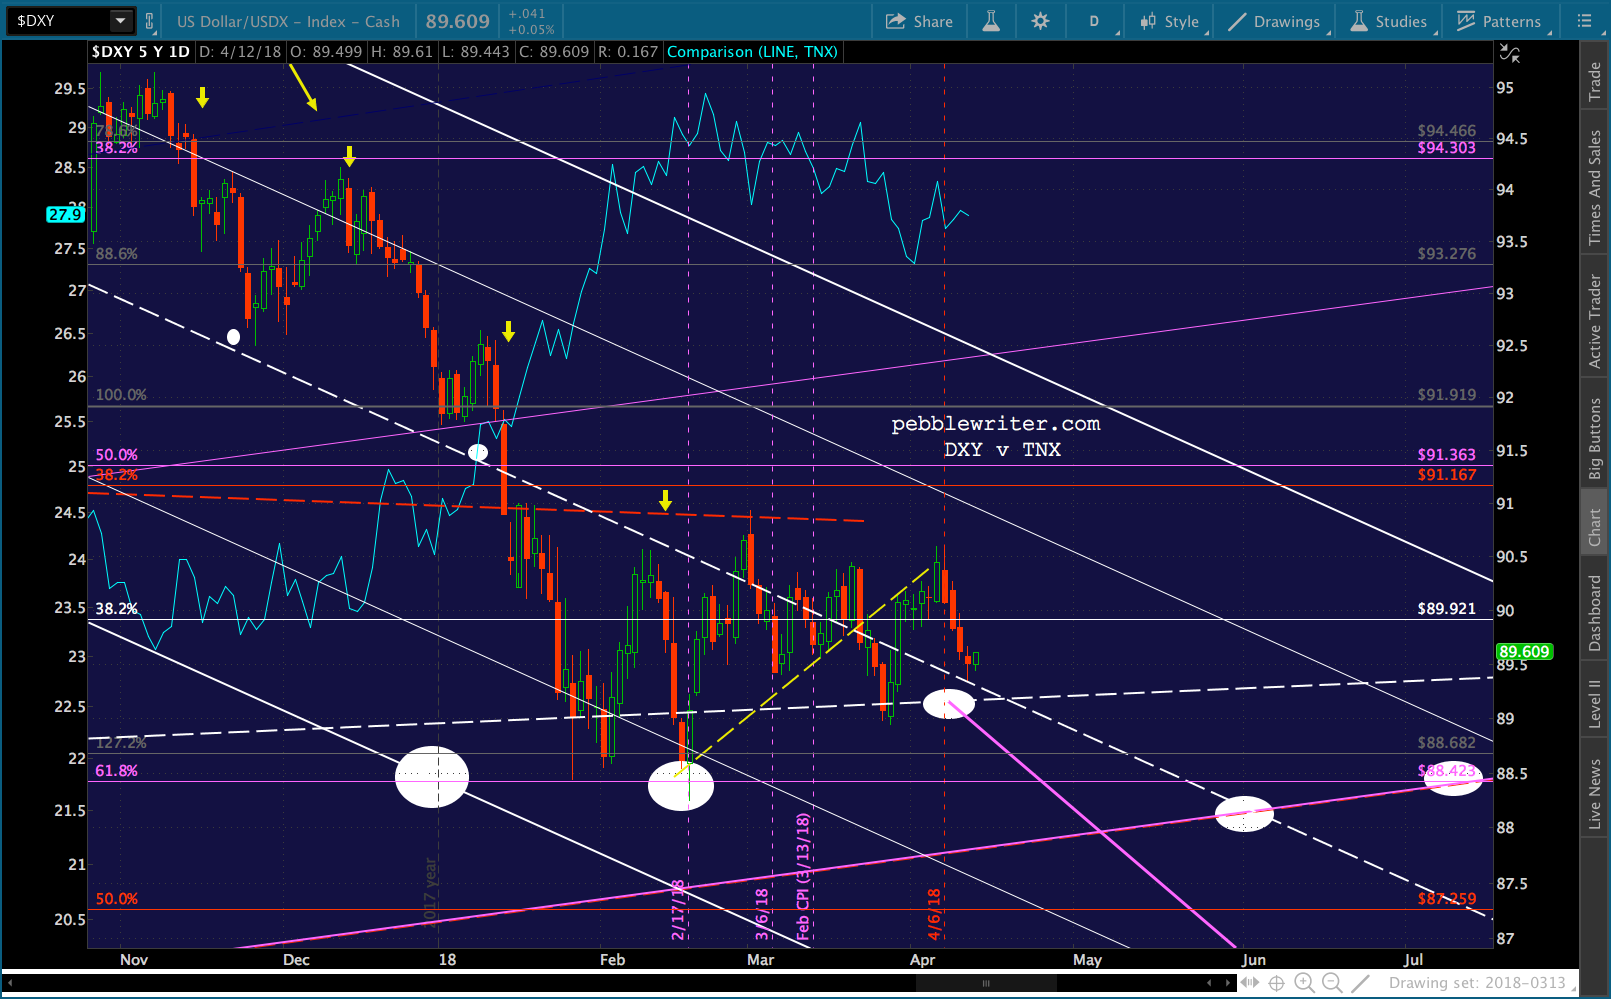
    The dollar is another matter.  While it normally rises and falls in sync with interest rates, this relationship reversed at the end of 2017.    At that point, DXY logged another leg lower while TNX spiked. At just shy of 3%, the TNX became a drag on equities — the whole “going broke” thing [see: Why Rising Rates Are a Problem This Time.]  But, as the gyrations in equities picked up again, great care was taken to ensure it didn’t plunge in value.

    I suppose the thinking was that lower rates would weaken the dollar’s appeal.  Or, maybe it was just fear of a yield curve inversion.  In any case, TNX’s purple TL has refused to break down. DXY also refuses to break down.  And, this could go on for quite a while.  It needs to tag the bottom of the rising purple channel.  But, until mid-July rolls around, that would mean dipping below the .618 at 88.423.  So, it’s quite possible TPTB will prop it up for another three months! 

    Remember, Mnuchin publicly stated he wants to support the USD.  And, it goes without saying that he, like every central banker, loathes any serious price appreciation in gold, as it undermines the value of the mighty dollar. One silver lining, EURUSD suggests a shorter timeframe, say Jun 5.  But, even two months would be a long time to wait for another few points.  An escalation in MENA tensions could obviously accelerate things.  But, is it worth taking the risk for 10-15 points?  I think not.  I’d pull the plug or at least enter stops here at 1367.  If it pops above 1380, great.  No argument with going long, again.  DXY could drop to 87 tomorrow, and GC could easily reach 1377-1380 or higher.

    But, if DXY continues sideways, and unless war breaks out in the next day or two, it seems likely that gold’s next move will be lower.  The most obvious support is at the rising white channel bottom and SMA100, currently around 1315.2-1318.  If the channel breaks down again, the SMA200 will reach the purple channel line later this month, probably around 1300.  I’ll update things if we see a material deviation in either direction.

    GLTA.


  • Unhinged

    More excitement out of the Oval Office this morning, as our Stable Genius in Chief’s tweets suggest the pressure might be getting to be too much.

    First came the tweet threatening an actual shooting war with Russia……which was quickly followed by a tweet extending an olive branch.

    Was the addition of a question mark at the end of “Stop the arms race?” supposed to diffuse the irony of such a statement being uttered by the guy who recently increased defense spending by $54 billion?

    And, maybe someone should explain to him that “good cop-bad cop” doesn’t really work if the cops are both the same person.

    Not amused, S&P futures were off 40 points — backtesting the SMA10 before enjoying a slight bounce.  The momentum that has built over the past two days has been damaged, if not broken.

    The reversal came at an inopportune time, as both SPX and ES were nearing completion of bullish IH&S Patterns.  The proximity of the buy signal, as is so often the case, was also a signal for caution.  As we discussed yesterday when posting a sell signal at SPX 2662.20:

    In many instances in the past, IH&S Patterns have failed at about 10 points below the neckline.  The first I can recall happened in 2011 [see: Ten Lousy Points.]  That’s where SPX is, now.  If the plan is still to afford COMP an opportunity to tag its SMA200 (which is now heading lower) then this would be the time for SPX to run out of steam.

    The most telling chart, this morning, is USDJPY — which has broken trend line support after a picture perfect bullish backtest on Monday.It’s distressing to think that the future not only of the market but the world rests in the hands of an individual who struggles to communicate a reasoned and consistent position.

    continued for members(more…)

  • All Together Now

    From a charting standpoint, the tide turned yesterday when COMP reached an intersection of three channel lines.

    COMP has reached its own crossroads, meaning it should at least take a breather or has reached a turning point. Note that VIX is nudging back above the little red TL. I believe this is a good time to try a short position, with a 4-6% drop across the board for equities by Wednesday or Thursday. As always, reasonable stops are strongly recommended.

    COMP accommodated by promptly turning tail and plunging back below 7000.  Unfortunately, for the bears, the closing bell rung before it had a chance to follow through to its SMA200.  It’s one of the few major indices which has yet to tag the important moving average.

    The closing bell always ushers in a “crap shoot” period where fluctuations in USDJPY, CL, VIX, etc. can ramp up equity futures with little effort.  Such was the case, last night, when the three combined to erase the previous day’s losses.

    USDJPY, which was heading for a backtest of its broken channel, tagged it and reversed higher at 5pm EST. CL bottomed out at the exact same time and proceeded to break out (shocking news: the Saudis want oil prices to go higher in advance of the Aramco IPO.)Naturally, VIX plunged back below its SMA10 overnight — an 8% body slam from 22.02 at the close to 20.24 at 1am. Put it all together and ES, which was 60 points away from completing an IH&S at the open, was suddenly only 12 points away.  Is it in the clear, though?

    Note that it has already backtested the falling white channel twice — with one backtest dipping back into the channel body and below the SMA200 for the 7th time.Are the bulls getting nervous?  Clearly, they are determined to see stocks break out again.  But, the obstacles are stacking up — with the latest being this morning’s PPI report coming in hot at 0.3% monthly and 3.0% YoY.Higher PPI, of course, argues against accommodative Fed policy.  It argues for higher interest rates.  We were recently remimnded that the market doesn’t like that idea one bit.  Despite USDJPY’s ramp job, DXY is falling again.Overheated PPI also argues for a lid on oil and gas prices.  The Saudis might hope for $80 oil, but a 25% rally from current prices would produce inflation that would be highly problematic from an interest rate standpoint.

    We’ve seen these sorts of ramp jobs on a regular basis for years.  But, they’ve taken on a more desperate tone over the past couple of months.  This one might, indeed, stick.  But, traders algos seem more skeptical and less inclined to pile on.  That, in itself, is noteworthy.

    Not too long ago, such skepticism translated into corrections and bear markets.  But, since 2011, in particular, it has simply led to more nonsensical plunges in VIX and ramps in USDJPY and CL.  Stay tuned.

    Now, on to today’s forecast.

    continuing(more…)

  • Stocks at a Crossroads

    Last week, ES and SPX broke out of a falling channel on a combination of Bullard’s and Kudlow’s jawboning and USDJPY’s breakout.  This was followed up by some truthiness from Jay Powell and a failure of DXY to break out, which landed ES/SPX back in their falling channels at Friday’s close.

    With a bullish IH&S Pattern completion 68 points higher and the SMA200 a mere 11 points lower, stocks are still at a crossroads.  With dozens of central bankers in the US and abroad due to speak this week, traders will be parsing each word for signs of whether stocks can continue to rely on central bank support.

    continued for members(more…)

  • Dire Straits

    Watching the latest action, I’m reminded of a little known, but great song from Dire Straits:

    Dire Straits: The Bug (click to watch)

    Between the soothing, dovish tones emanating from Bullard and Kudlow and the warlike tone of our Tweeter-in-Chief, it’s hard to know whether the market is the windshield or the bug.  Is the bulls’ plan coming together, or are they about to lose it all?

    As expected, ES backtested its SMA10 and the channel from which it broke out on Wednesday.  Currently off 22, it’s not enough to allow SPX to do the same.

    SPX’s SMA10 is at 2625.29, 37.44 below yesterday’s close.  In other words, to construct a proper IH&S, ES should return to its overnight lows — which means VIX tagging our upside target and maybe finally getting those moves we’ve been waiting for in CL and RB.

    But, as we’ve seen, unleashing VIX isn’t always a good idea.  With the SMA200 not all that far below current levels, is it worth the risk?

    In any case, it appears that yesterday’s thoughts were on target.

    SPX looks like it’s pushing above last Thursday’s highs…  So often, TPTB miss opportunities to construct IH&S Patterns — helpful in that they result in much less firepower being needed to produce/extend rallies.  FWIW, there will be another opportunity at 2671.

    The bulls should be really, really careful as the backtest unfolds (2612-2625.)  A failure there could translate into a drop to new lows.  And, if things get really ugly, remember this chart from More Where That Came From:

    continued for members(more…)

  • Bullard and Kudlow to the Rescue

    In yesterday’s post we noted that, with multiple indices at or near their SMA200s, it was put up or shut up time for the bears.  In a time-honored tradition, the market was saved from a deeper correction by Fed President Jim Bullard with a notable assist from 6th man Larry Kudlow.

    By declaring that no further rate hikes were warranted in 2018, Bullard got SPX/ES back above their SMA200s.  Kudlow’s insistence that Trump was just joshing with all that trade war talk got both back above their SMA10s and helped ES break out of its falling channel, where it’s currently showing a 13.50-pt gain.

    This was an important stick save, so the starters were left in the game until the outcome was certain.  VIX broke down, the yield curve bounced, oil and gas rebounded, and USDJPY broke out.The fundamentals haven’t changed one iota.  In fact, the 10Yr gapped back into the territory that made stocks nervous in the first place.  But, in a market that continues to be so heavily swayed by algorithms, that’s not necessarily important…for now.

    Bullard and Kudlow are obviously very keen on propping up stocks — much in the vein of Bernanke and Yellen.  It remains to be seen whether Powell will follow his predecessor’s lead or let markets sort themselves out.

    continued for members(more…)