Year: 2017

  • A Little Capitulation?

    All eyes remain on oil, this morning.  With the EIA inventory report coming out, we shouldn’t have to wait long for the final capitulation.

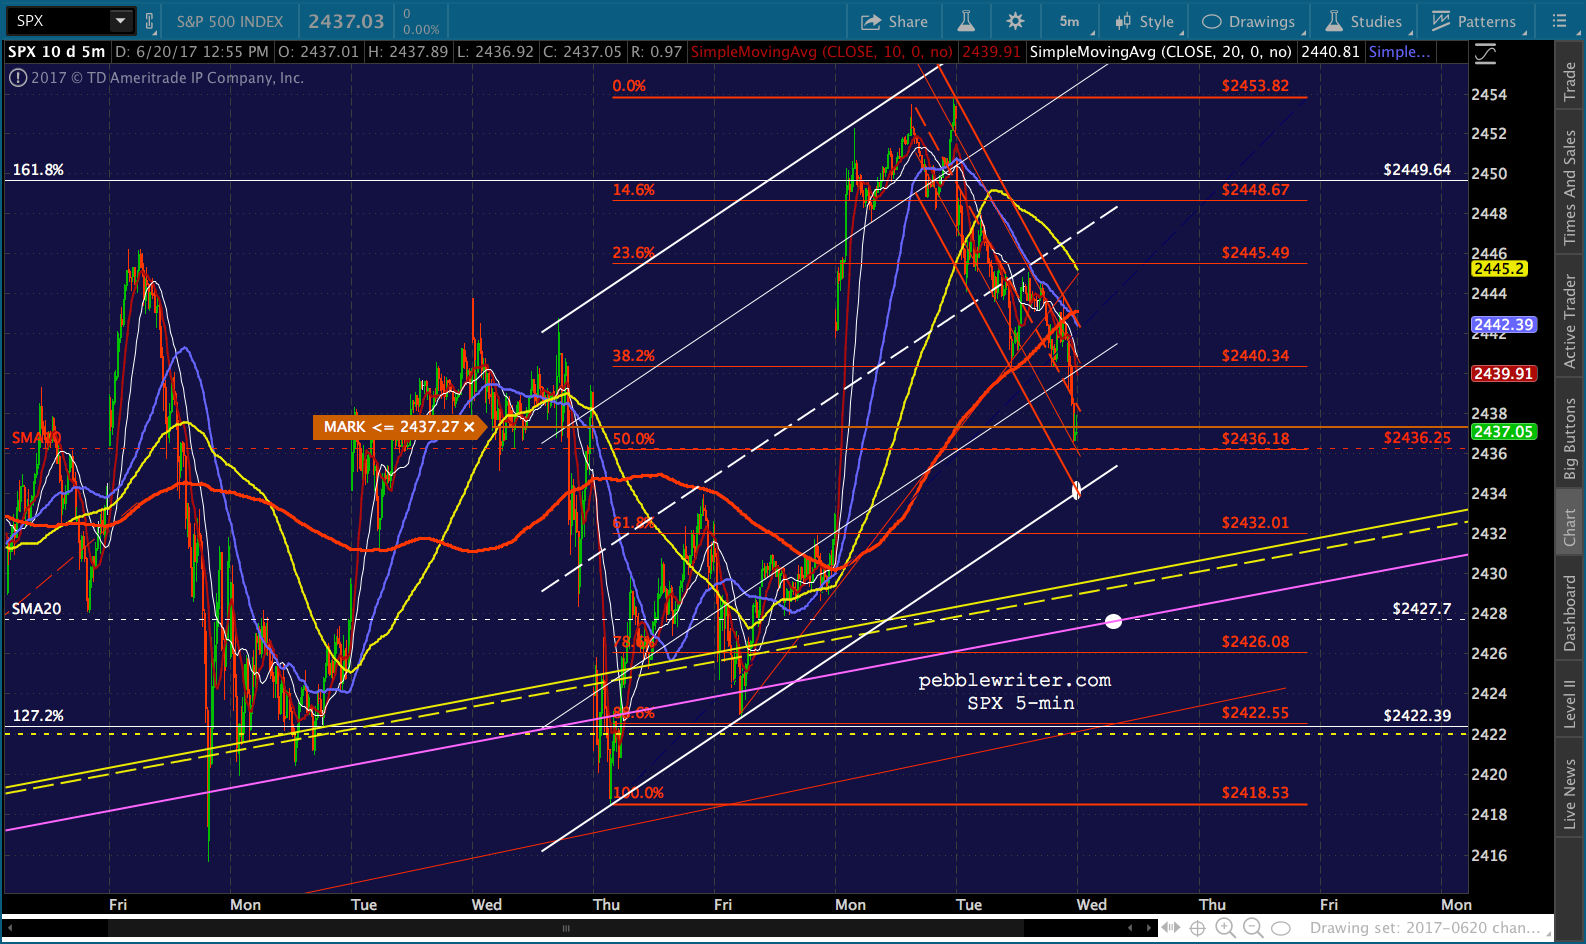
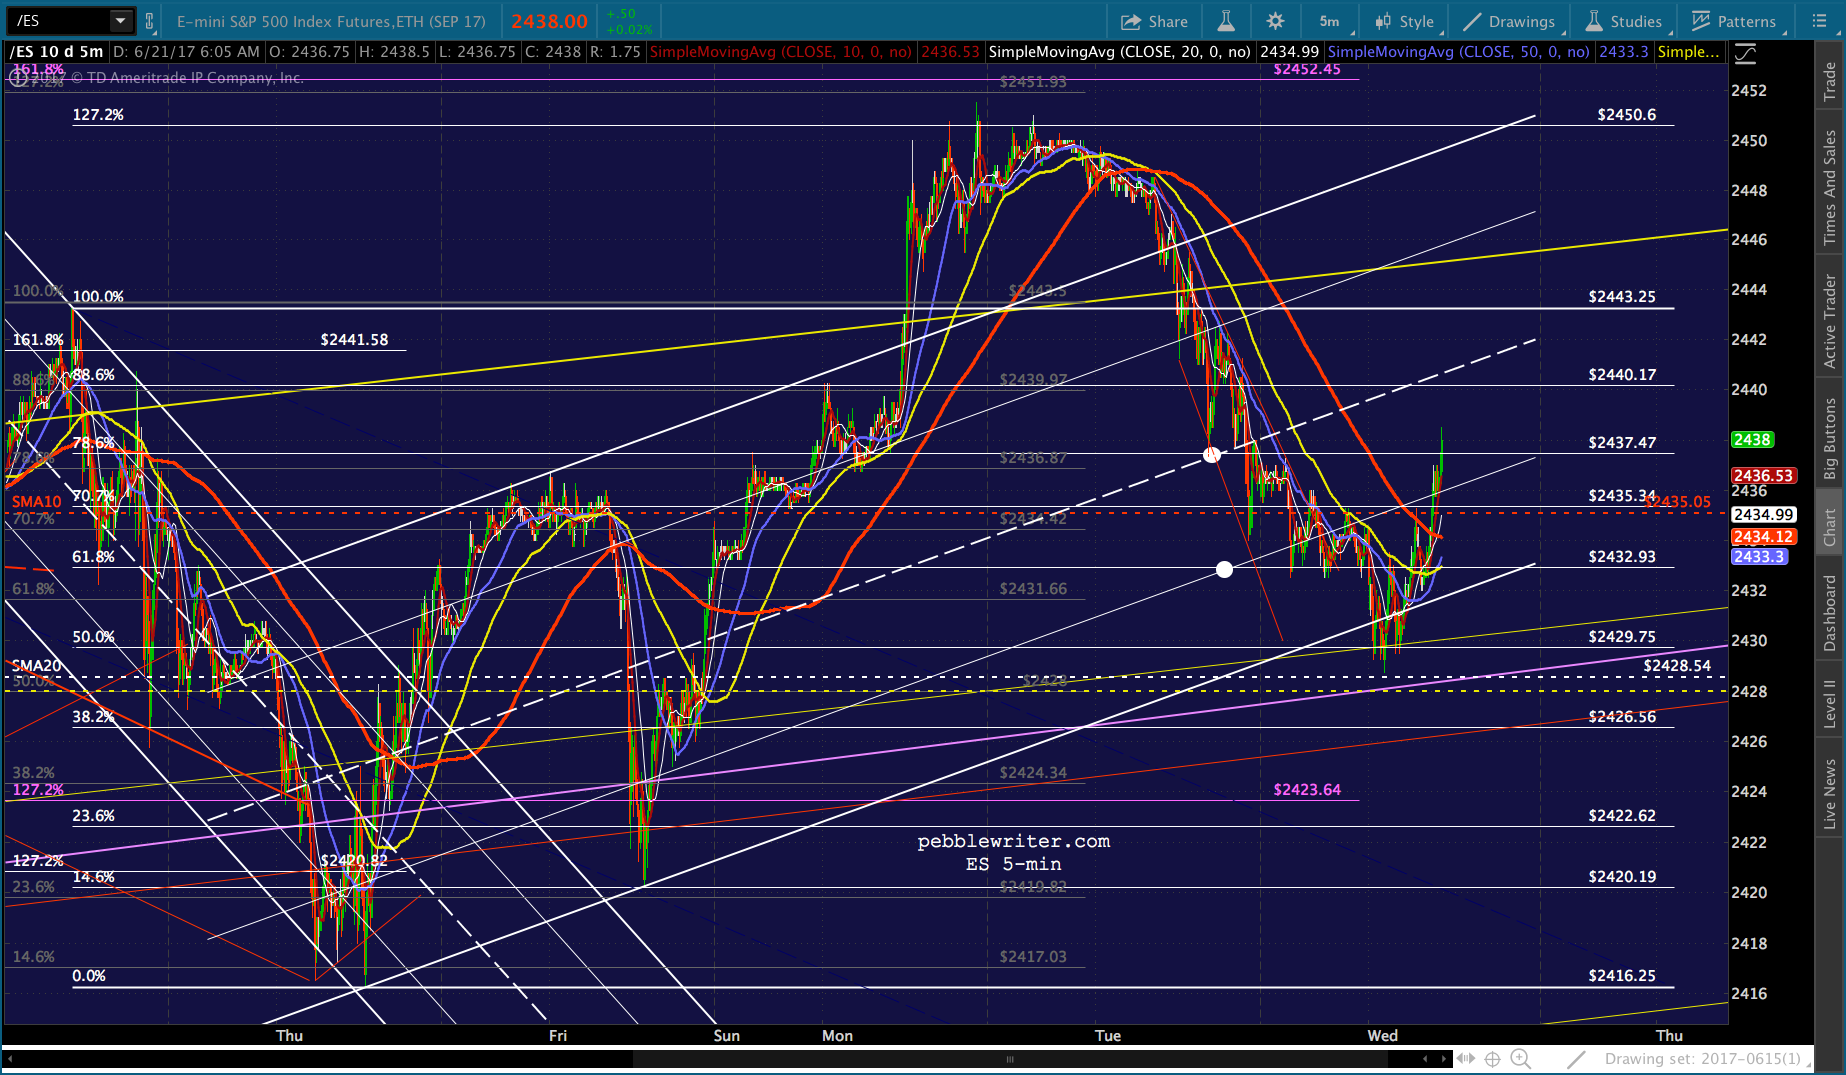
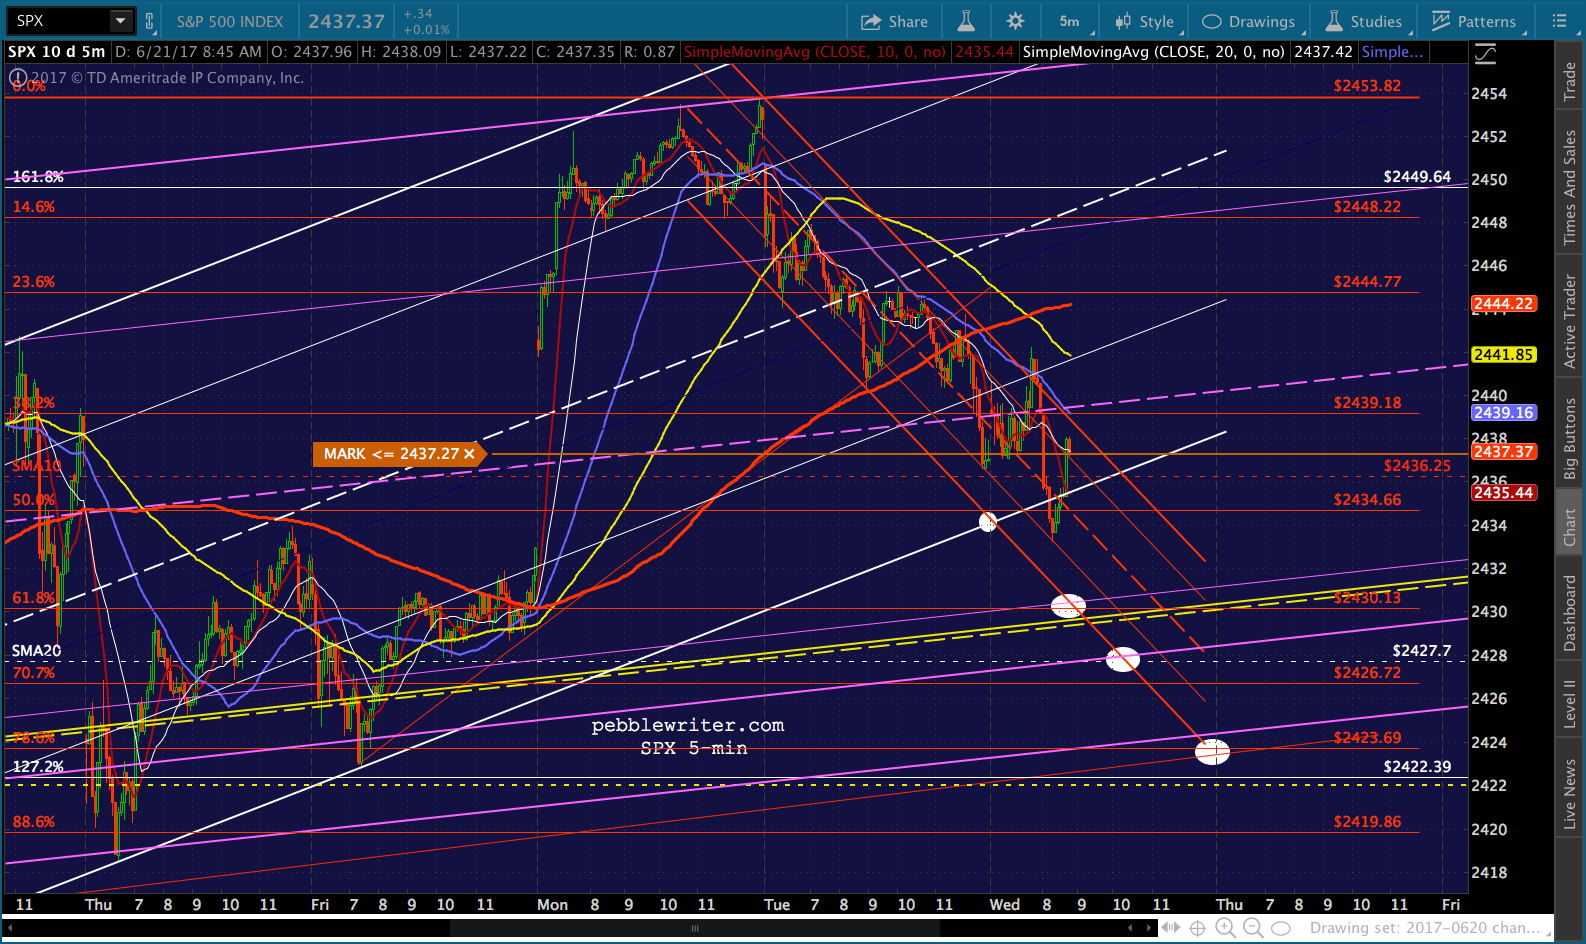
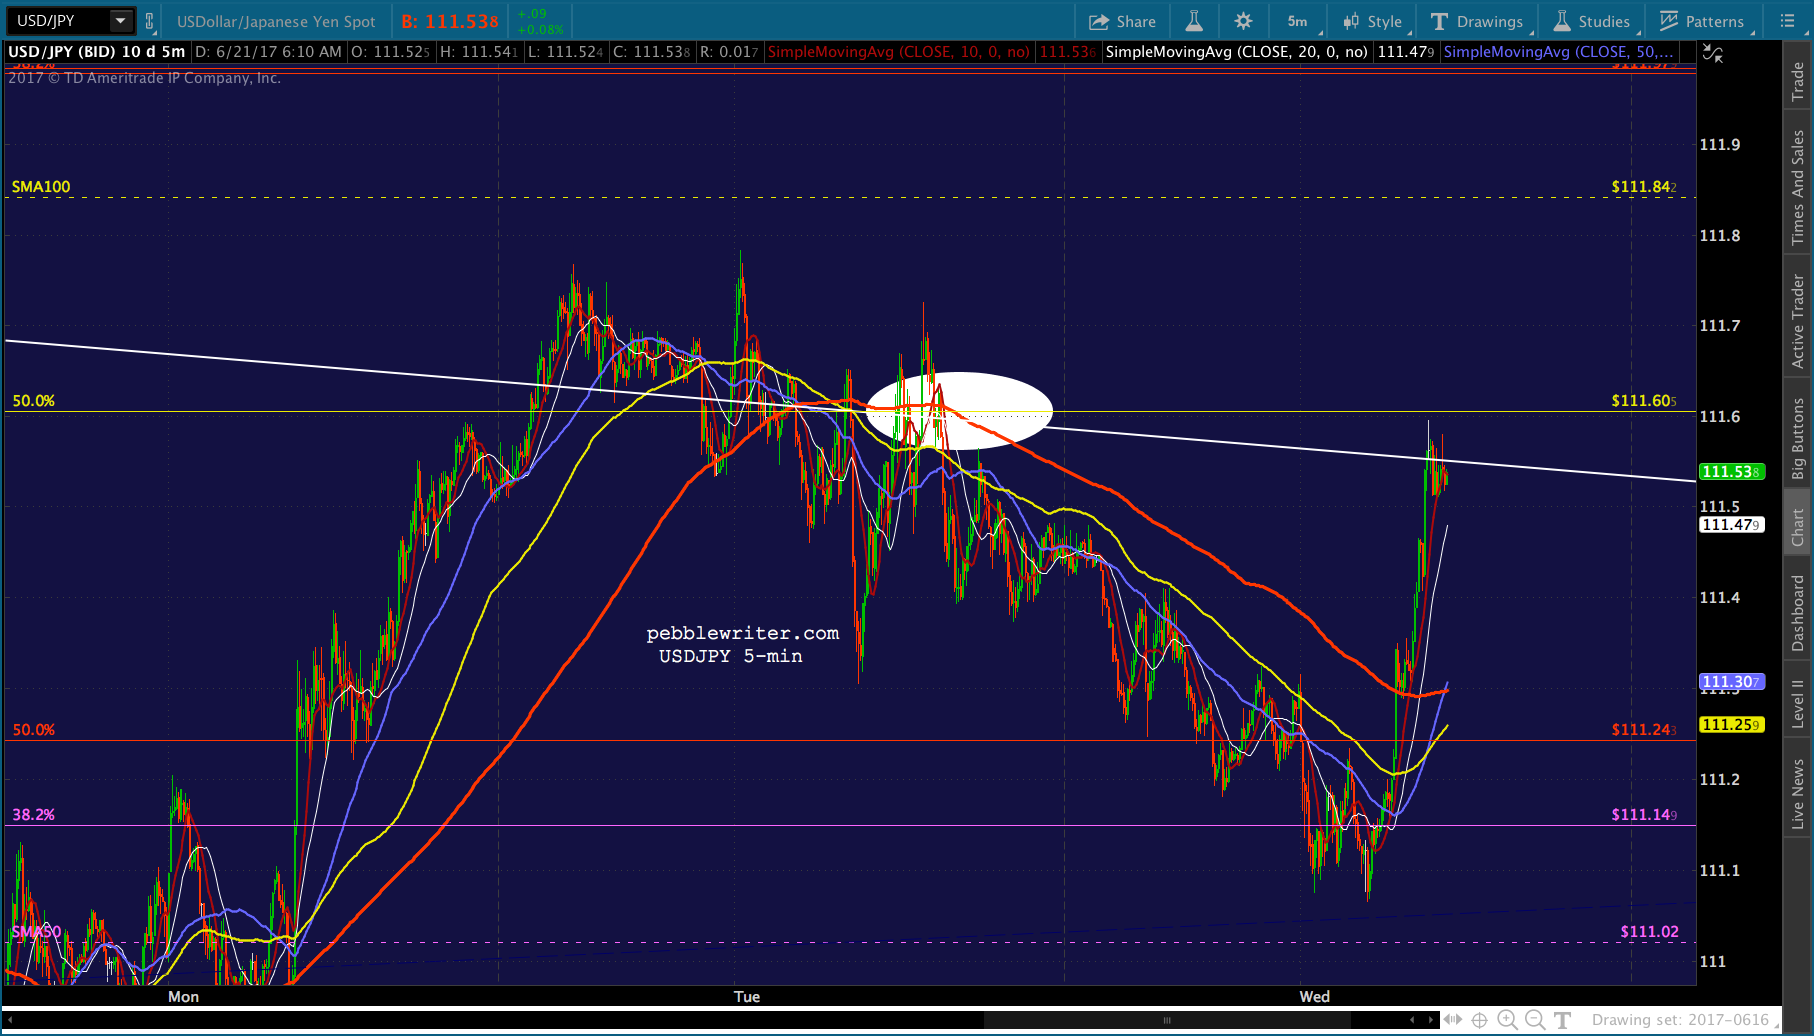
    Futures are getting a jump start, as ES has rallied 10 points — back to even – on a sudden spike in USDJPY back to channel resistance.SPX got within 2 points of our downside target yesterday.  Will it be able to hold?
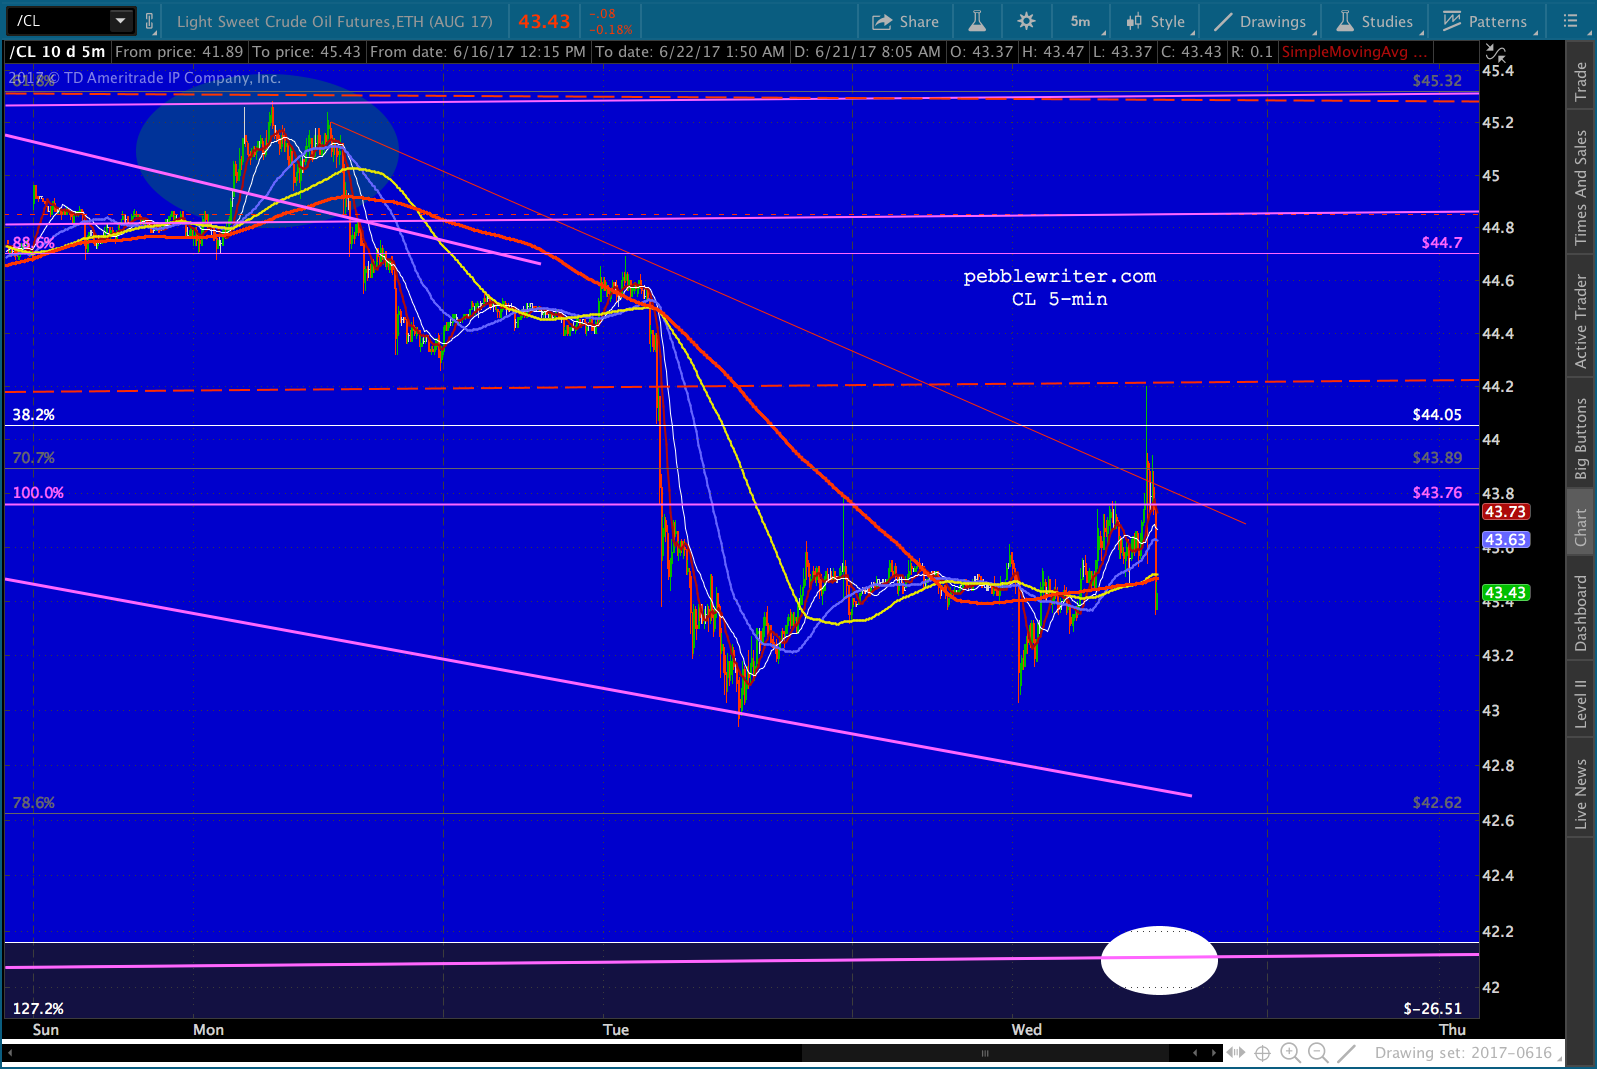
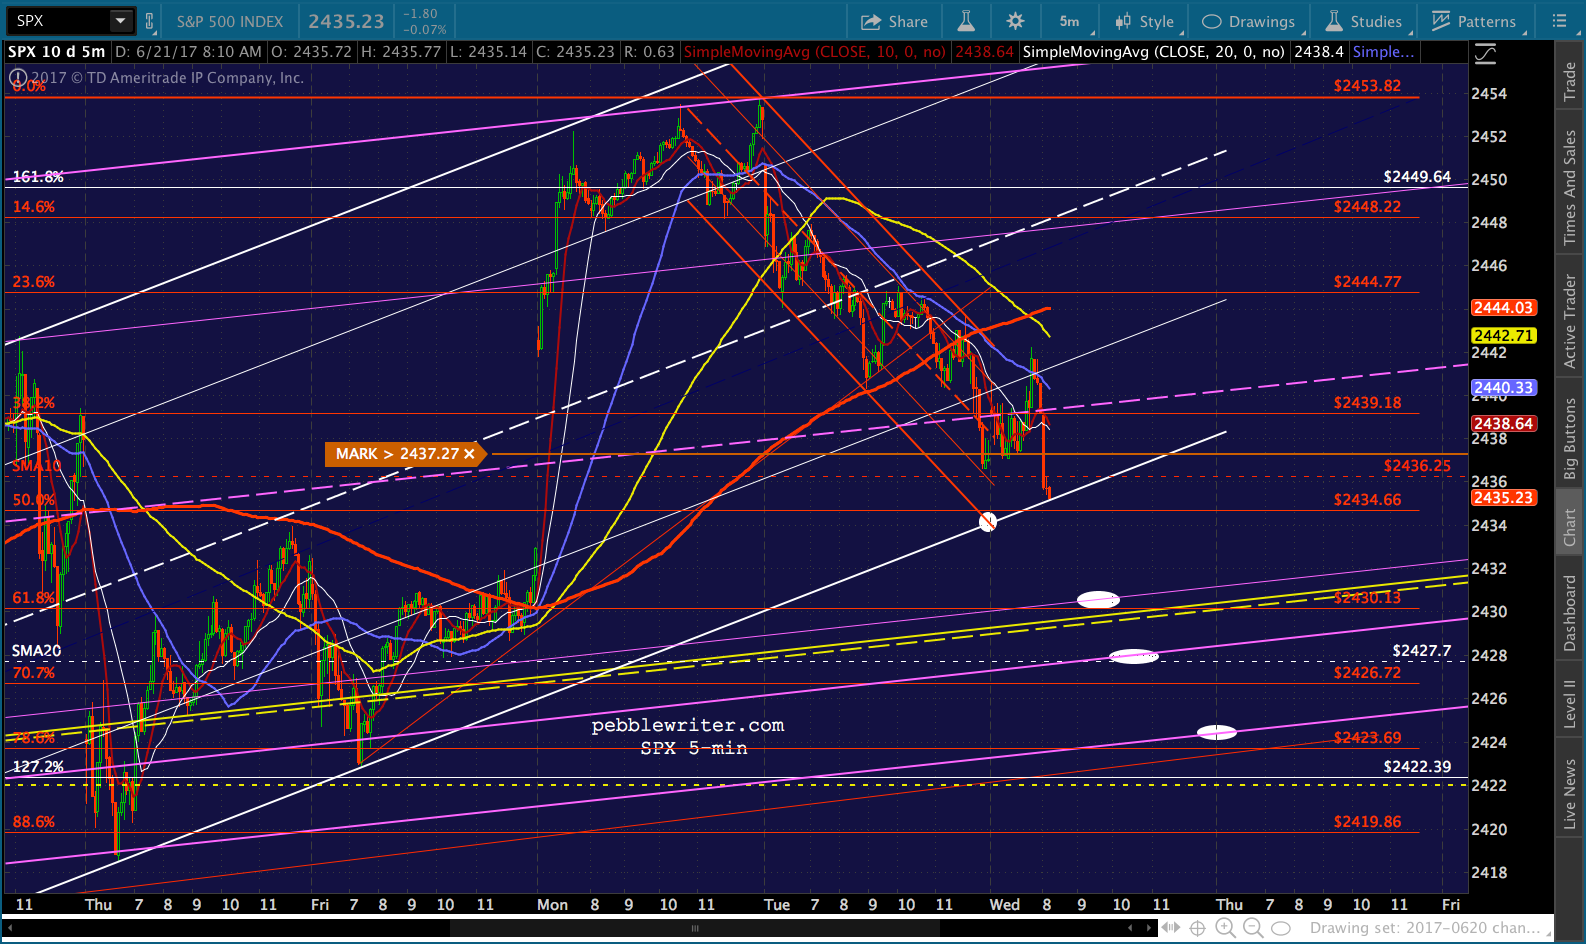
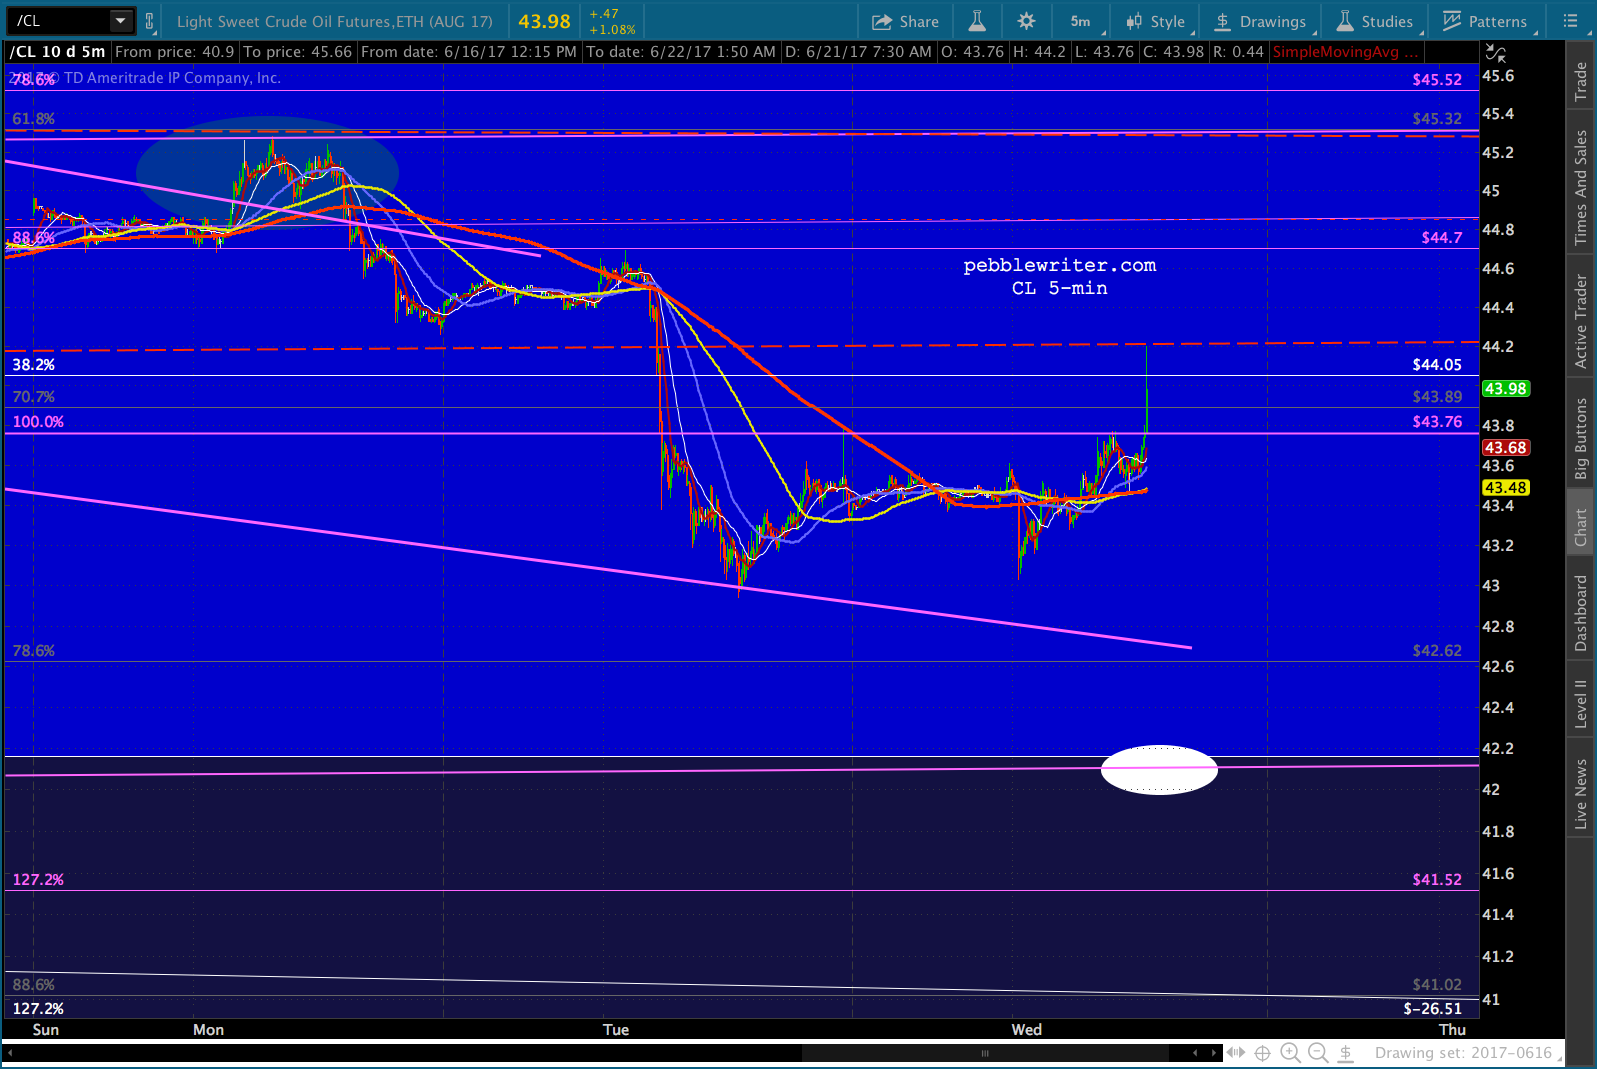
    As long as CL reverses at our next downside target — the purple channel bottom at 42ish — SPX should be able to hold 2430 for now.
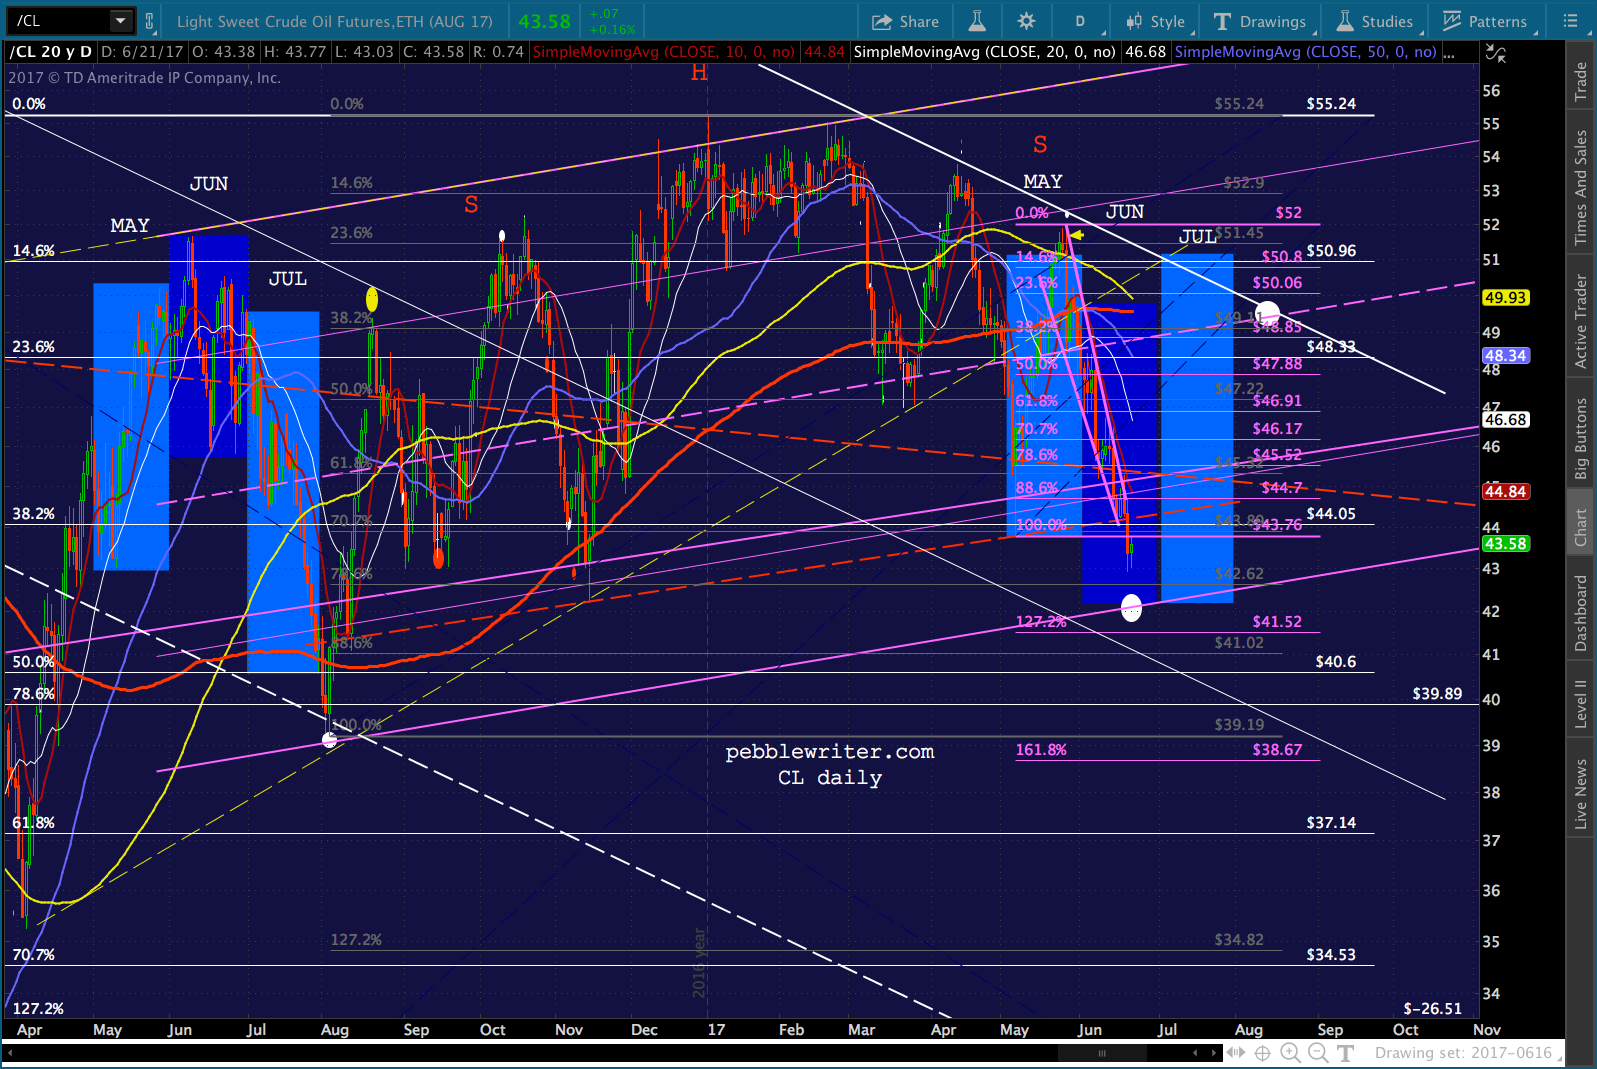
    If not, look out below.

    continued for members

    Though, if the white channel doesn’t hold, there is another one (shown in purple below) that would work just as well.  The only problem is it offers multiple downside targets, so things could get messy.ES is back above its SMA10.
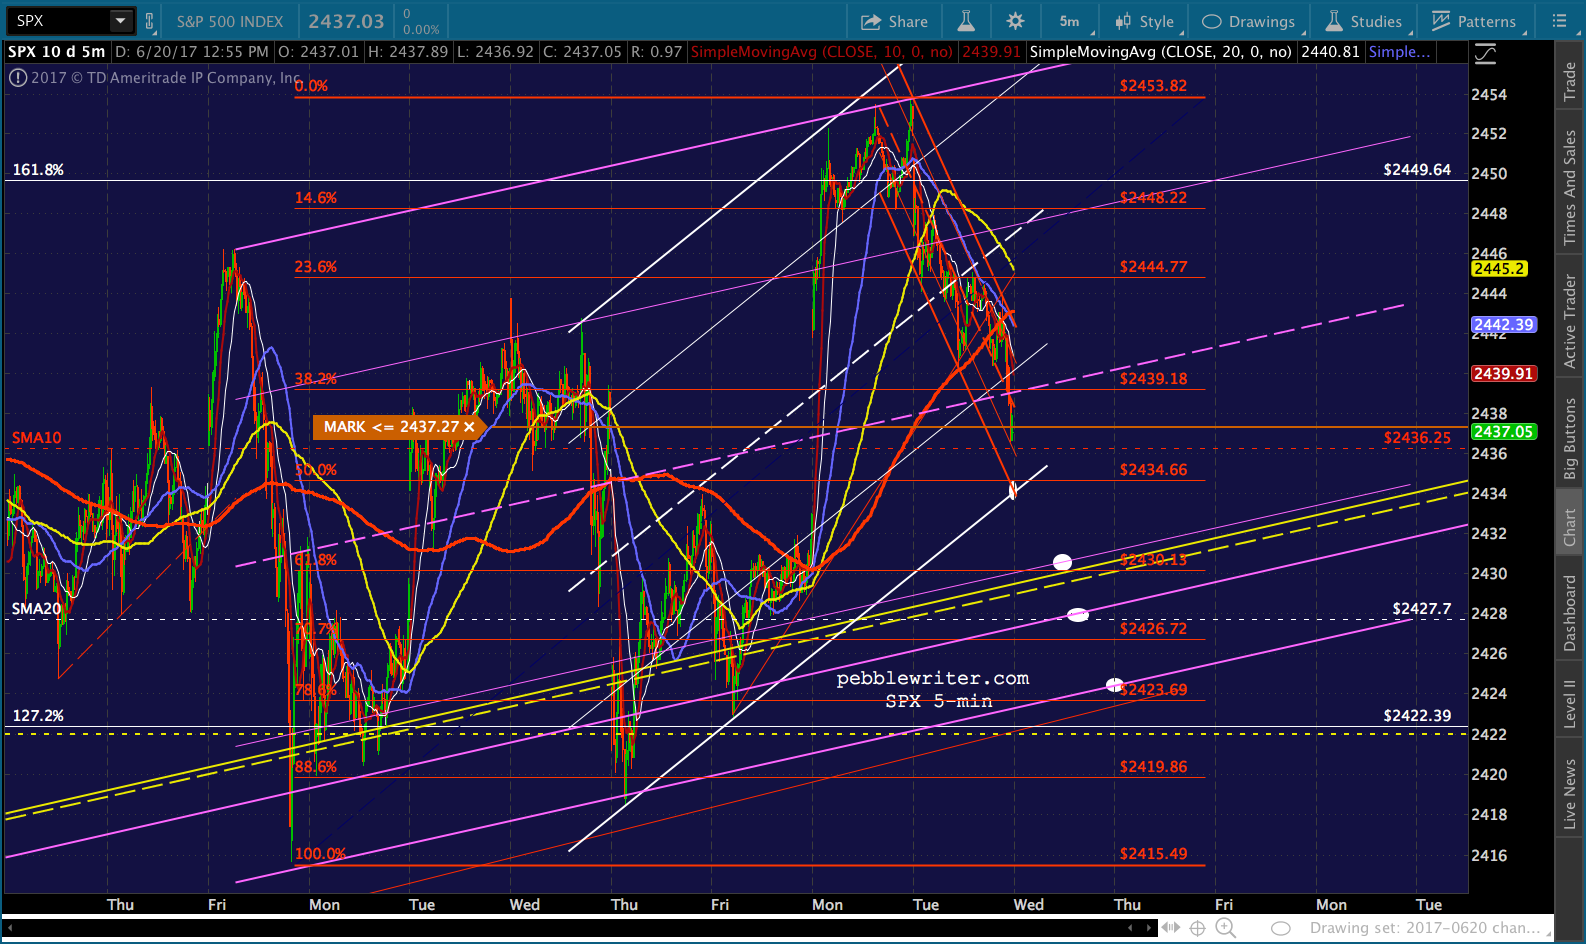
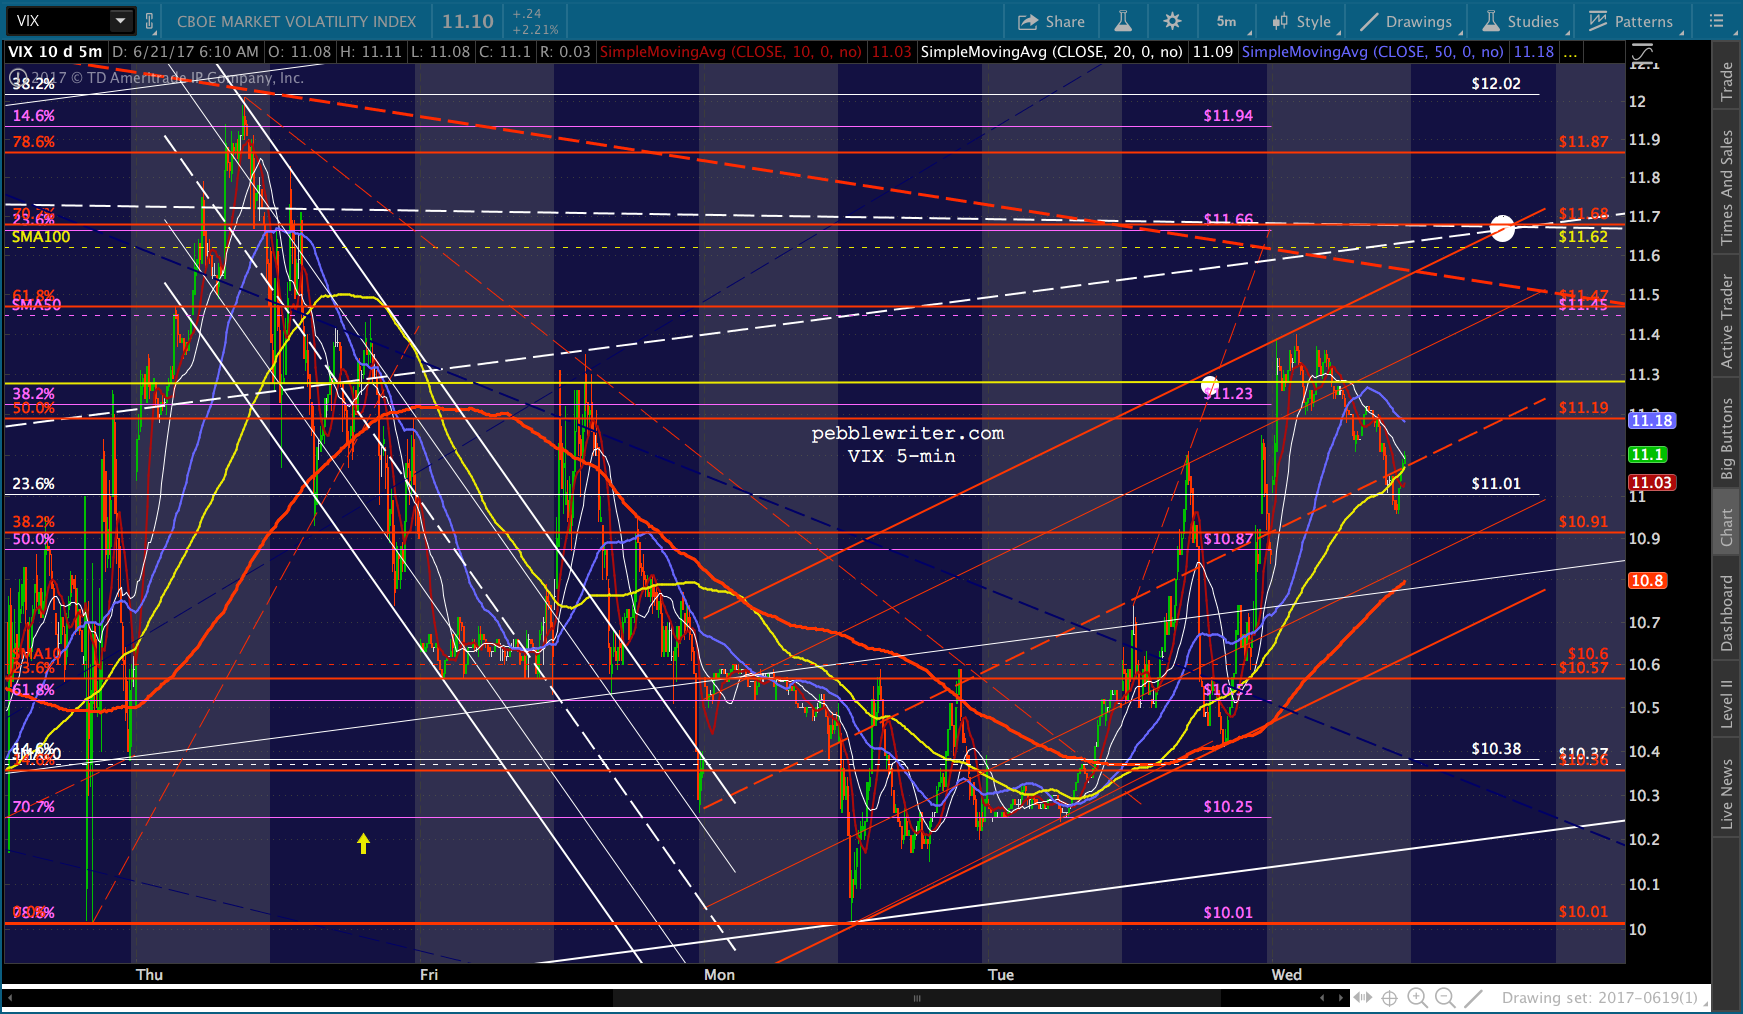
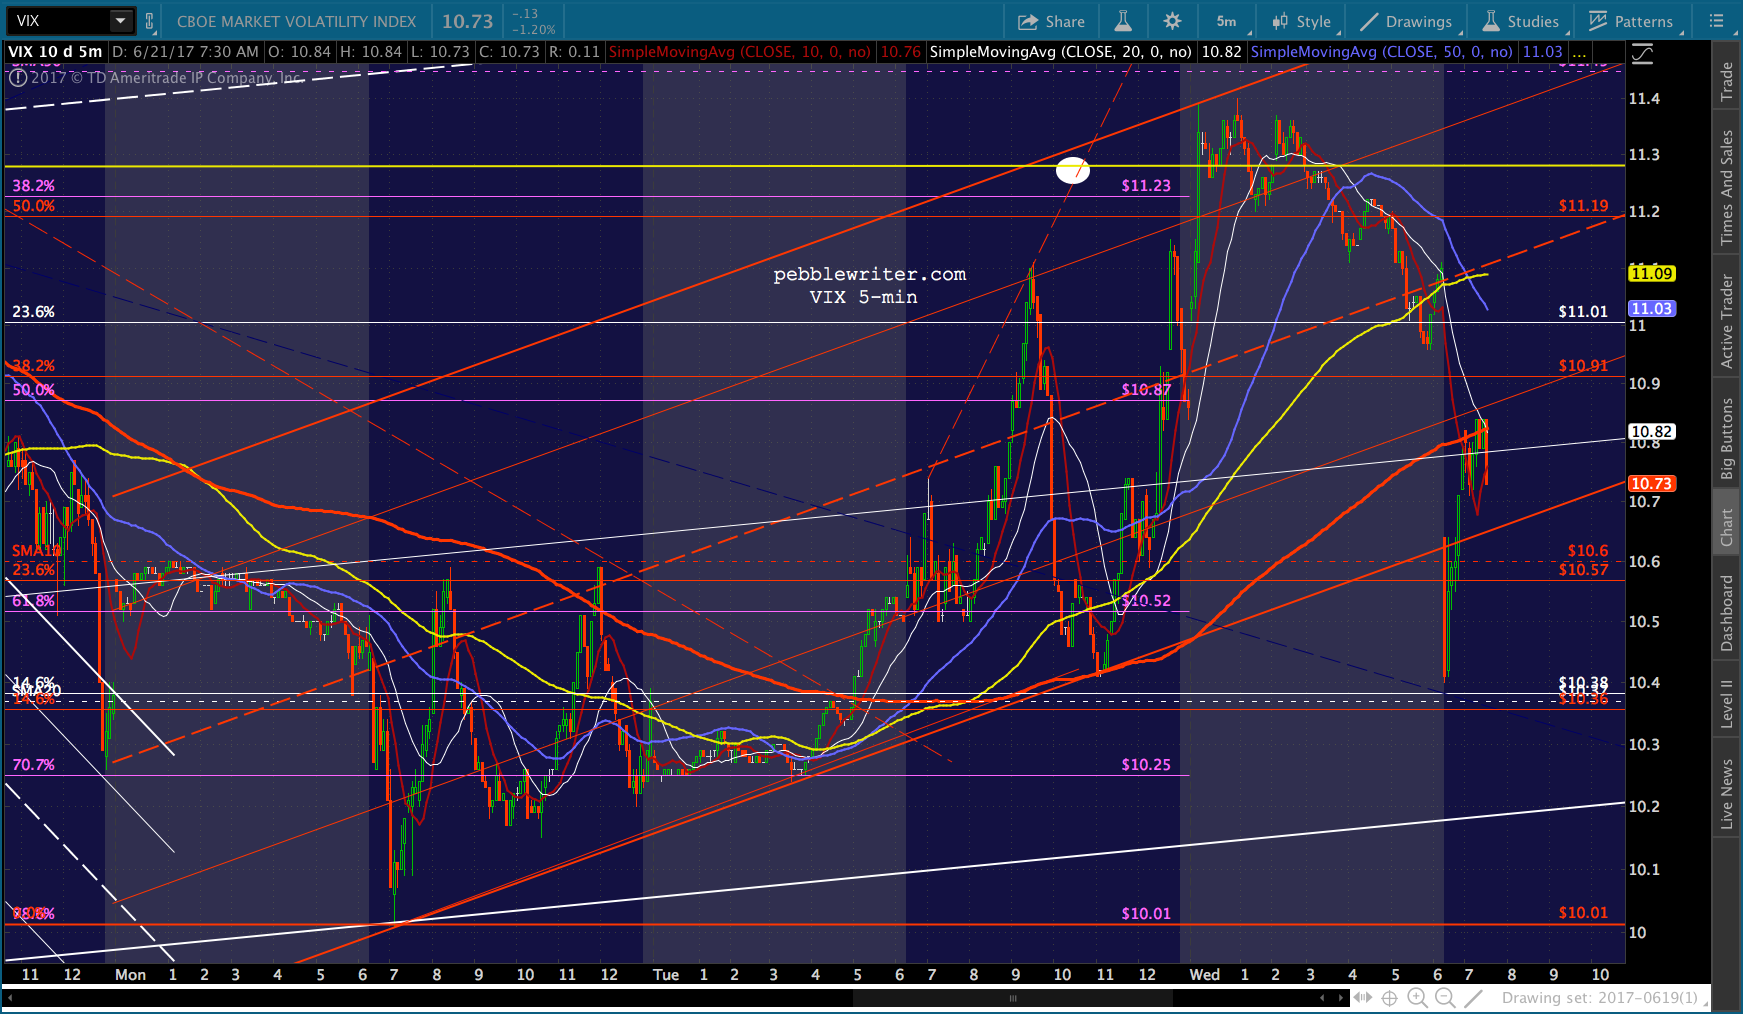
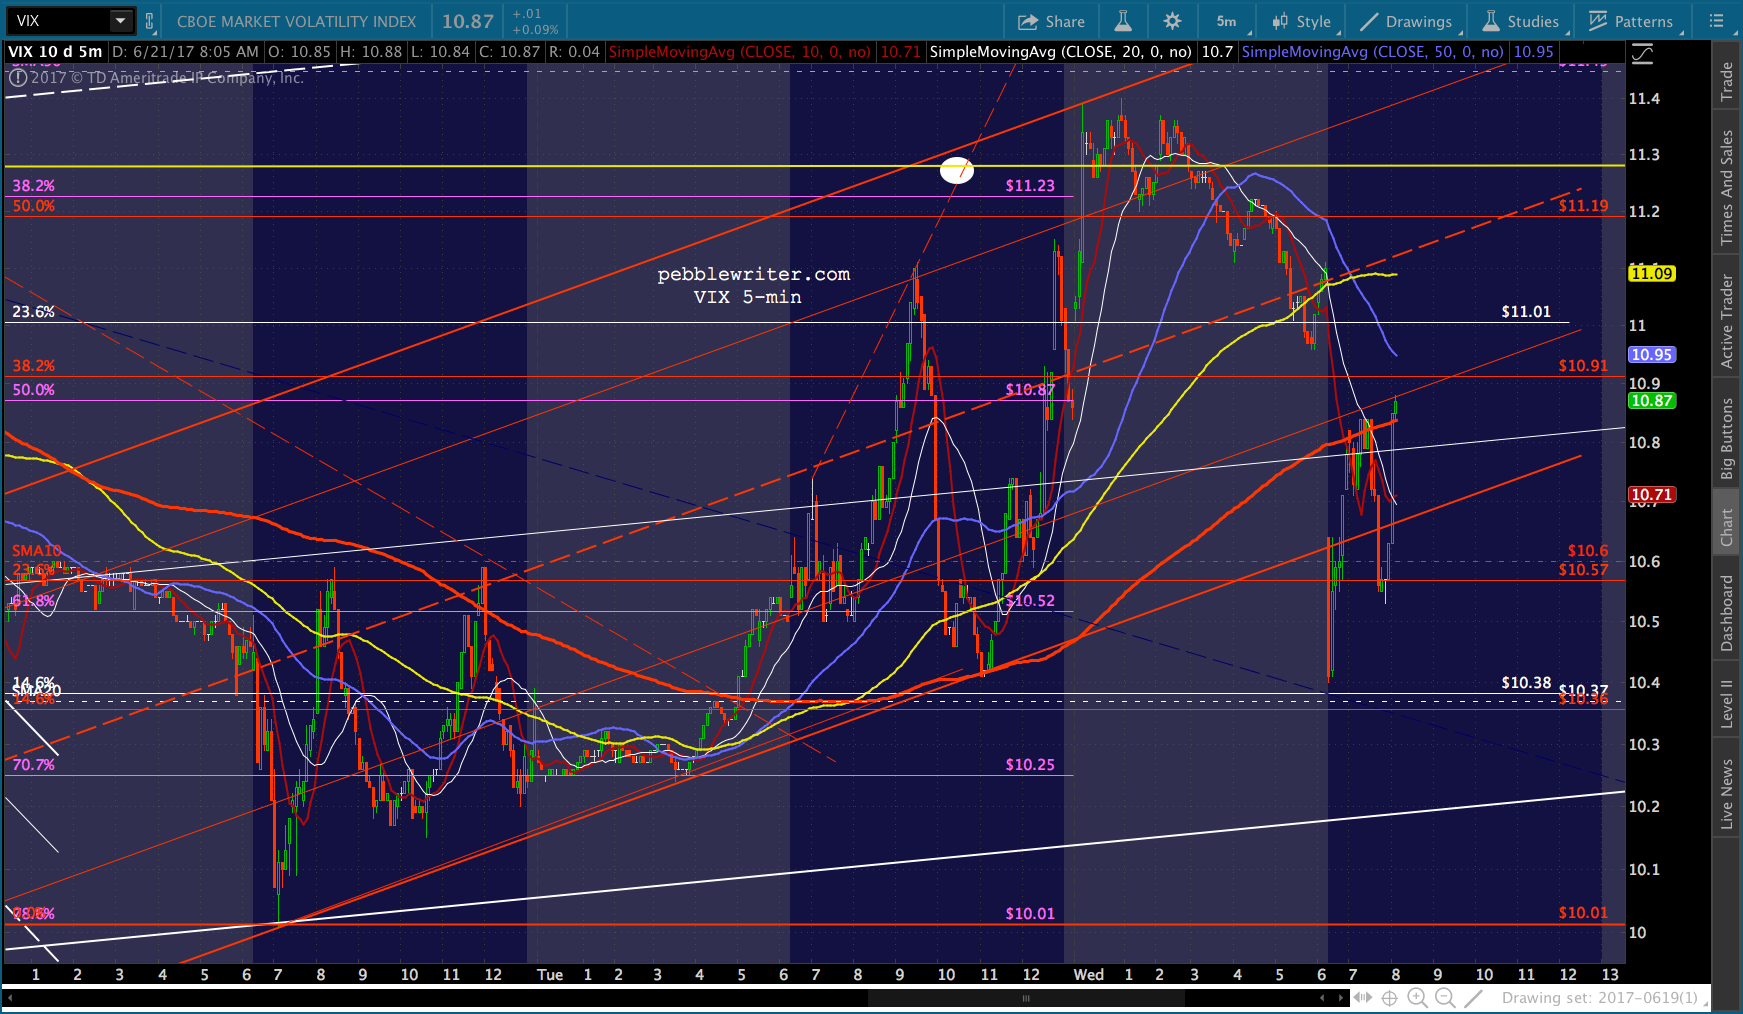
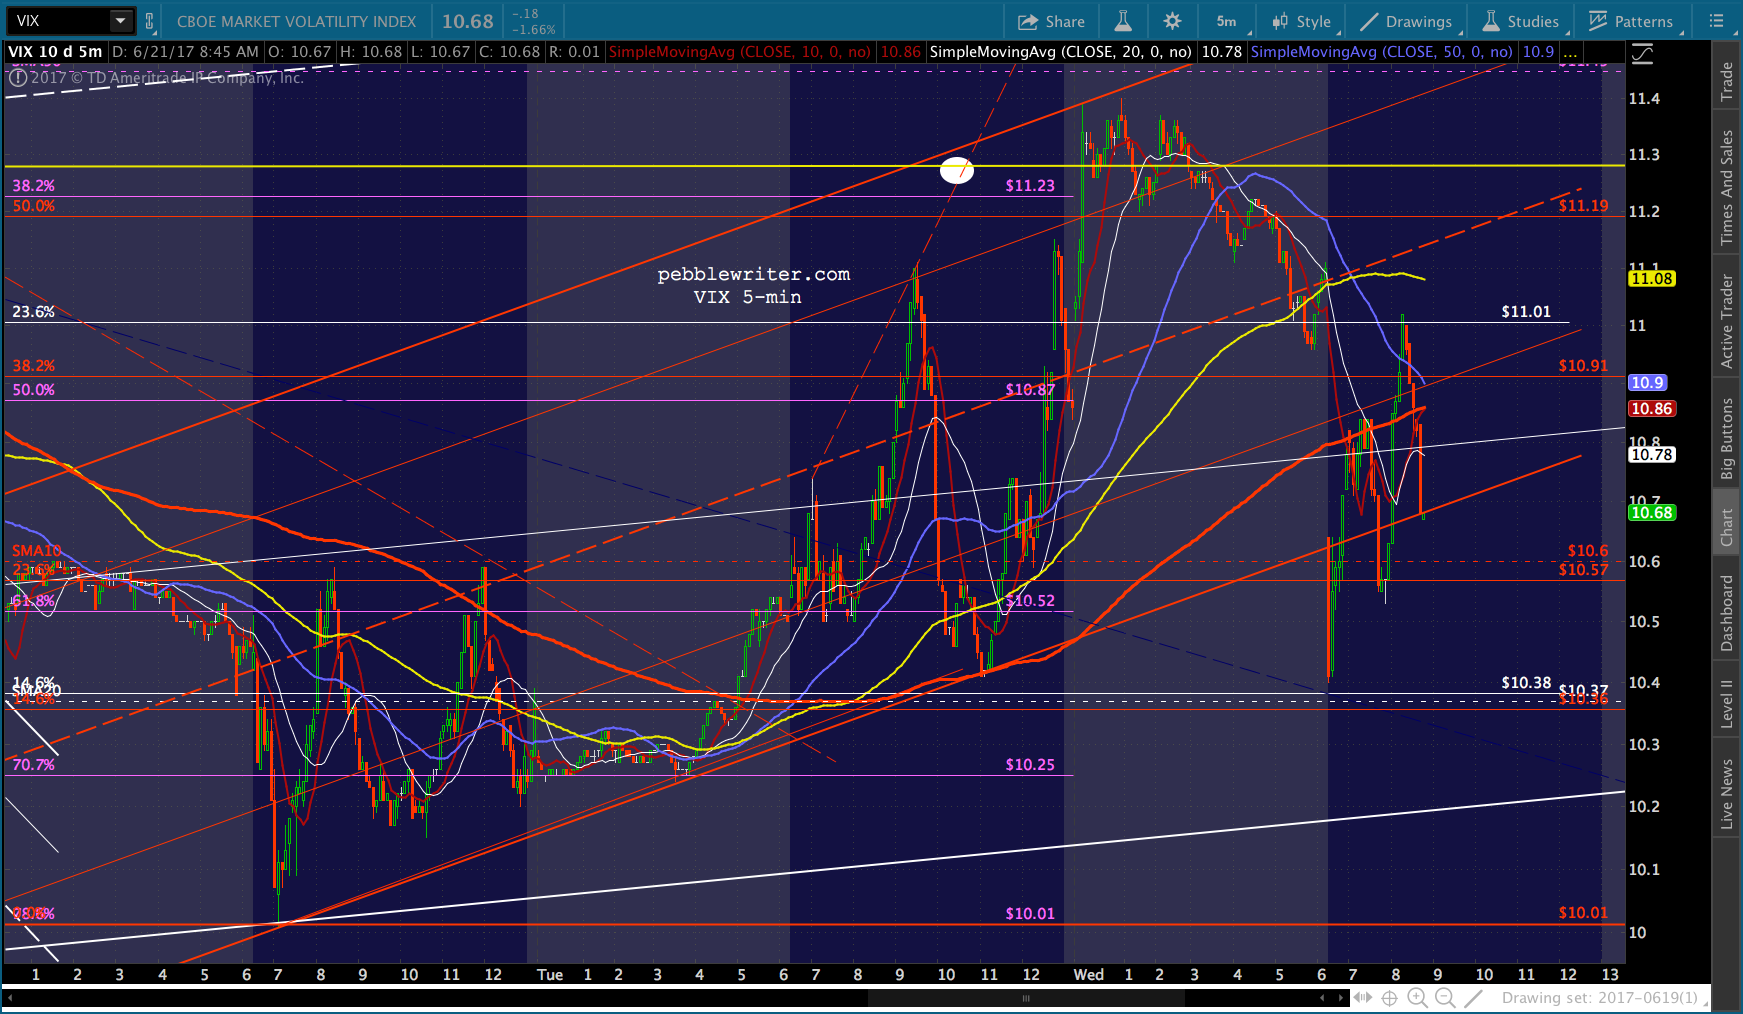
    VIX has enough space on the upside to effect at least a small drop before running into the yellow channel bottom.  If a larger backtest is desired, it would even run up to 11.7 without upsetting things too much.But, I would expect SPX’s yellow channel top to bend but not break.  It would be worth starting out short just in case 2434 doesn’t hold.  But, keep those stops tight just in case.
    UPDATE:  9:32 AM

    A good entry point…But, sheesh, look at VIX — pretty unbelievable.UPDATE:  10:32 AM
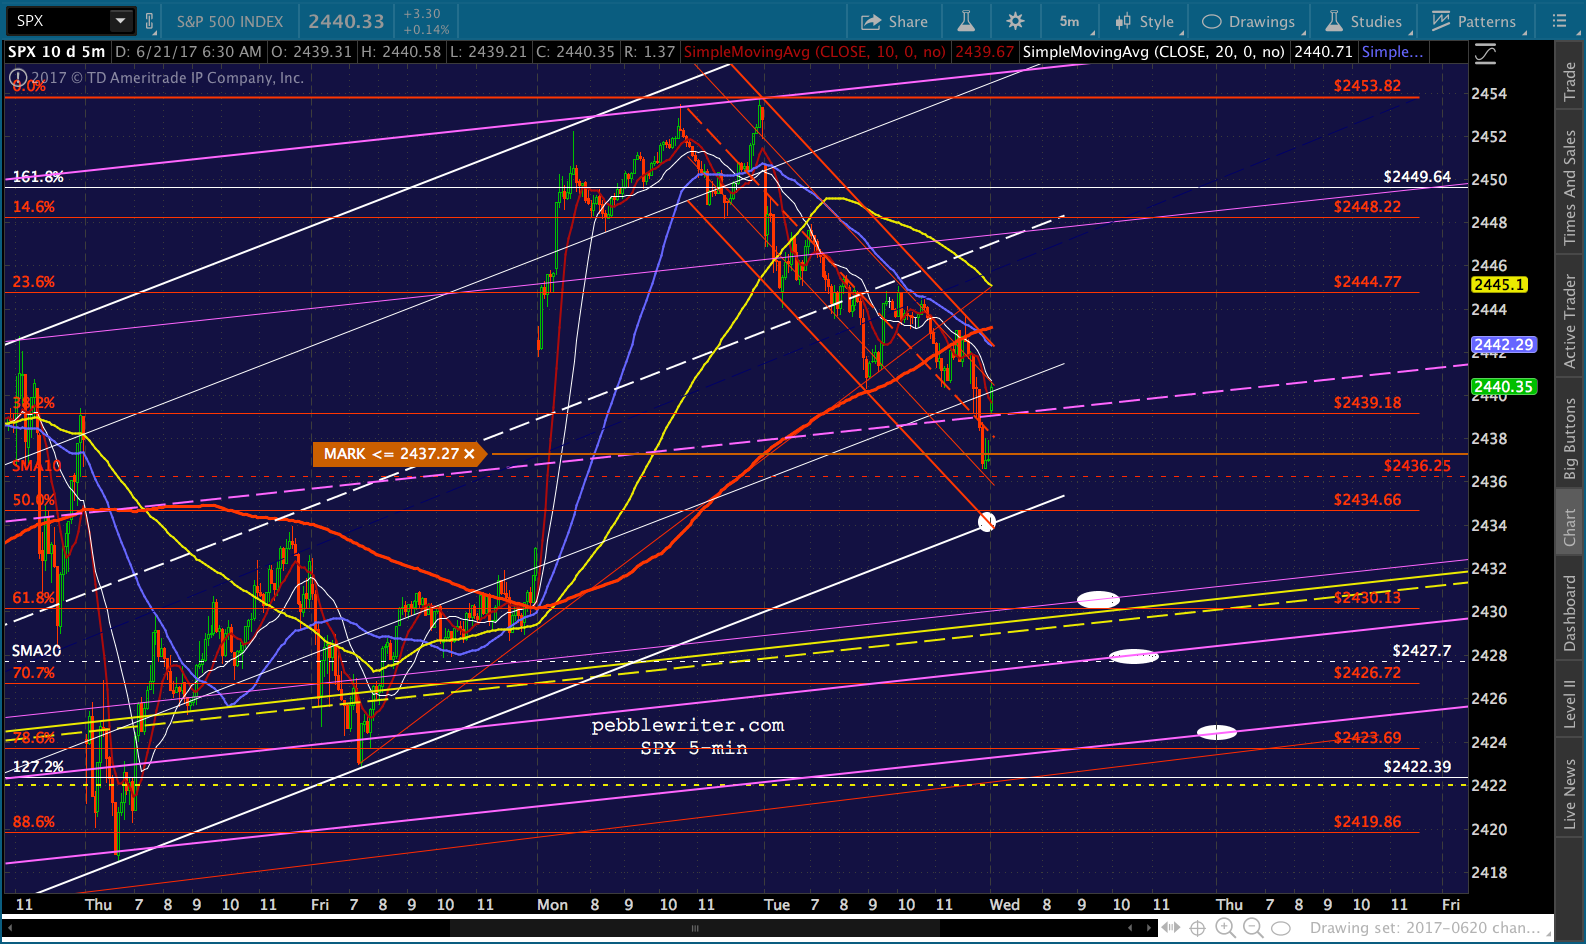
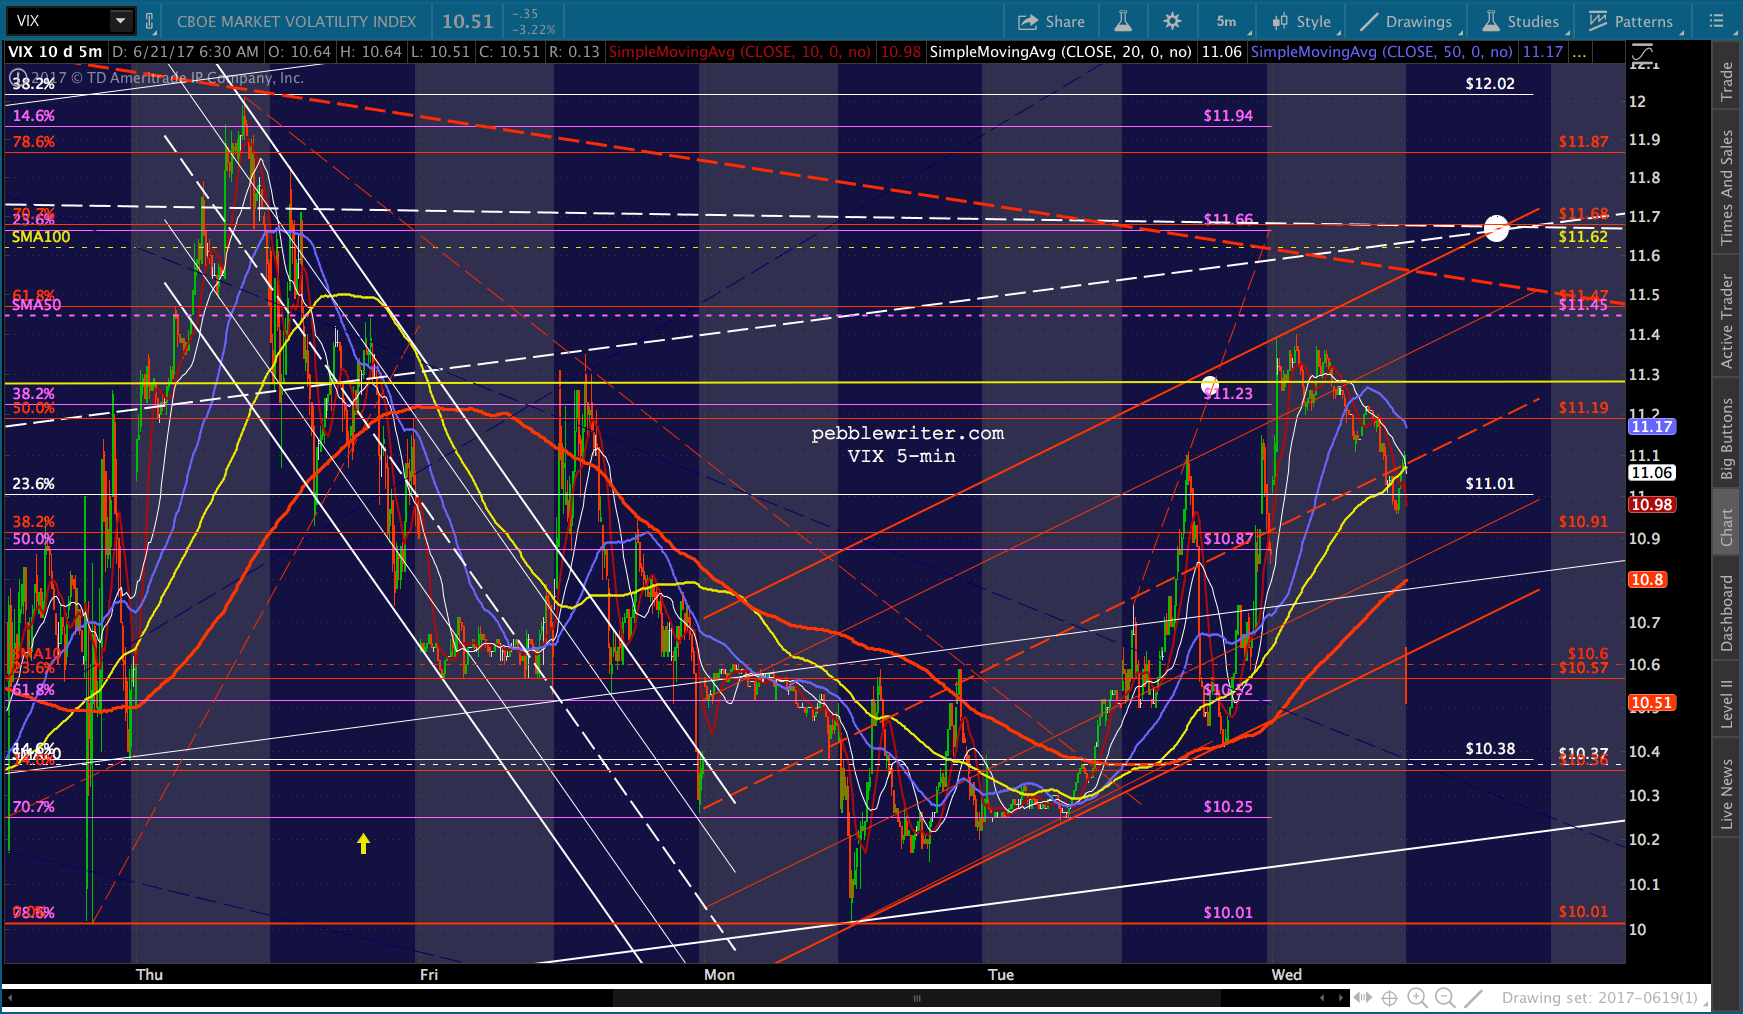
    The report was mildly positive, and CL got a little bounce up to the neckline, pushing SPX slightly higher.  We’ll see if it sticks.  This would be a whole lot cleaner if they would just let SPX tag at least the SMA10 and CL the channel bottom! VIX isn’t waiting around.  It’s sliding, which is helping to prop up SPX.  Watch for it to toggle around the SMA10, depending on what signal is desired.The EIA report…at -2.5MM barrels, not quite as positive as the API at -2.72.  Gasoline showed a 600K draw versus API’s 346K build.
    UPDATE:  11:12 AM

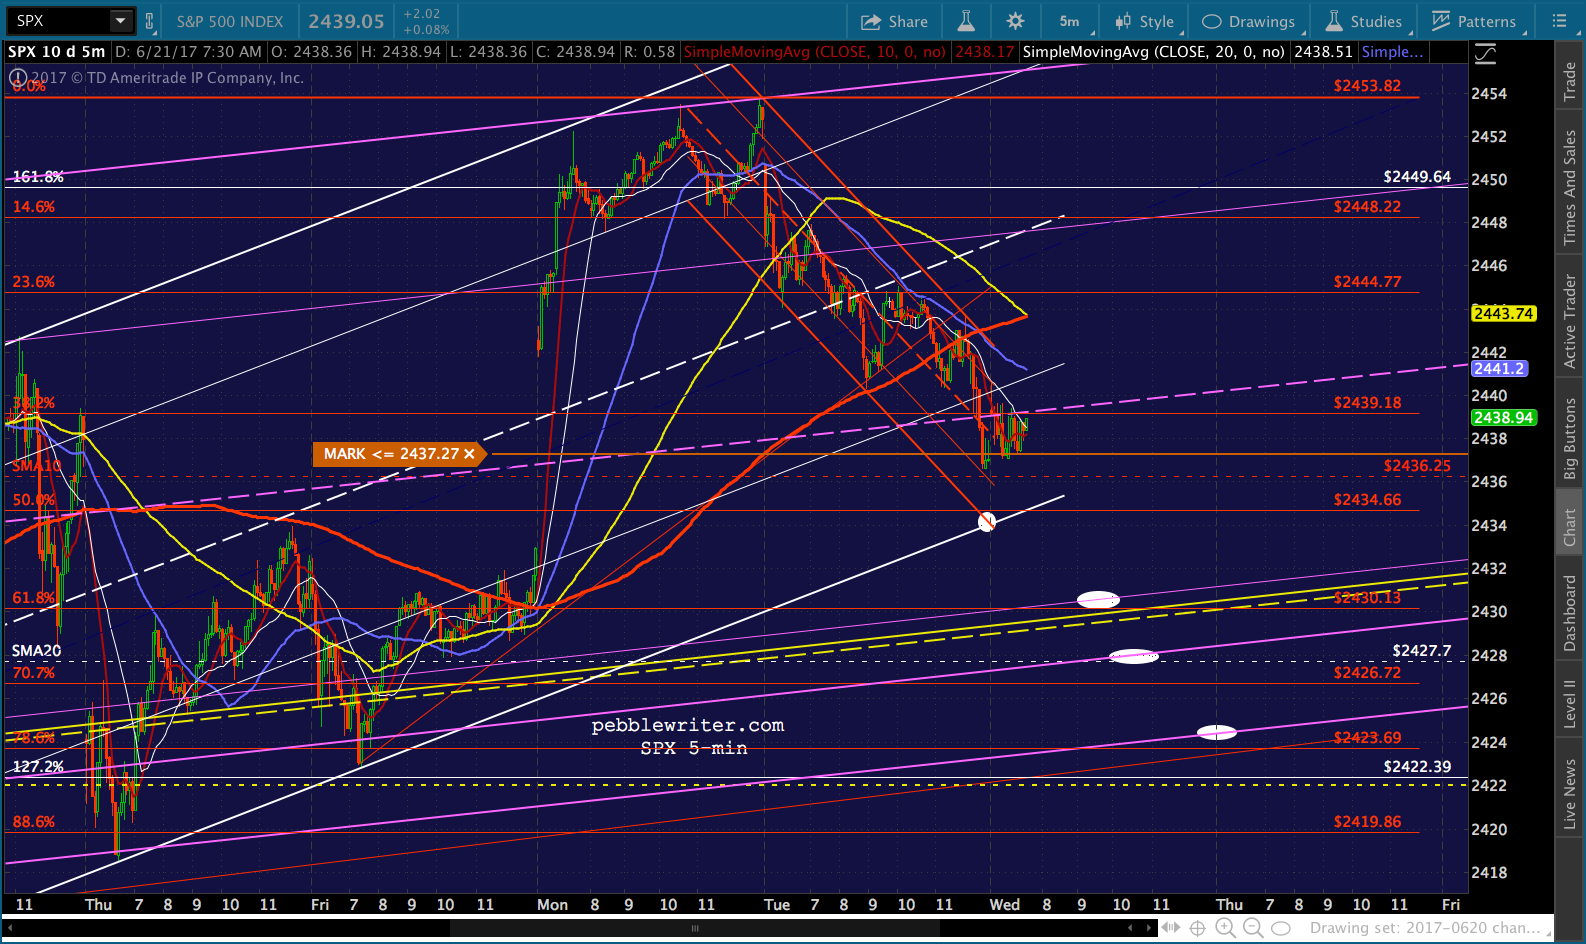
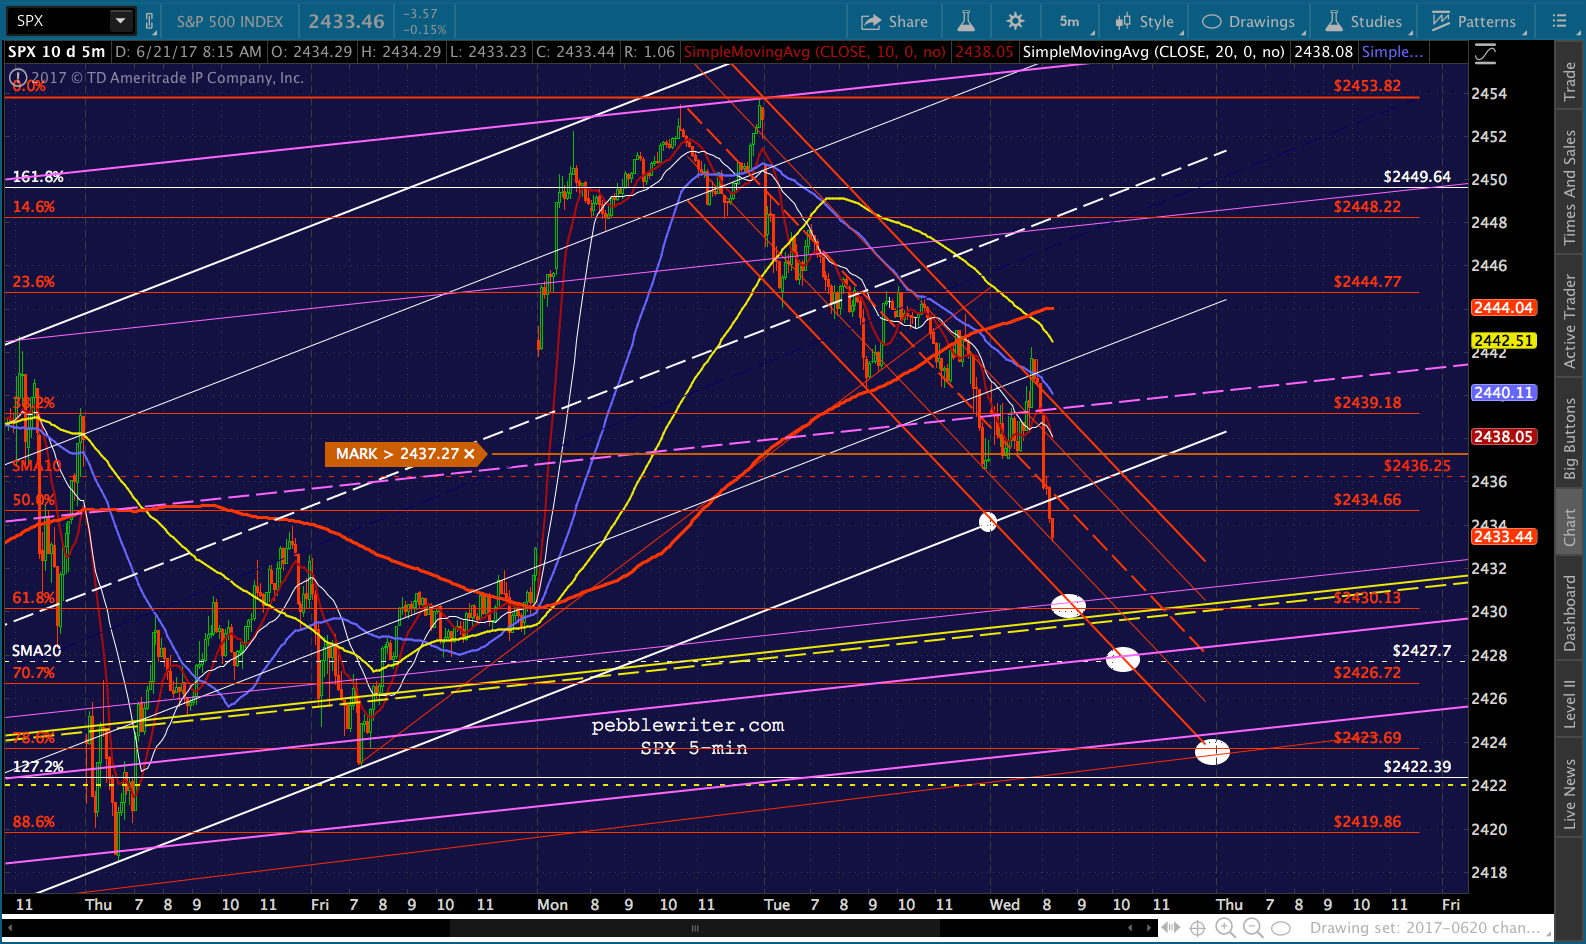
    Better late than never, I suppose.  We’ll call this the channel and SMA10 tag.  Decent possibility that SPX will bounce, though CL still has downside potential to 42.11 — meaning SPX isn’t done yet.  At the very least, tighten up stops here. My preferred target is 2430 at 11:40ish.  But, if CL takes its time, inching lower and lower until 42.11, it could spook SPX into a bigger drop.  The best bet would have been a 3-second spike lower and recovery like we see in VIX all the time.  Oh, well…I don’t know how SPX will be when CL turns, but that’s where I’d want to cover.  Ideally, it’ll be at CL 42.11.  My guess is that translates into SPX 2430 with some aggressive, offsetting VIX smashing, maybe even a USDJPY bounce.
    UPDATE:  11:42 AM

    SPX is pushing back above the white channel bottom and backtesting the SMA10.  I’d cover on any move back through the SMA10, but I’d want to be short below it. UPDATE:  11:49 AM
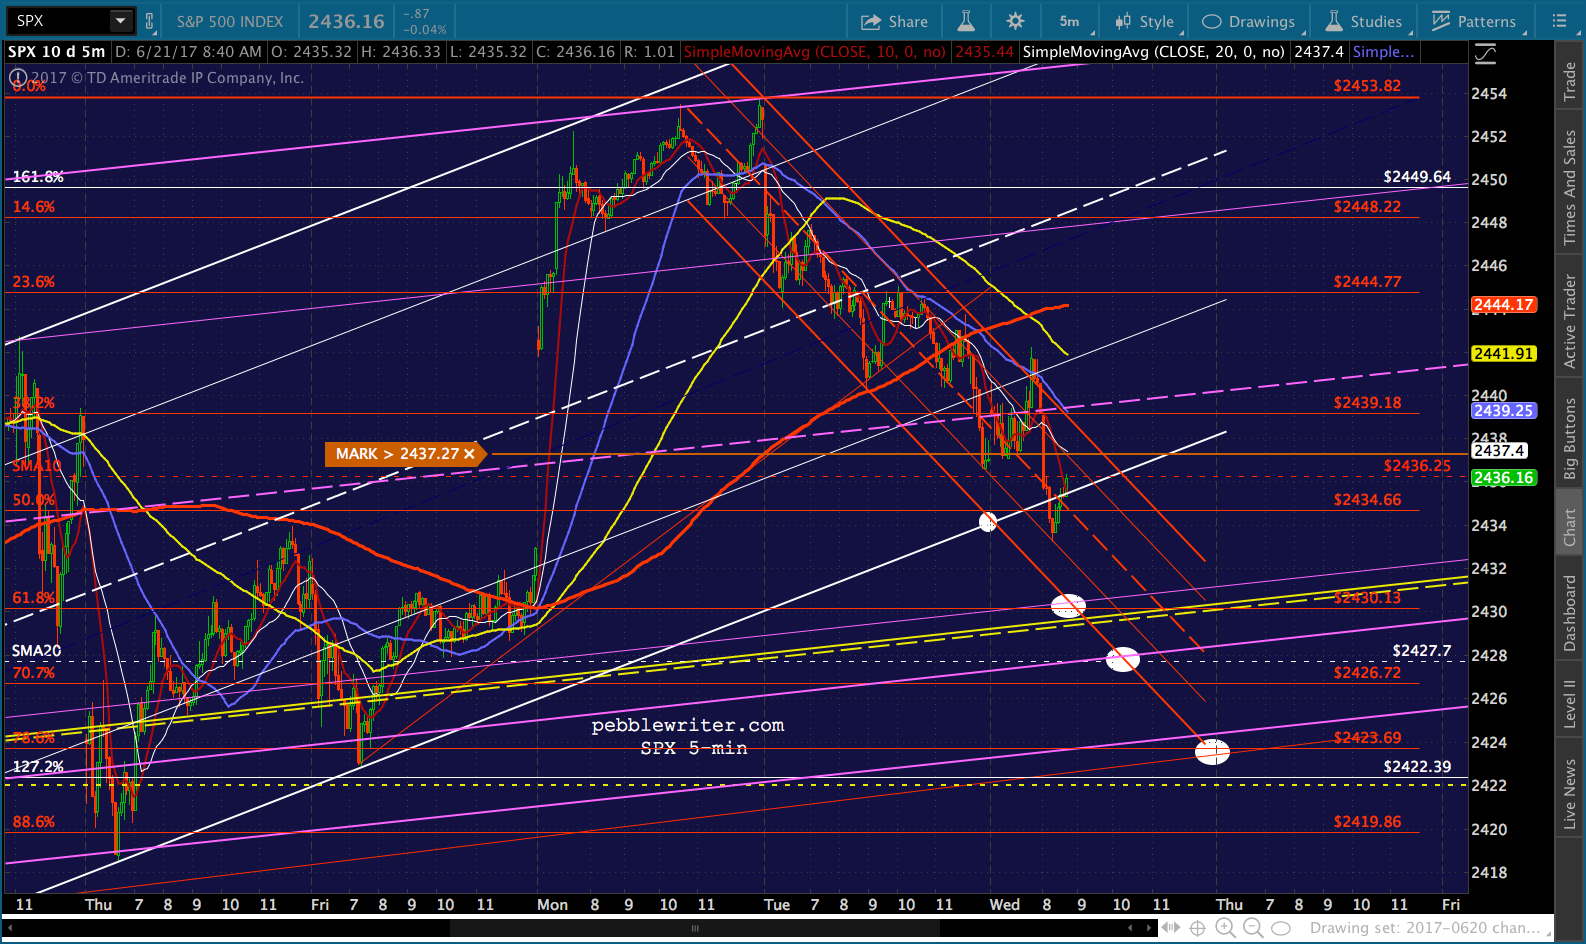
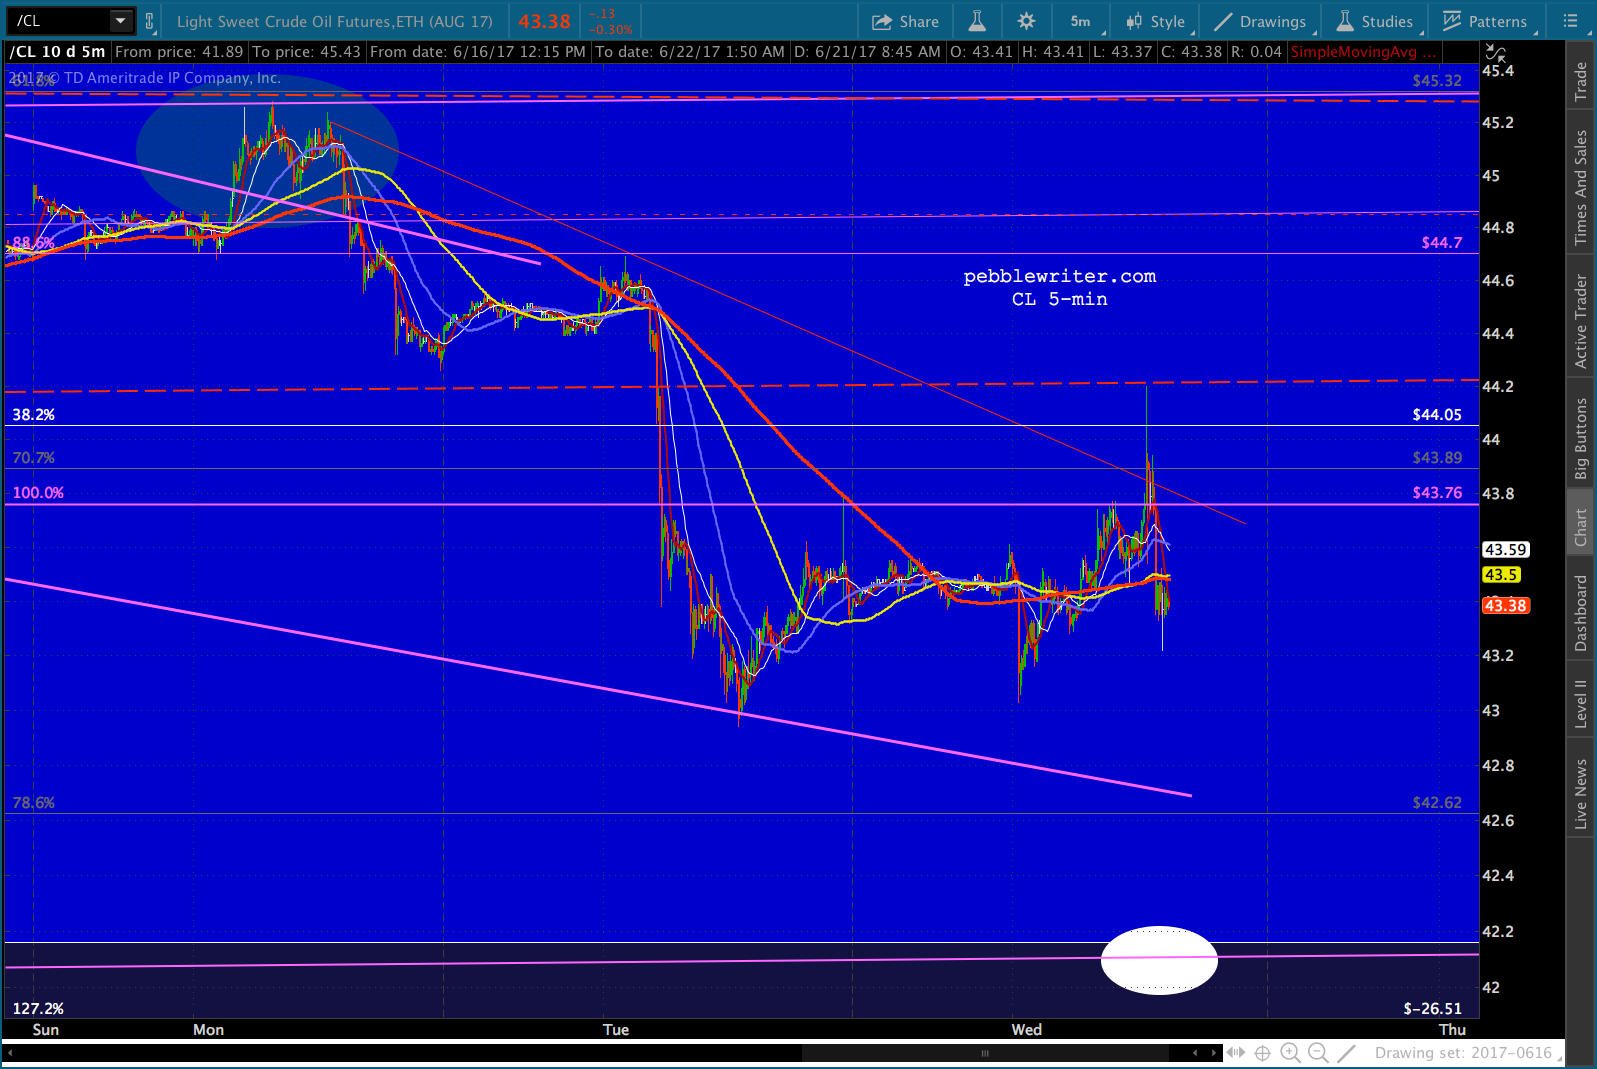
    VIX just tumbled to the red channel bottom, sending SPX back above its SMA10.  This should give CL plenty of room to drop to 42.11 if it’s going to without creating a problem for stocks — especially if VIX drops in the process.

    As I mentioned before, I’m going to take off now.  I think things are pretty well set up for the remainder of the day.  I’d look to go long on CL when it bottoms out, should be a nice trade.  Just know that it’s a funky place Fib-wise, so the turn might be messy.  Use stops and good common sense.  And, watch USDJPY and VIX for corroborating signals.
     *  *  *

    BTW, I’m going to post until about 11am this morning, then take off the rest of the day.  I’ve contracted whatever my daughter has, and am pretty under the weather.

  • Update on Oil: Jun 20, 2017

    Last Thursday we noted that WTI was approaching an important line in the sand, the neckline of a Head & Shoulders Pattern that could spell real trouble for oil prices.  From Oil’s Dangerous Game:

    So, it’s no surprise that equities are panicking just a little this morning, as CL is pennies away from completing a Head and Shoulders Pattern which targets 31.55.  I understand why it’s necessary.  But, equities are not happy – not one bit.

    Last night, CL dropped through that neckline in the midst of a 2.5% dip.  We’ll look at what this means for oil and for stocks.

    continued for members(more…)

  • The Big Picture: Jun 19, 2017

    With the FOMC, BoJ and ECB actions behind us, this seems like a good time to review the big picture.  This morning’s USDJPY, VIX and CL moves are, perhaps, the perfect reminder for how we got here, and where we’re going.

    Note the strong correlation between USDJPY and ES broke down on May 24 when the dollar ran into trouble.  It was a dicey time for stocks, as oil had reached our upside target (yellow arrow) and was heading south.What enabled stocks to break out then, and maintain a floor afterwards?  VIX, which had spiked from 10.50 to 16.30 between May 16-18 — a rare trip back above the long-term yellow channel bottom — was hammered back to single digits on the 24th.And, so, the cycle continues.  When one algo driver falters, another takes its place.  How long can this go on?  Will it always work?  We’ll look at the mechanism, and the repercussions for traders in today’s big picture.  We might even delve into some underlying economics.

    But, first a shout out to members J.H. and T.M. for posing some great questions this past week.  I’m convinced the pebblewriter readership is the smartest, most thoughtful group of investment professionals out there.  These two gentlemen are real students of the markets, and do a great job of keeping me on my toes.

    continued for members(more…)

  • Charts I’m Watching: Jun 16, 2017

    Things went very much according to plan, yesterday, with SPX plunging to our third support level before beginning the predictable meltup.  And, there’s no mystery as to what was driving it.With equities just short of a breakout (again), is the drama already over?

    continued for members(more…)

  • Oil’s Dangerous Game

    Oil prices move equity prices, plain and simple.  When oil gets the sniffles, equities catch a cold.  When oil drops through major support, equities just plain panic.

    So, it’s no surprise that equities are panicking just a little this morning, as CL is pennies away from completing a Head and Shoulders Pattern which targets 31.55.  I understand why it’s necessary.  But, equities are not happy one bit. The futures are currently off 14, which should land SPX right at our secondary downside target.

    Our first was overshot by 2 points yesterday before a sharp snapback rally that probably left most people long overnight.  We remain short.

    continued for members(more…)

  • FOMC Day: Jun 14, 2017

    It’s been a long, lonely slog since we first forecast the very contrarian view that plunging inflation would prevent the FOMC from raising rates in June.  The last time I checked, Goldman had the probability of a hike at 95%.

    But, as we discussed in The Big Picture, May 3 the drop in oil prices was likely to push CPI below 2%. We reiterated this view the following week [see: Bye-Bye Rate Hikes.]

    Guess what the BLS just reported?

    The Fed might or might not hike rates anyway.  They still have five hours to mull things over.  But, the currency targets we laid out over these past couple of months look very likely to be tagged today. And, every single one is screaming “no rate hike!”

    We listed the major ones yesterday:

    I continue to think the real opportunity tomorrow lies with currencies and oil.  Here’s a quick summary:

    – DX, currently at 97.05, going to 96.07-96.14
    – EURUSD, currently at 1.1199, going to 1.1470
    – USDJPY, currently at 110.05, going to 108.82

    Whether or not we get the full follow through will depend on how things go starting at 2pm.  But, we’re off to a very nice start.

    continued for members(more…)

  • The Rally That VIX Built

    As discussed yesterday, stocks spent the night building a cushion based on VIX (currently off 5.4%) in preparation for tomorrow’s FOMC announcement.  It started just before the close, yesterday, and has built to a 6-pt gain in the futures.Actually, it’s been less of a rally, lately, and more of an effort to maintain ES at levels above its IH&S Pattern target reached back on Jun1.  Remember the mantra “stay fully invested, because you never know when a sudden rally will appear out of nowhere and you can’t afford to miss it”?  These days, it’s the corrections that pass in a flash, like Friday’s 31-pt plunge which was reversed so quickly that it won’t even register on daily charts.

    But, I digress.  Today’s action is all about putting more distance in between SPX and the Support Below Which it Must Not Go in the wake of the FOMC meeting.

    continued for members(more…)

  • In Search of Patience

    Friday started off like so many other sessions, with algos working overtime to counteract the effects of the British election.  Our first upside target at 2438.44 was quickly dispensed with.  So, it was with some trepidation that I suggested another turning point an hour later at 2444.83.

    Here’s the next opportunity for SPX to top out if it’s going to.   Note that ES has also reached a key Fib. I believe it’s worth taking a shot at a short with tight stops.

    SPX slipped a couple of points higher before the rug was pulled out, prompting a 30.5-pt plunge that exceeded our downside target by 4 points.  Follow that up with a 16-pt rally into the close, and a return to some semblance of normalcy by VIX……and it’s no wonder that traders are a little rattled.  In reality, things went pretty much as they should have; it just took a little patience.

    BTW, for those who missed it earlier, we gained some nifty insights into the Plunge Protection Team from our recent NDX update.  Check it out.

    continued for members

    (more…)

  • Update on NDX: Jun 9, 2017

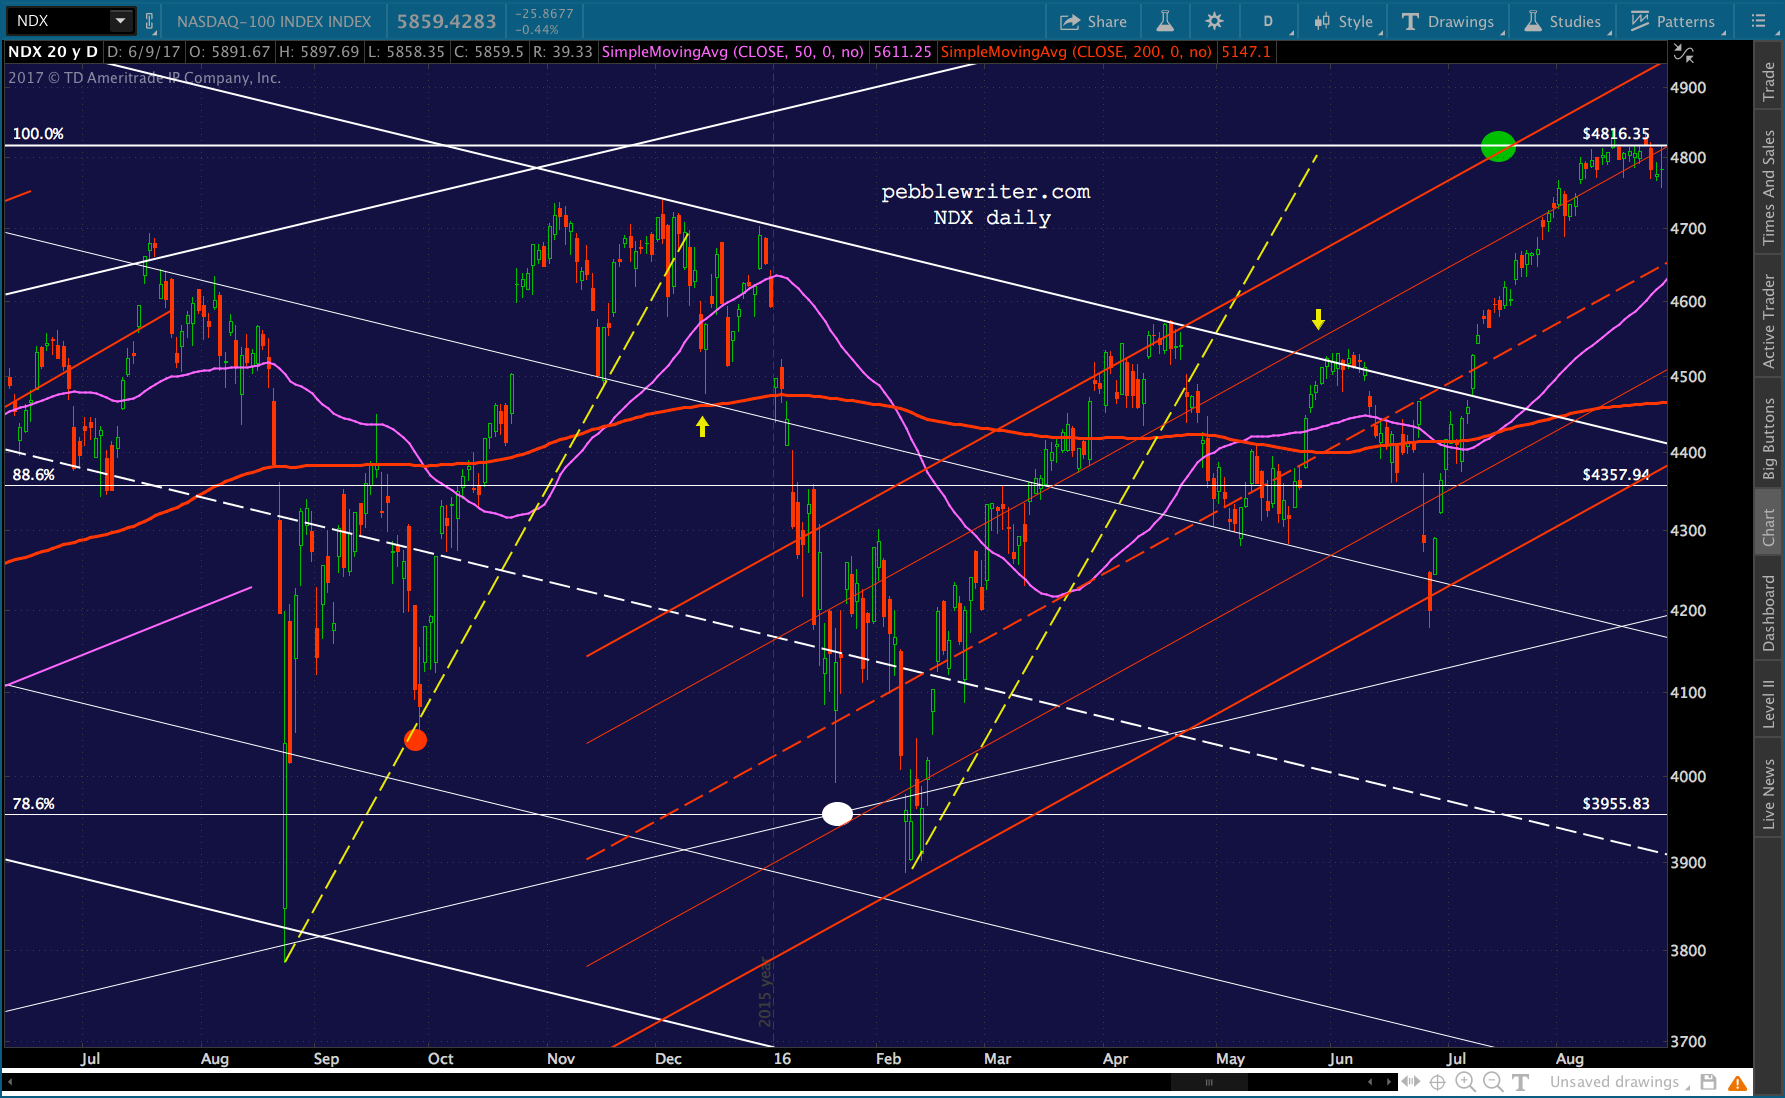
    Last year at about this time we noted that NDX had completed a golden cross — where the SMA50 crosses above the SMA200 — normally a strong buy signal.  But, as we also discussed, such signals had been head fakes the past several times in a row.

    The 50-day recently crossed above the 200-day — a golden cross.  However, this has been a head-fake several times in a row:

    –  the Sep 30, 2015 death cross marked a bottom instead of a top
    –  the Nov 17 golden cross preceded the high by only two weeks
    –  the Feb 5, 2016 death cross was followed by a bottom the very next session

    On the other hand, NDX had also reached potentially significant resistance: two channel tops and a key Fibonacci level.

    If the golden cross was to be believed, we’d see a strong breakout.  If it was another head fake, NDX was due for a tumble.  Unlike the Dow and the S&P 500, NDX had yet to even recover to its Mar 2000 highs.

    It was a head fake.  NDX went sideways for a week before plunging nearly 8% in just 15 sessions.  The bulk of the drop (6.4%) occurred on just three days: Jun 23, 24 and 27. Clearly things were accelerating.On the 27th, the SMA50 actually dropped below the SMA200 — the dreaded death cross — on an intraday basis.  As bad as things had been, were they about to get even worse?

    Readers might remember the Jul 2008 death cross which preceded a 46% drop, and the Sep 2000 cross which resulted in a 79% crash.  In other words, death crosses are not usually very healthy for stocks.

    But, wait, did I mention that NDX experiences frequent head fakes?  On Jun 28th, when the death cross officially occurred, NDX gapped higher.  And, then it kept going. In three weeks, it gained a total of 16% (136% on an annualized basis!) and reached new, all-time highs — not bad for a bearish signal.Since QE started in late 2008, every single NDX death cross except one has signaled a bottom — usually the same day but within, at most, the next two sessions. The one exception, in Dec 2012, took 12 sessions.

    If this doesn’t make you a believer in the Plunge Protection Team, I don’t know what will.  And, considering how critical NDX’s top stocks are to the market’s overall direction, it’s understandable.

    NDX broke above its all-time high on Aug 16, but then spent almost 4 months trying to break out before finally doing so on Dec 7.  Since then, it has been a fairly straightforward meltup.  The only hitch, now, is that NDX has reached a key Fib level that could prove problematic.

    With the NDX providing much of the market’s leadership, is this something to be concerned about?

    continued for members... (more…)

  • Update on VIX: Jun 9, 2017

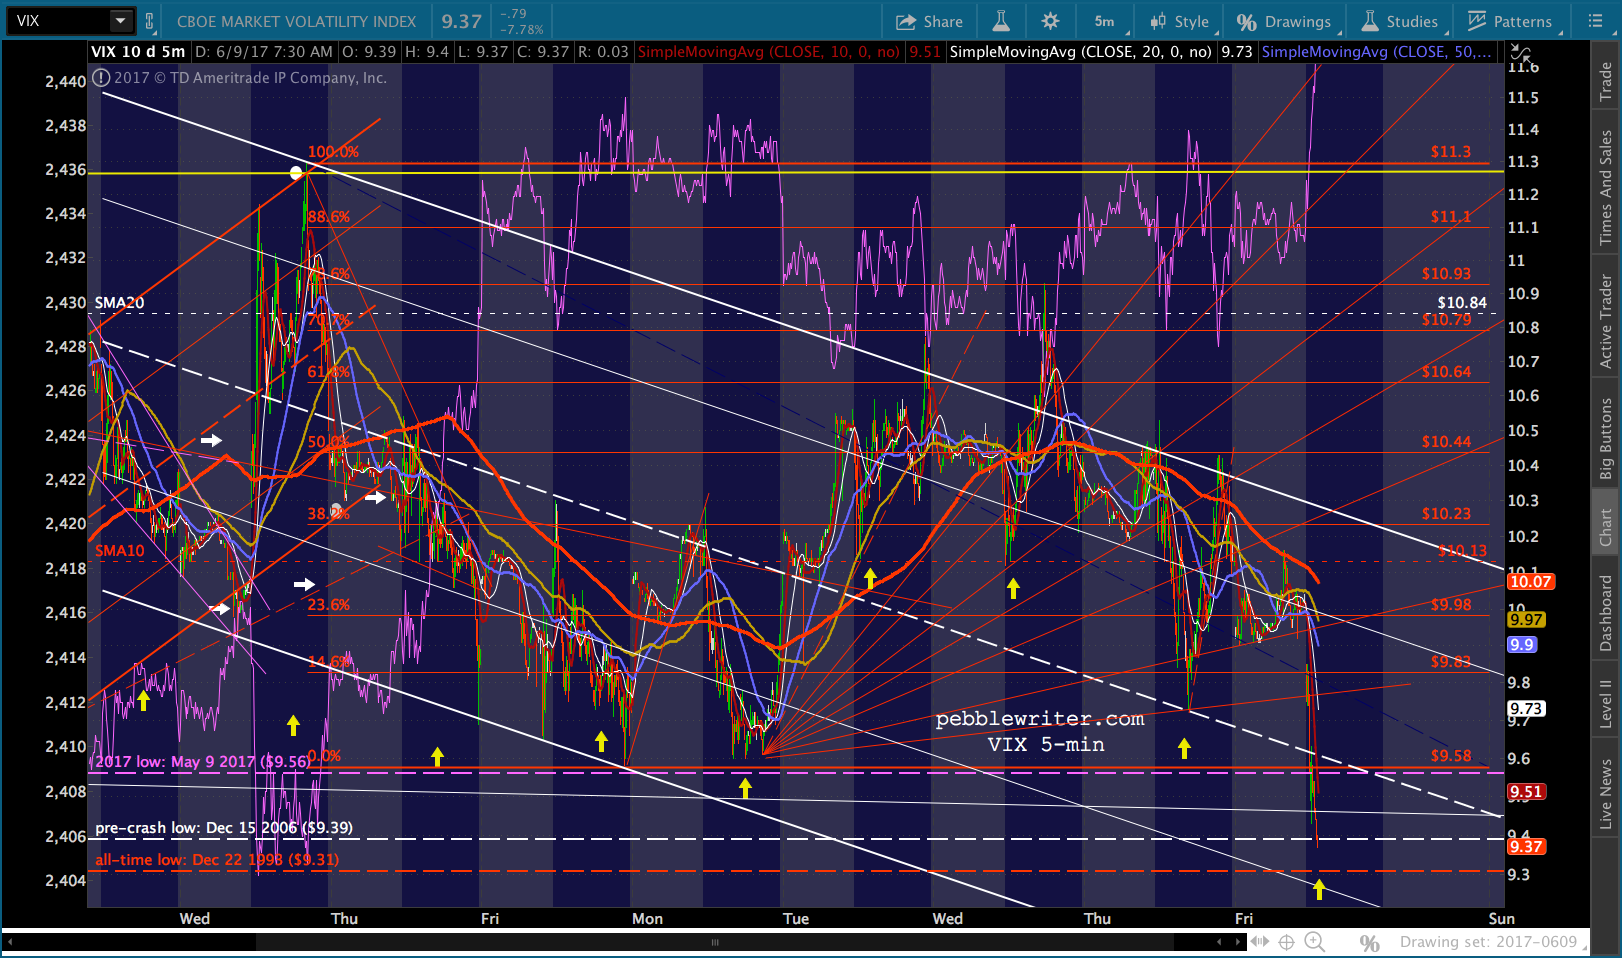
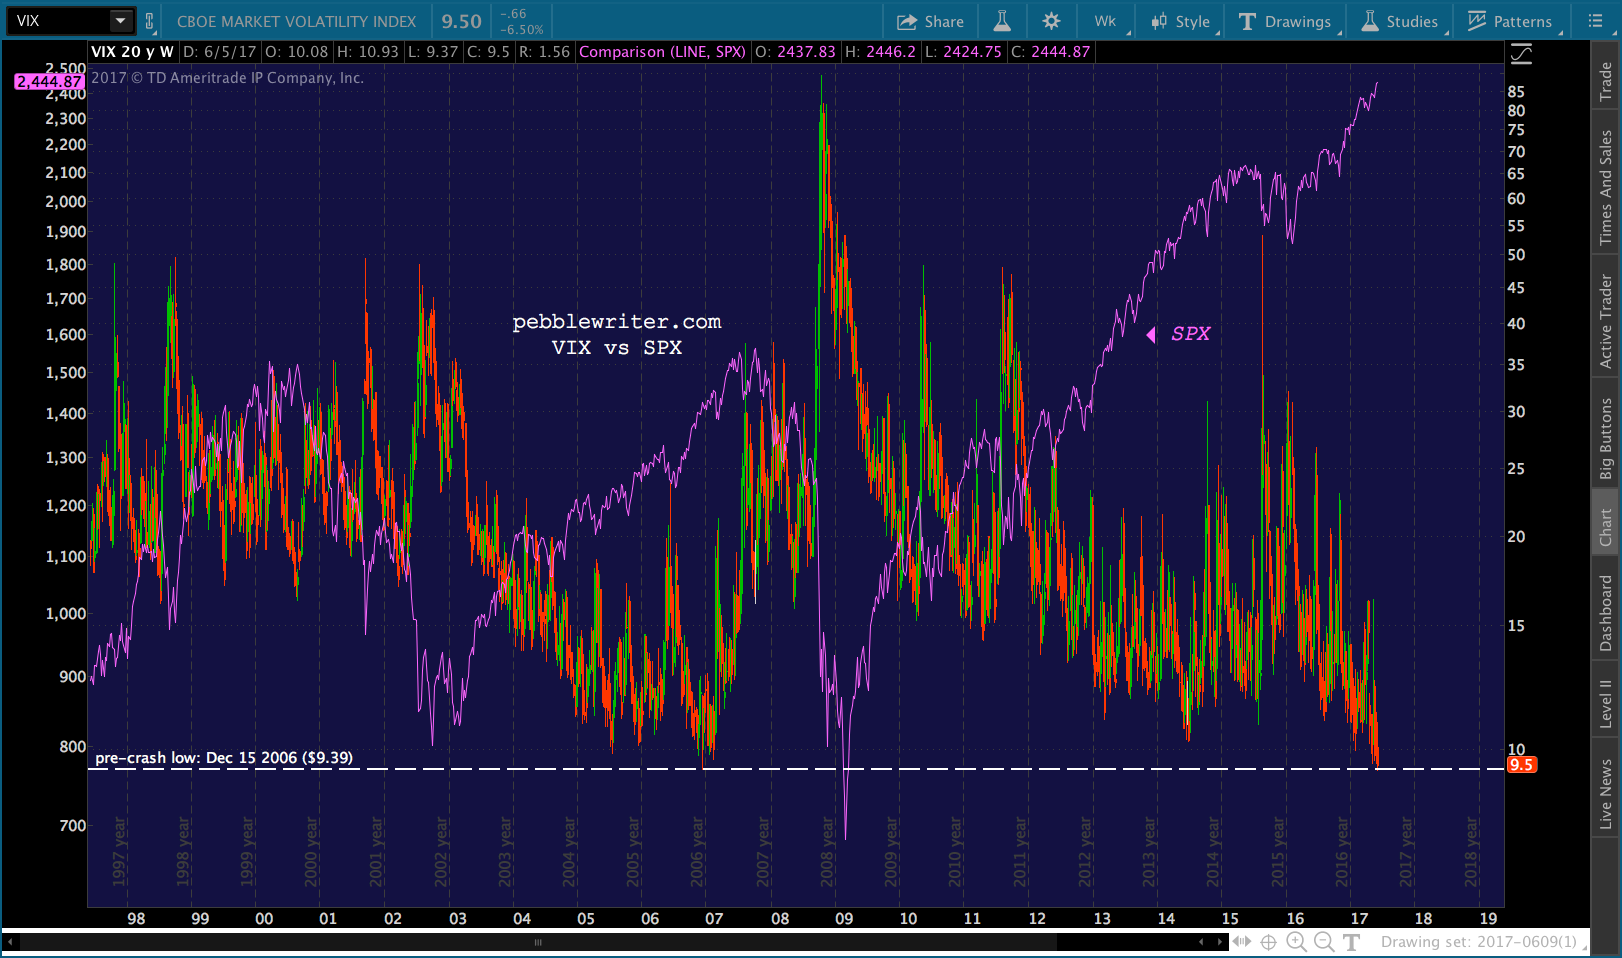
    Just a quick update on VIX, which moments ago pushed below its Dec 15, 2006 lows of 9.39 — the lowest VIX had been in the lead up to the 2007-2009 market crash.The only time VIX has ever been lower was on Dec 22, 1993, when it fell as low as 9.31 shortly after its creation.For implications and forecasts, please refer to our last major update on VIX in How Broken is the Market?