Last Thursday we noted that WTI was approaching an important line in the sand, the neckline of a Head & Shoulders Pattern that could spell real trouble for oil prices. From Oil’s Dangerous Game:
So, it’s no surprise that equities are panicking just a little this morning, as CL is pennies away from completing a Head and Shoulders Pattern which targets 31.55. I understand why it’s necessary. But, equities are not happy – not one bit.
Last night, CL dropped through that neckline in the midst of a 2.5% dip. We’ll look at what this means for oil and for stocks.
continued for members…
We can see the neckline has been lost, and there are multiple Fib choices down below: the purple 1.272 was my choice for a downside target before only because it lined up with the purple channel bottom about a month ago.
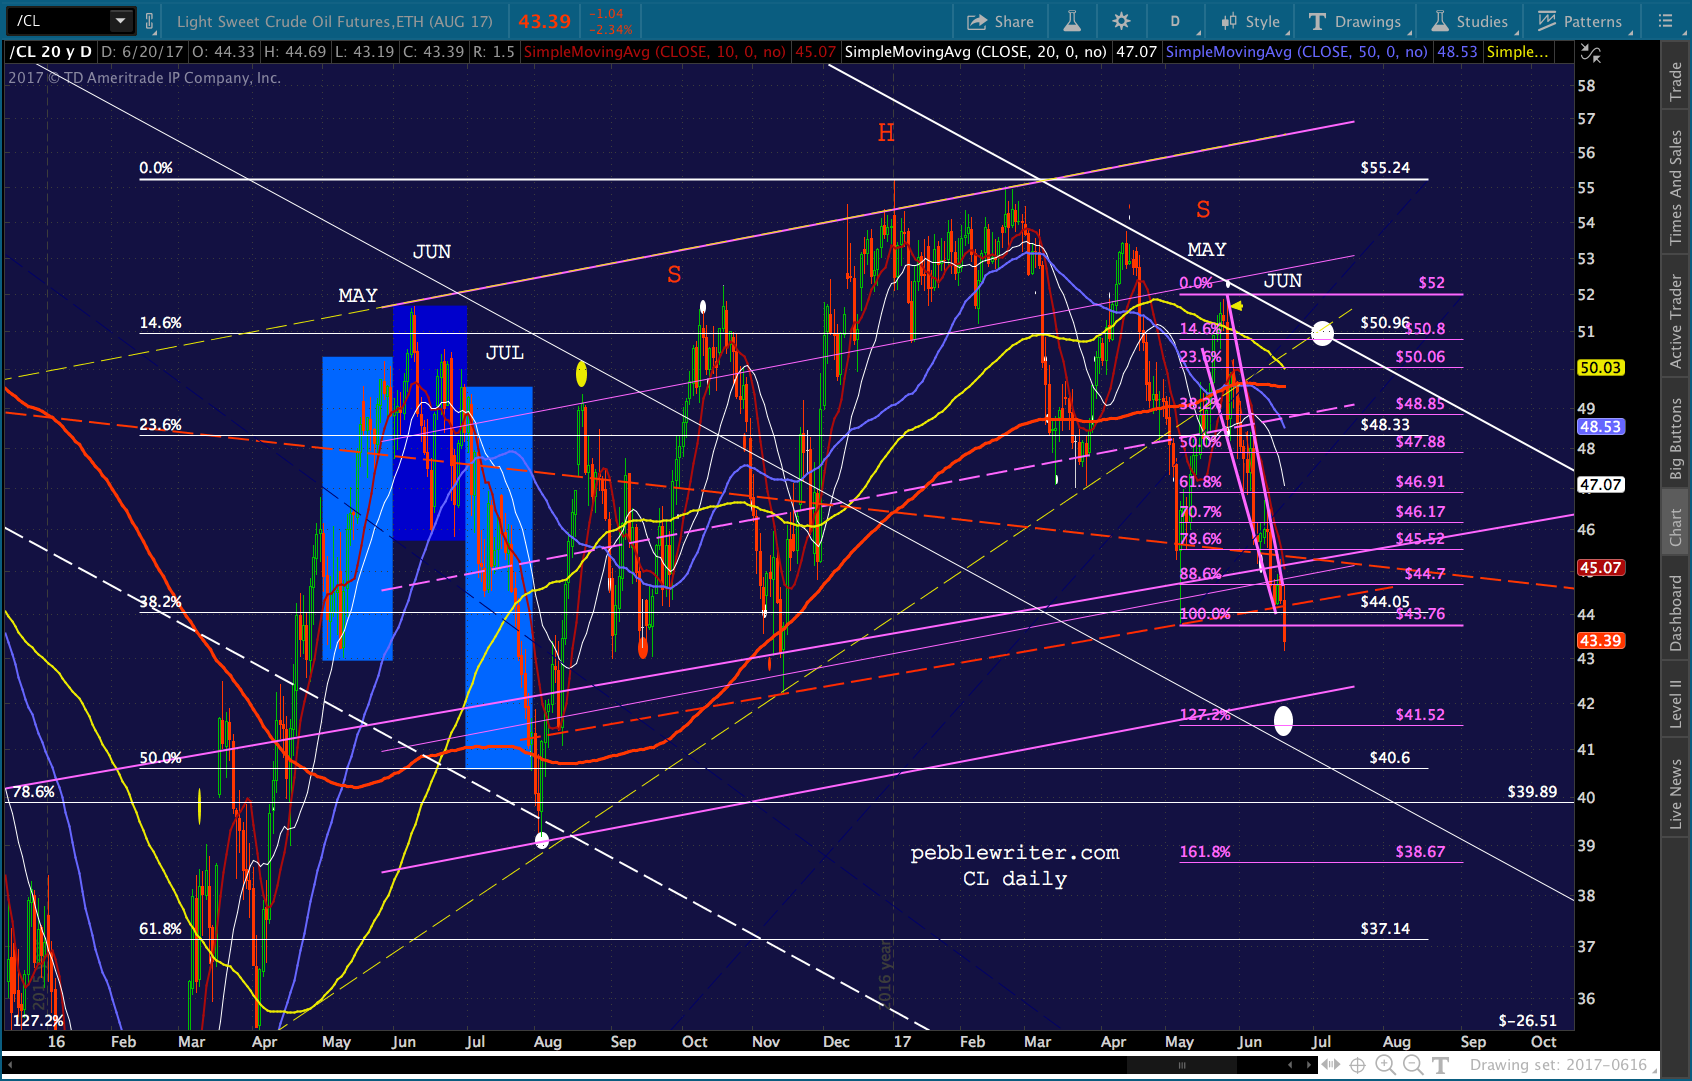 Today, it matches up with none of the Fibs. But, if we ignore the Fibs and focus on the purple channel, we can see a very clear bottom at 42 or so.
 I can only surmise that central banks are not propping it up yet because to do so would result in higher inflation and higher interest rates.
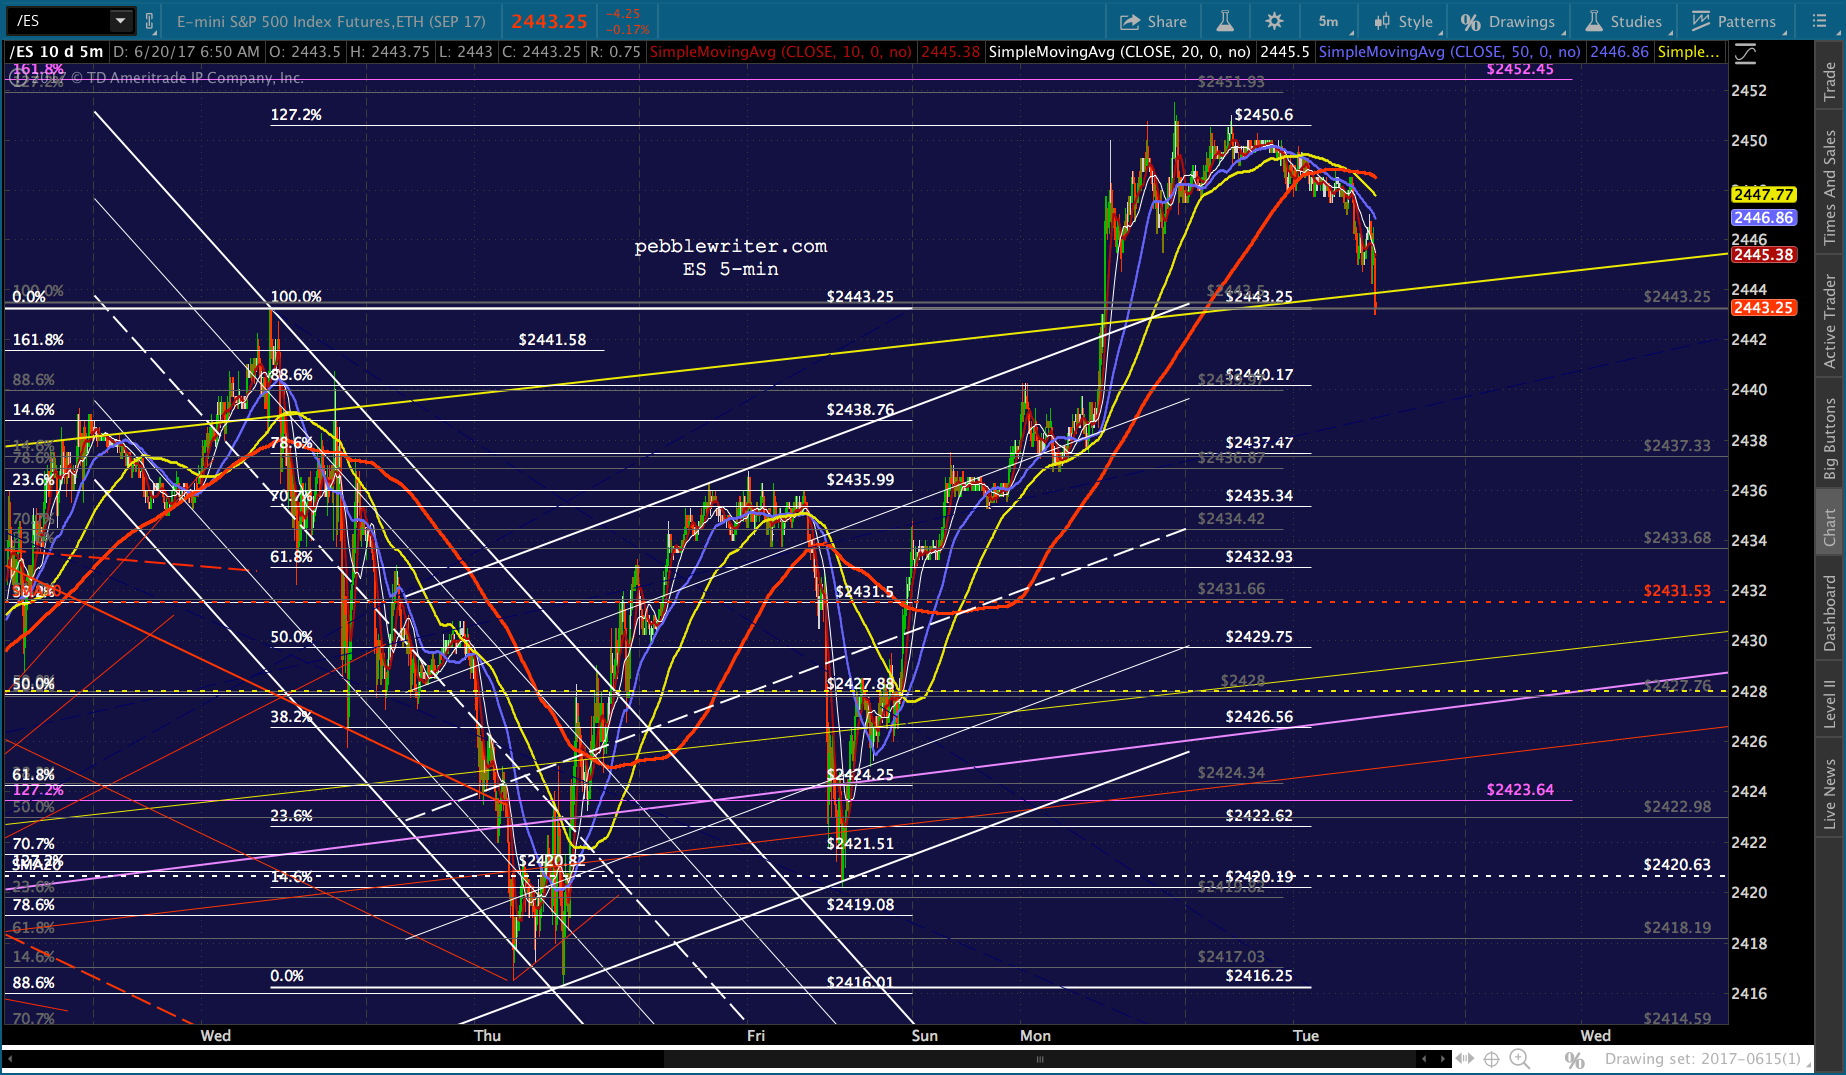
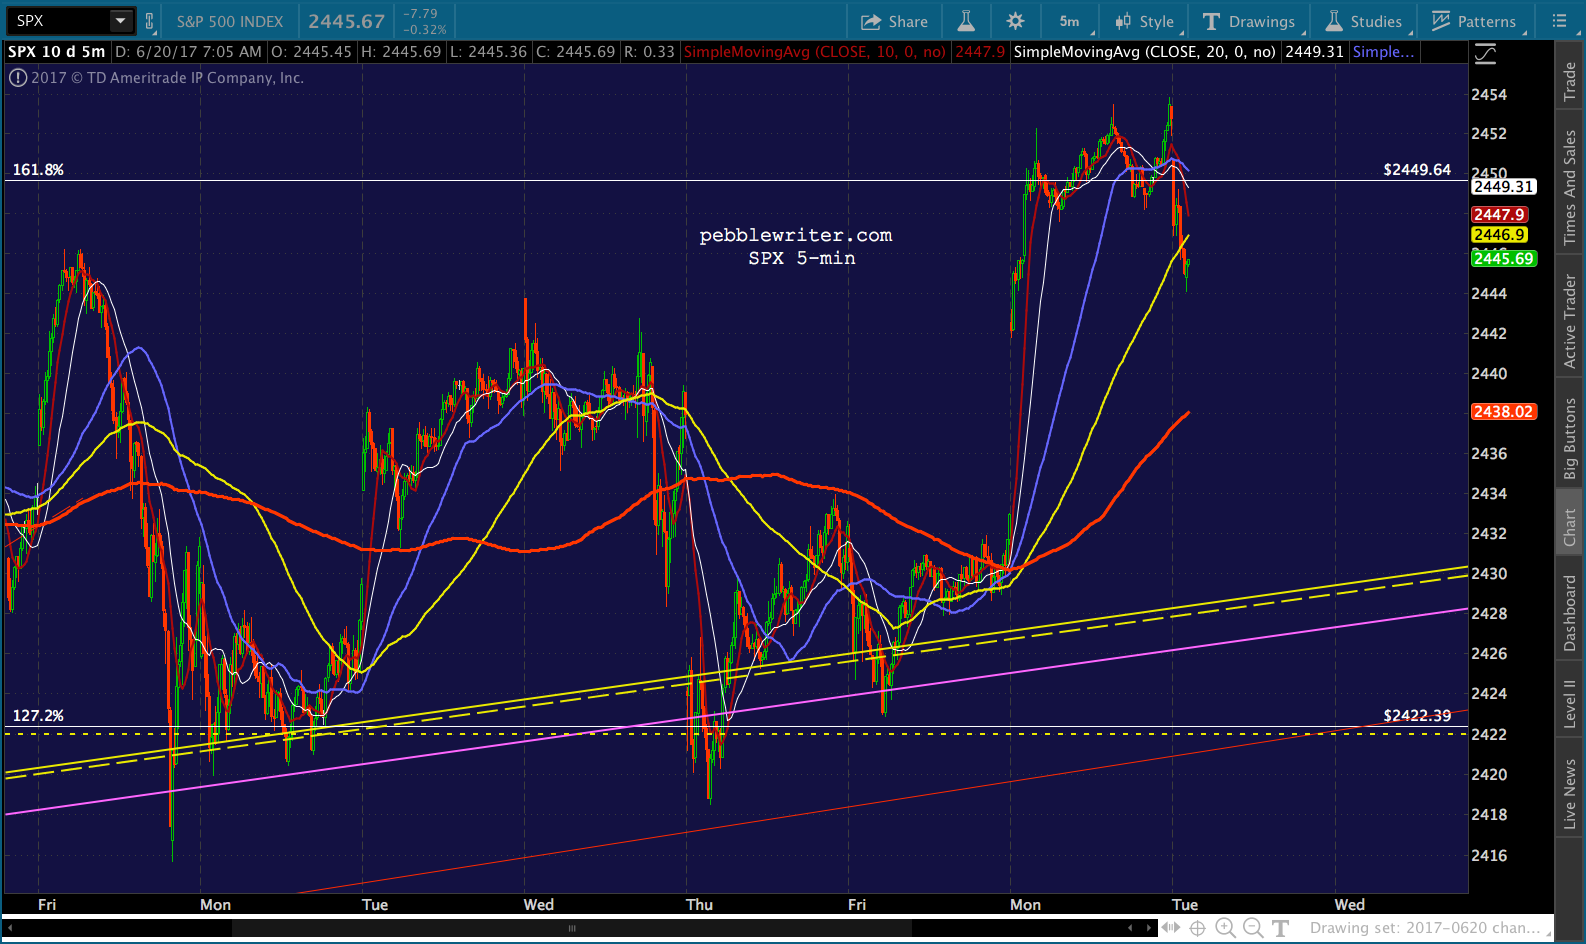
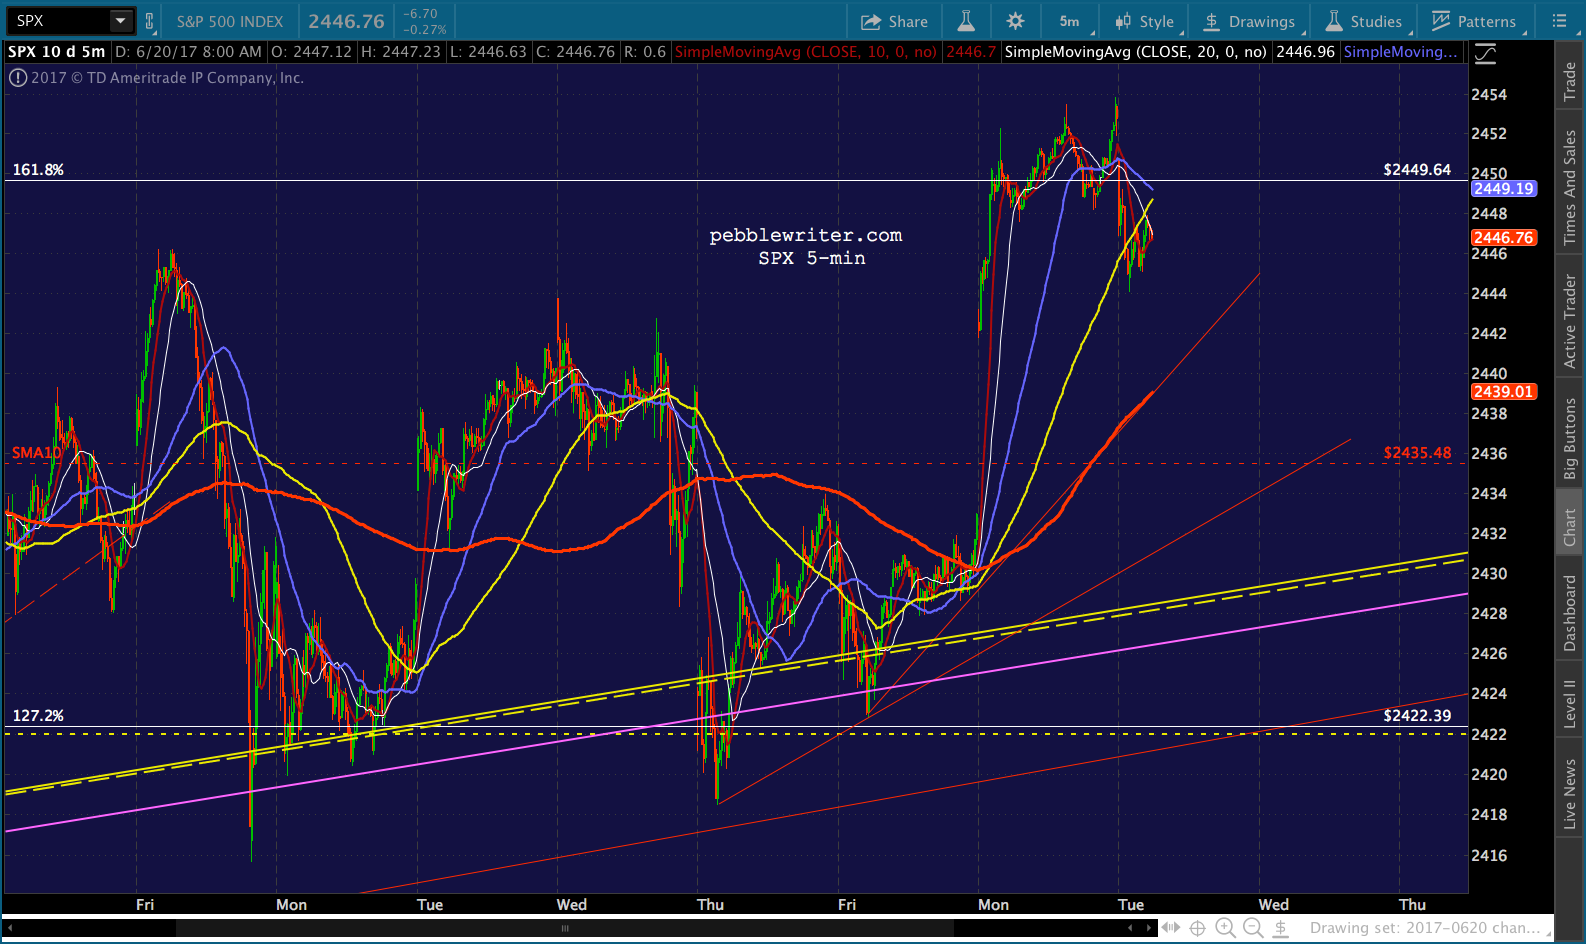
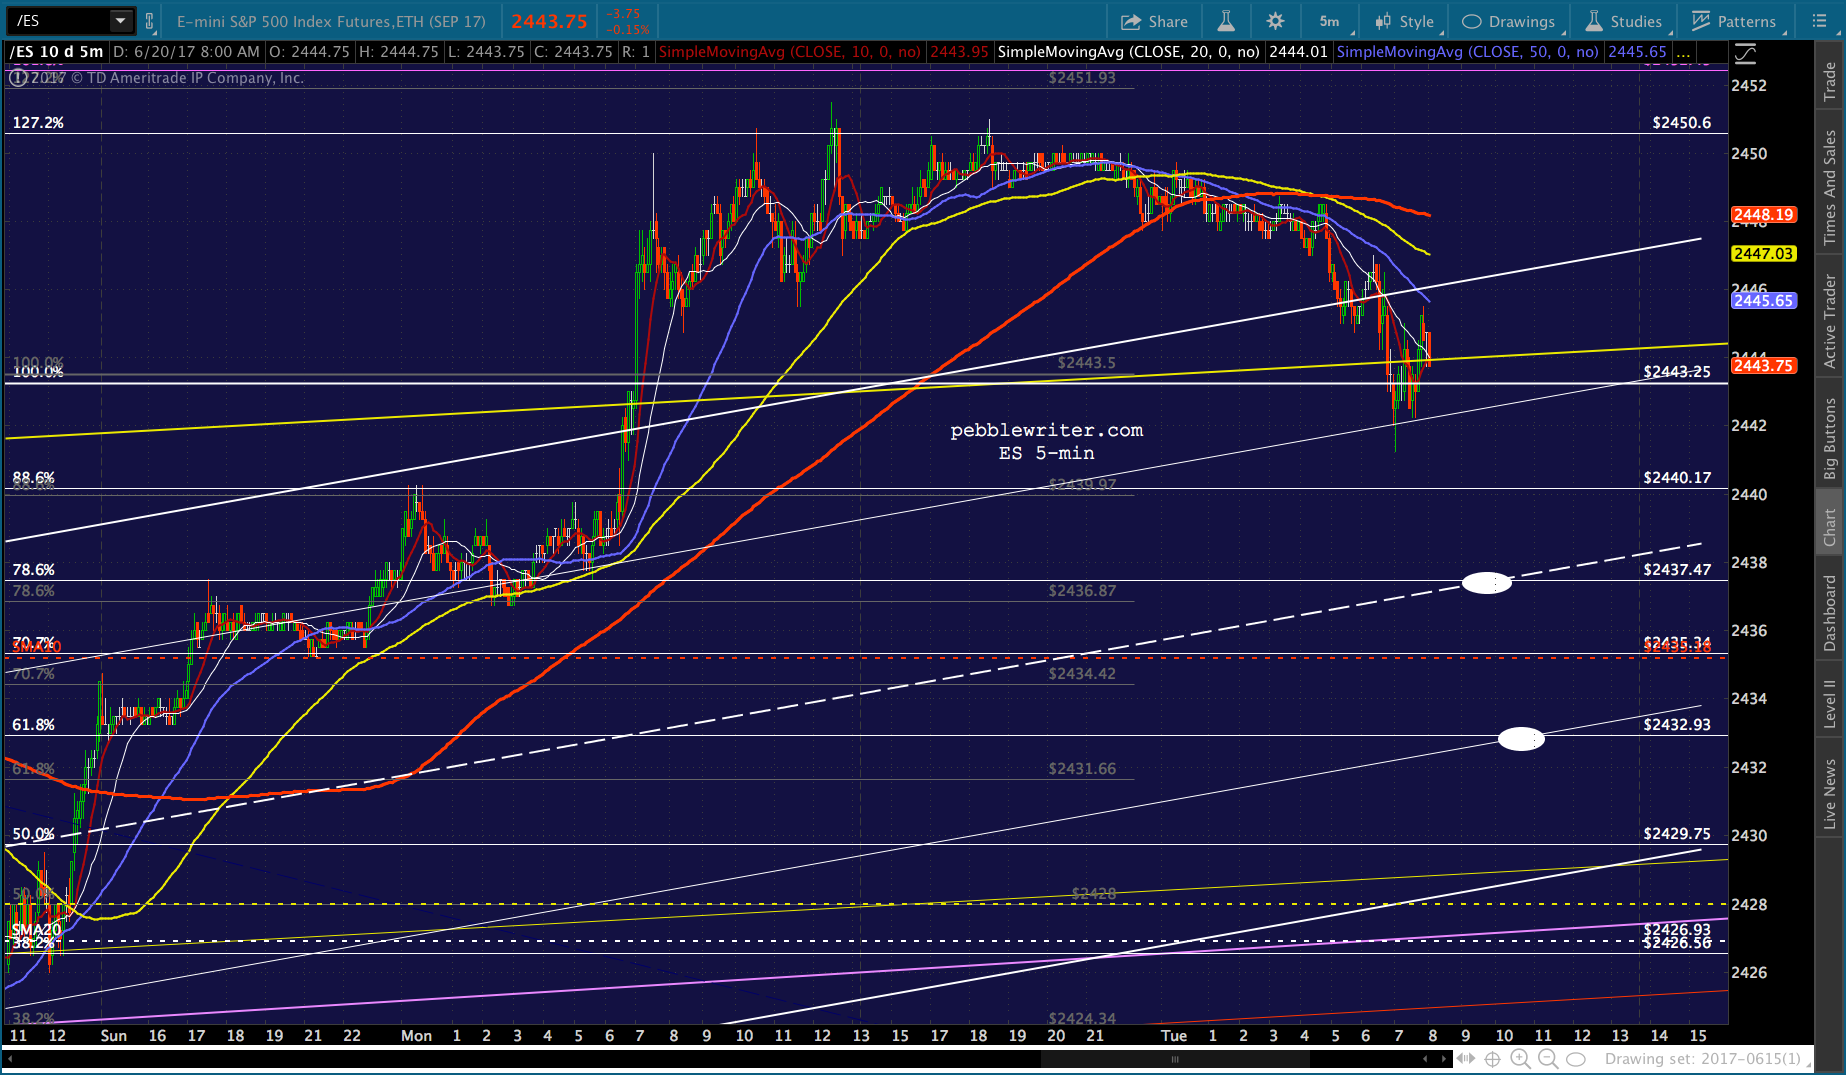
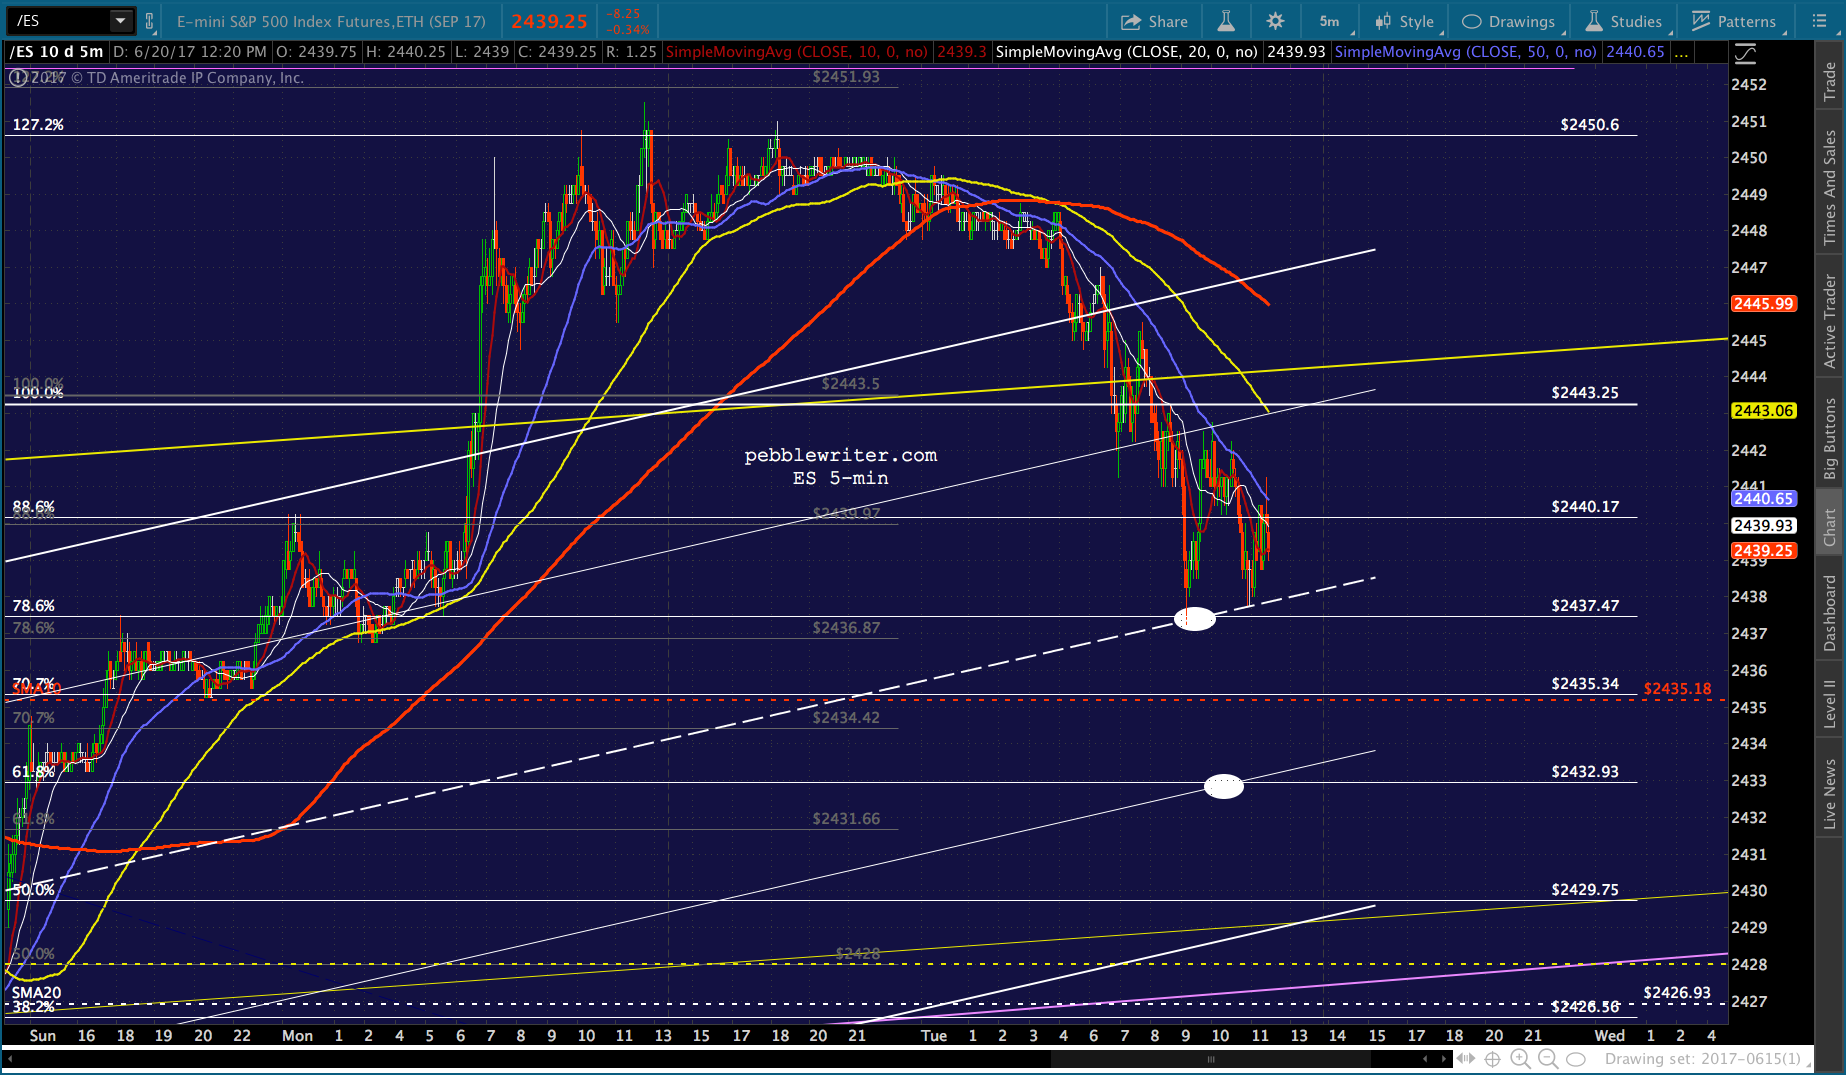
BTW, stocks need at least a backtest, here, and should get one — between this dip and USDJPY topping out. ES looks headed for at least 2443 and SPX for 2446.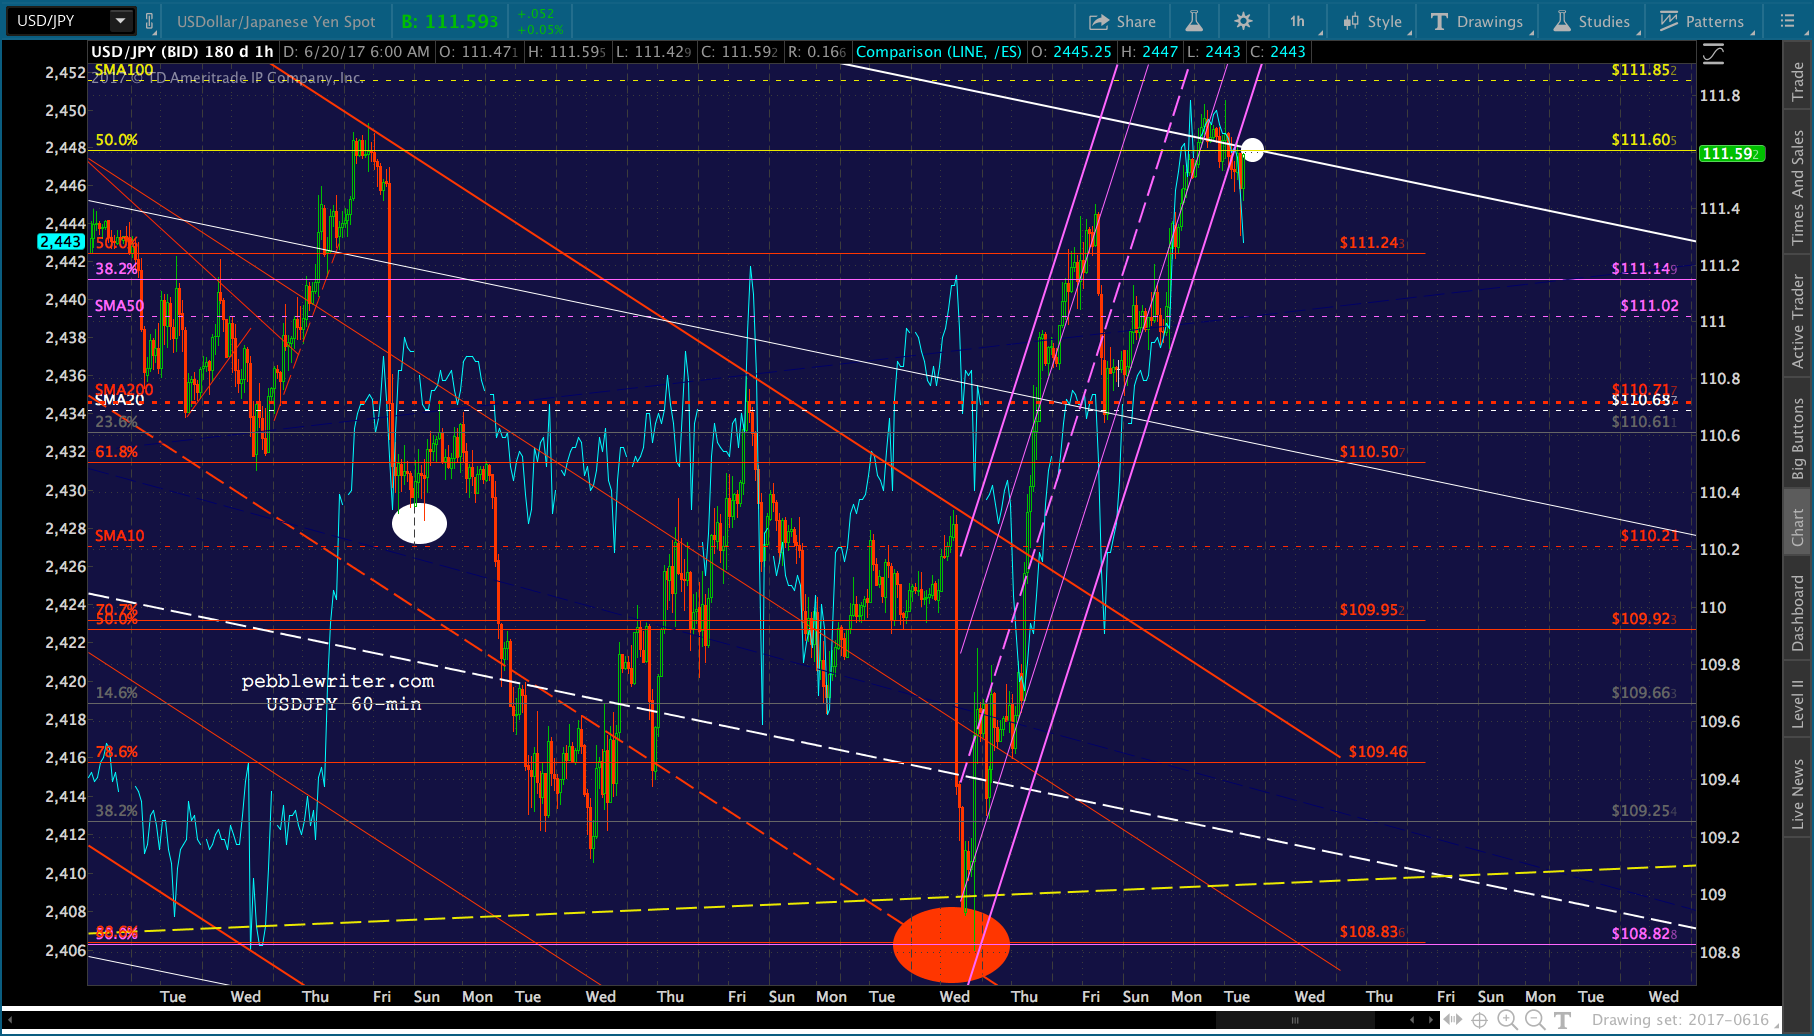 Without a sharp rebound in the next 10 days June YoY prices are almost certain to result in very weak inflation.
 But, look at gas prices — an even more striking YoY drop, but good channel support at current levels and strong Fib support just below at 1.3911.
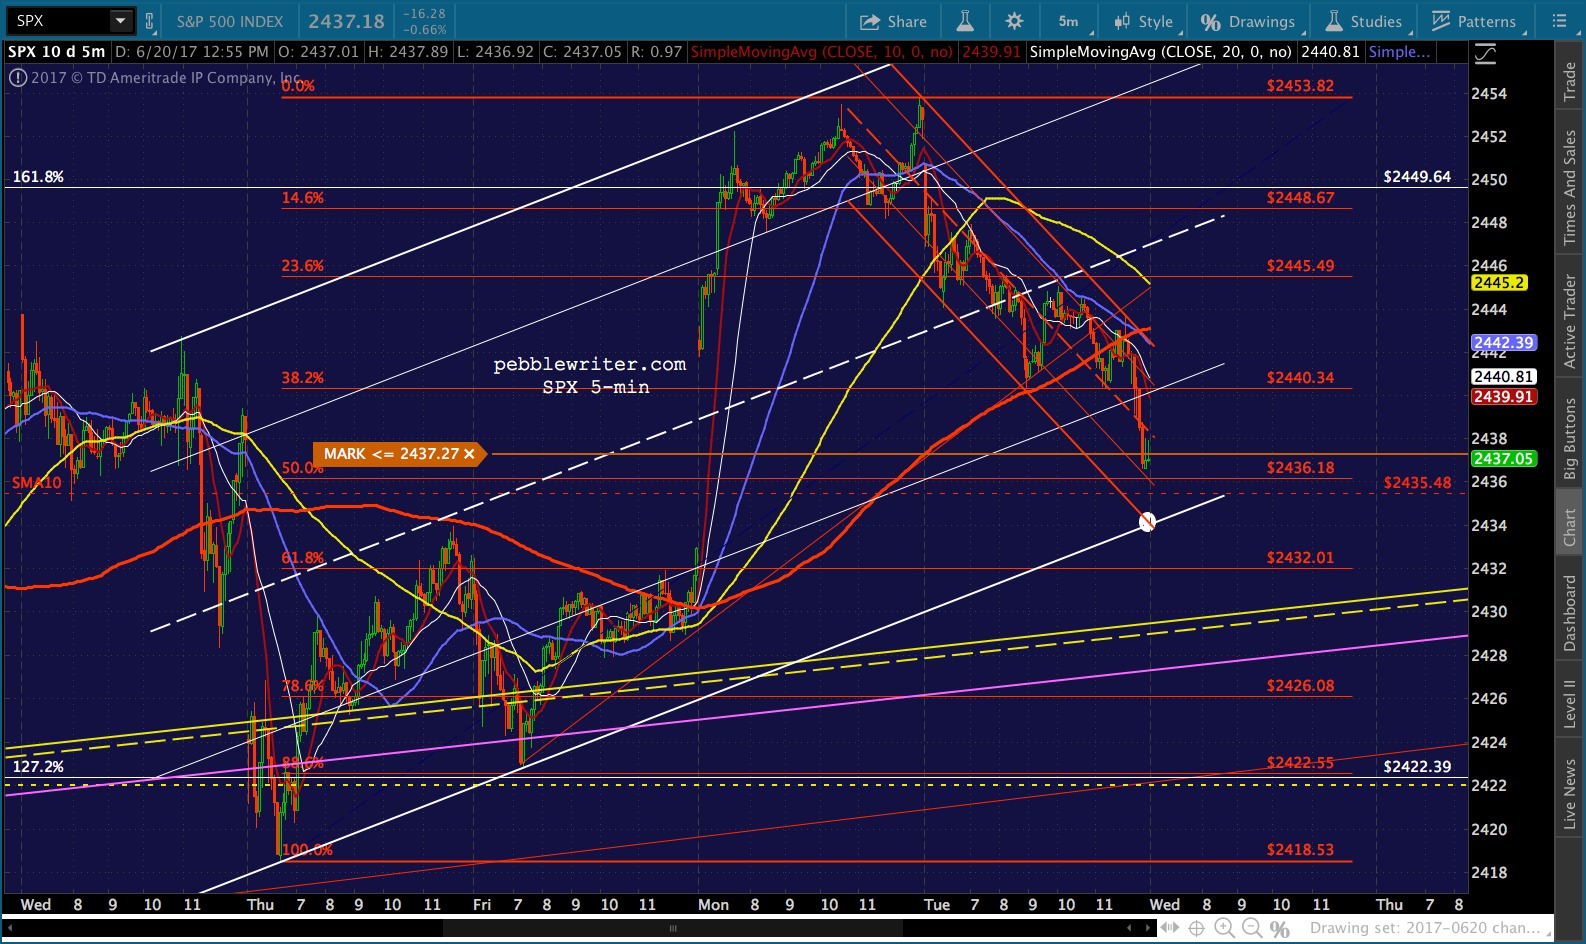
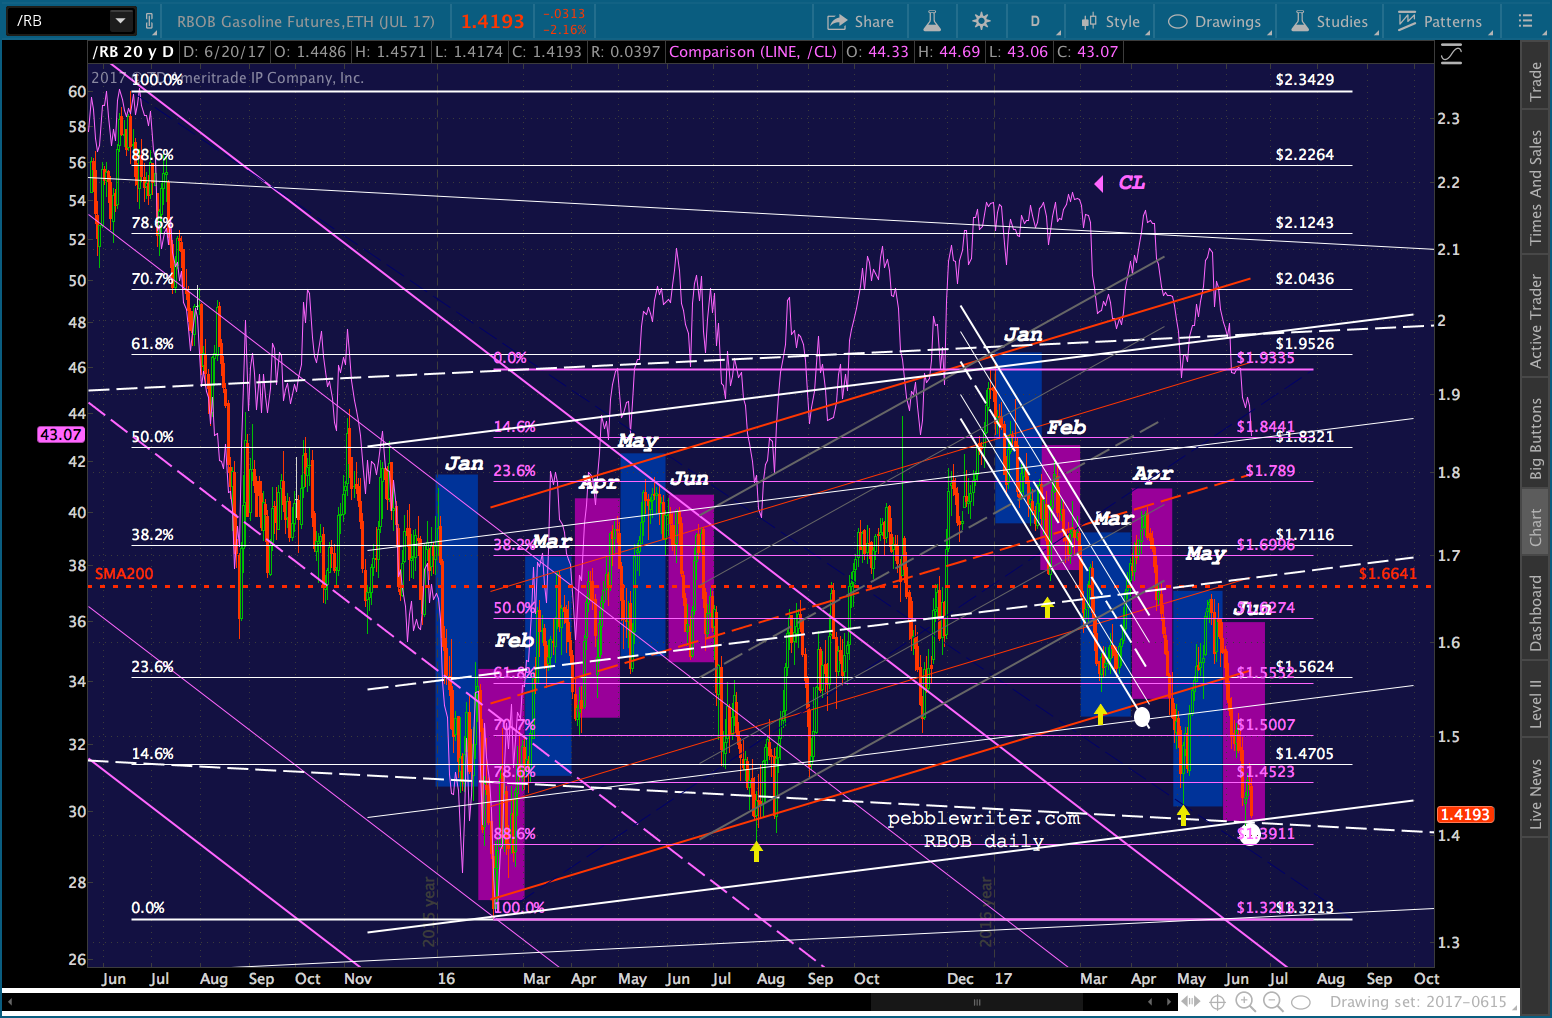 As an aside, SPX and ES have reached backtest levels and are threatening to go lower. I’d remain short, but tighten up stops here. SPX’s next support is the yellow midline around 2442.
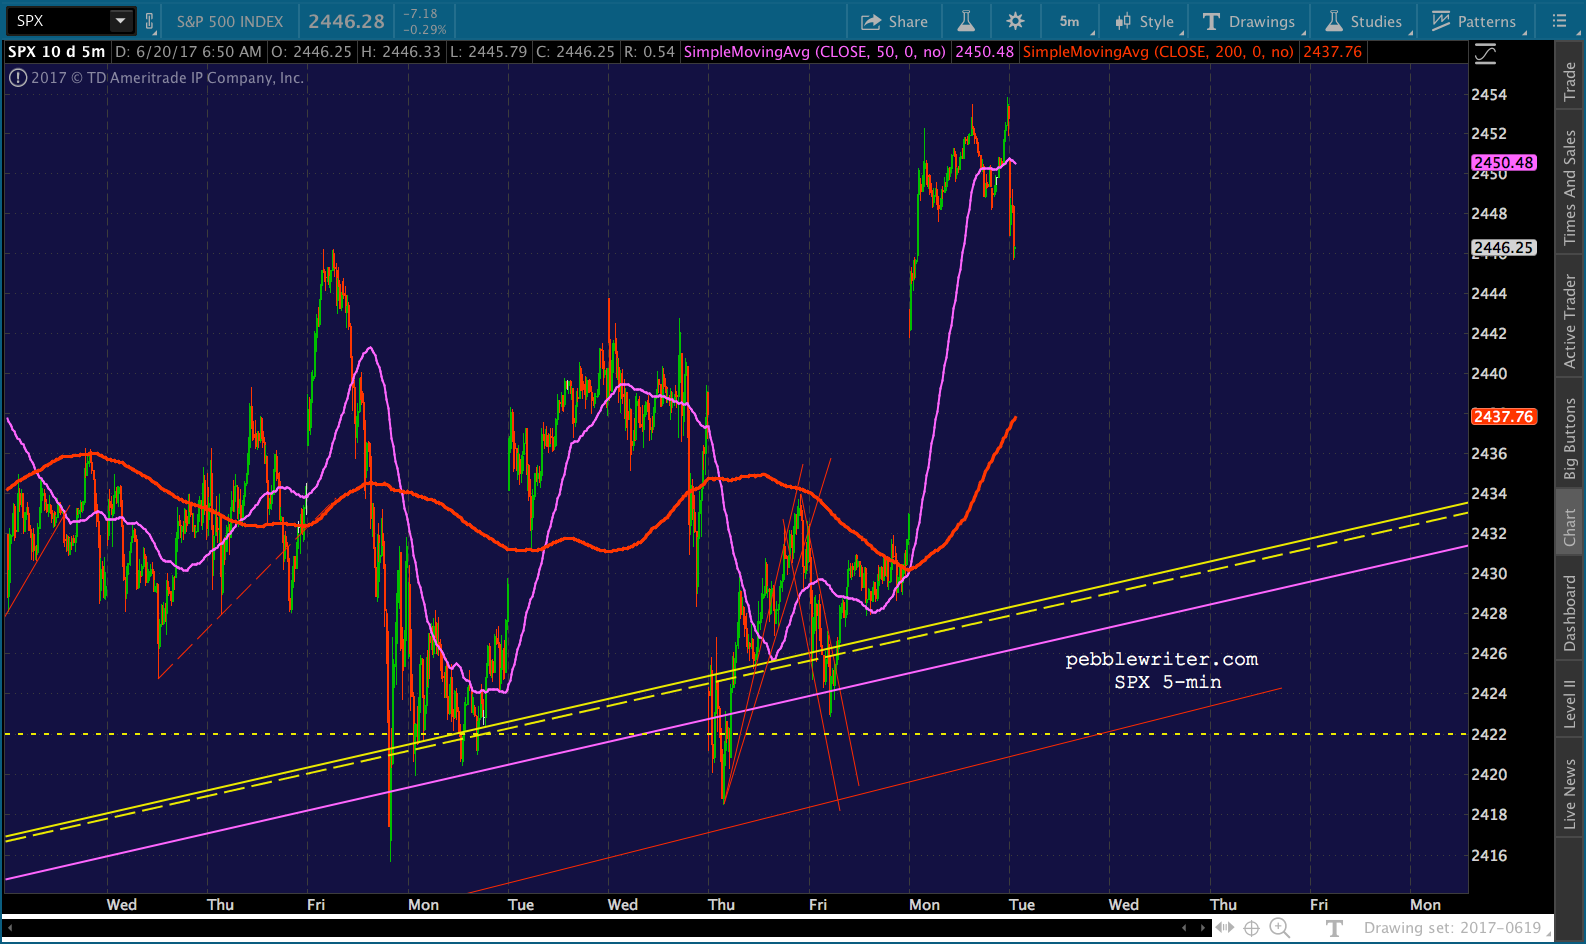
 UPDATE: 10:03 AM
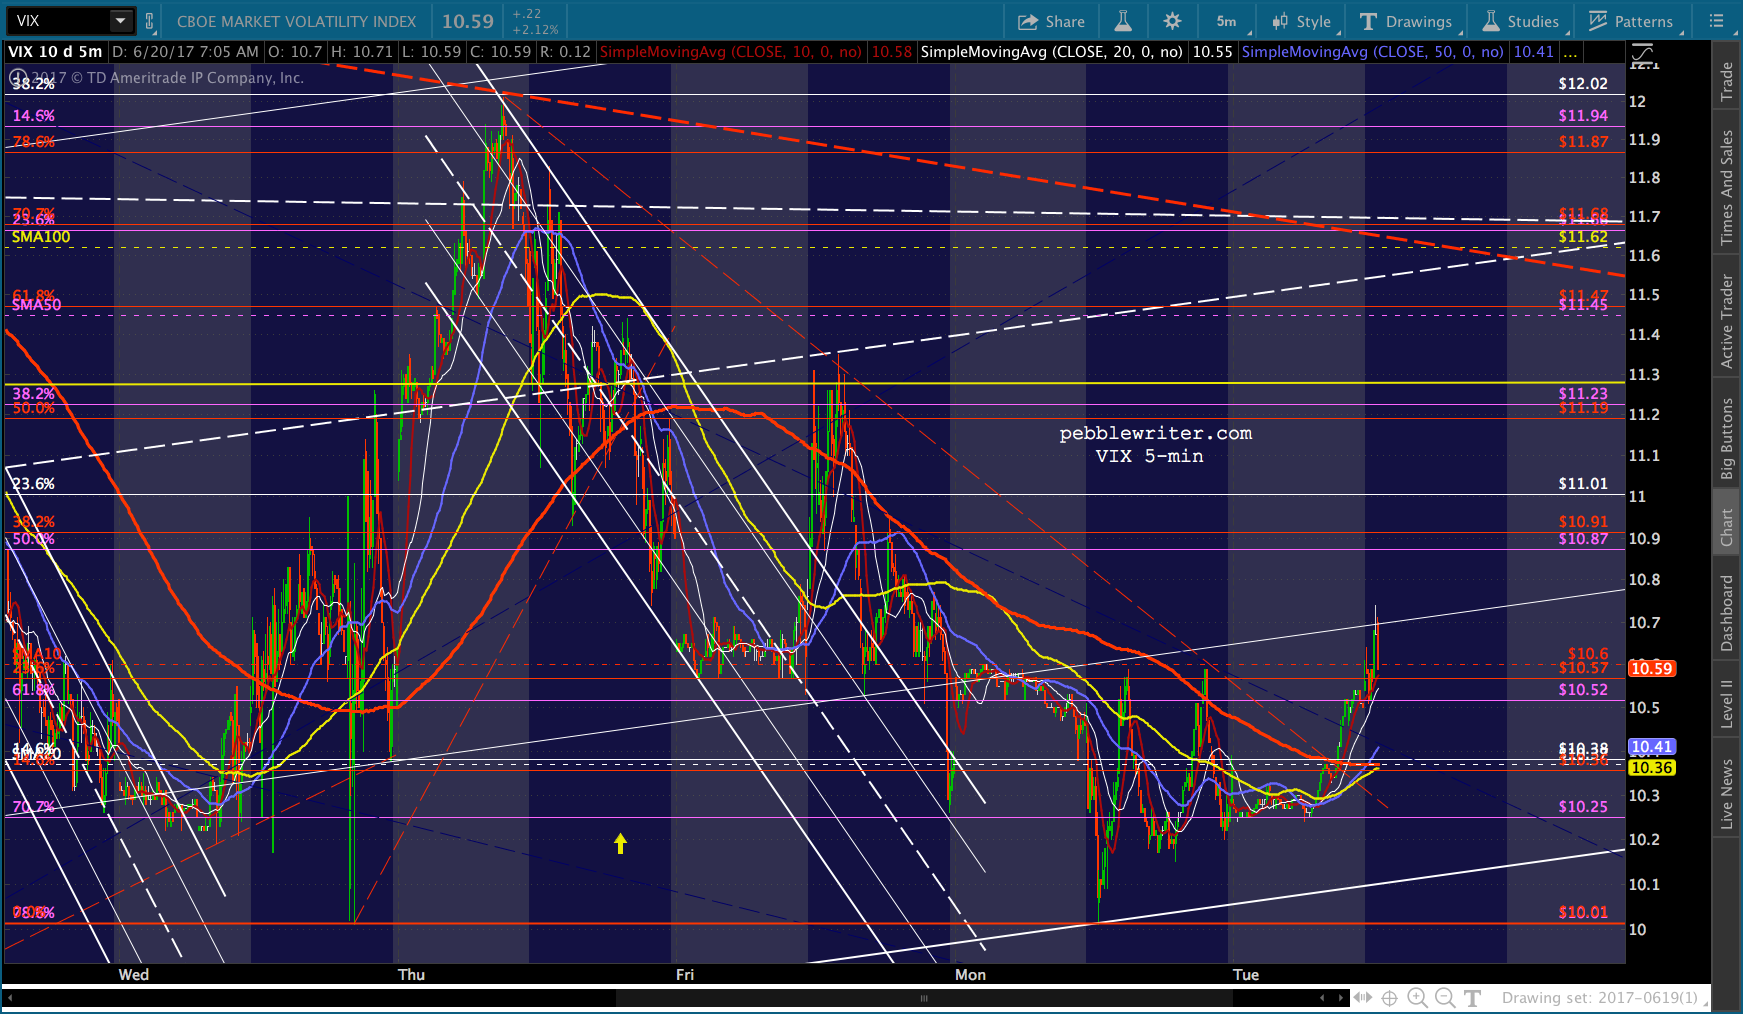
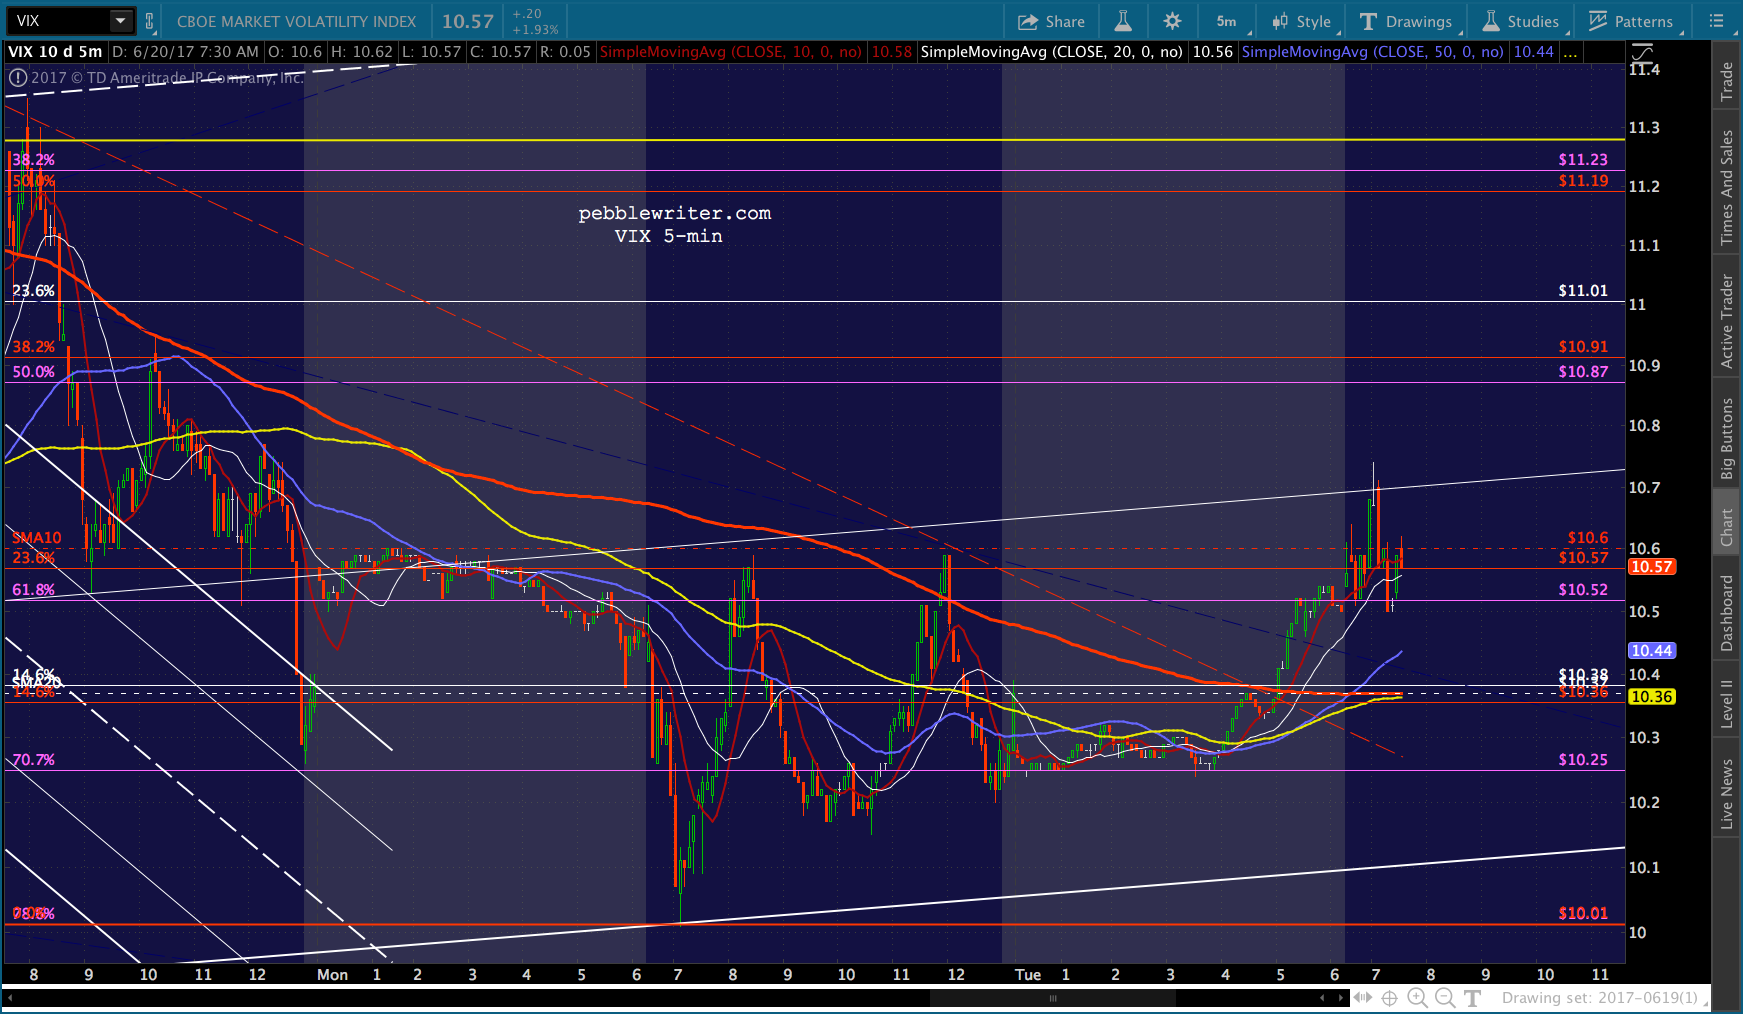
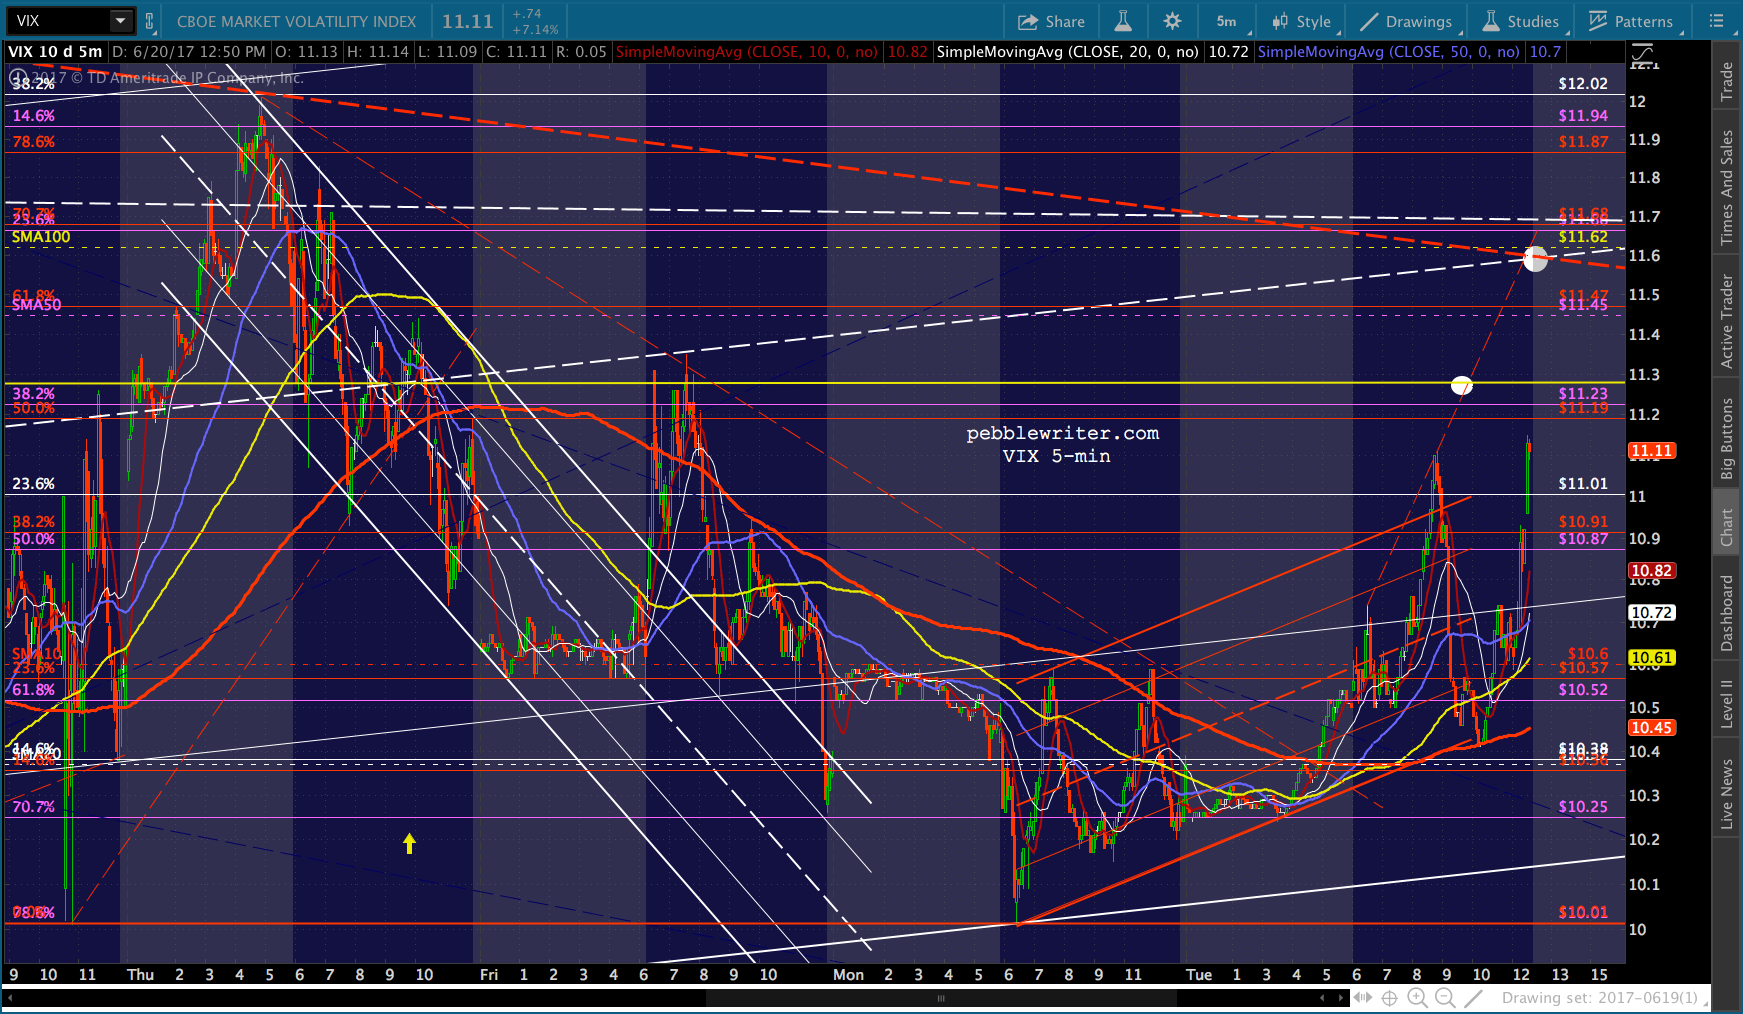
VIX is backtesting its SMA10 at 10.6. A dip below it could put the kabosh on any further downside for SPX. With SPX’s SMA5 10 approaching, the risk is of an attempt to push back above it with a sudden drop in VIX. I think this would be a good place to cover, and then see what happens after the SMA5 10 tag. A reversal off of it is a good precursor for a drop to at least the SMA5 200 and potentially a gap close at 2433 (it would line up with ES’ SMA10 at We all know the other scenario.
 UPDATE: 10:30 AM
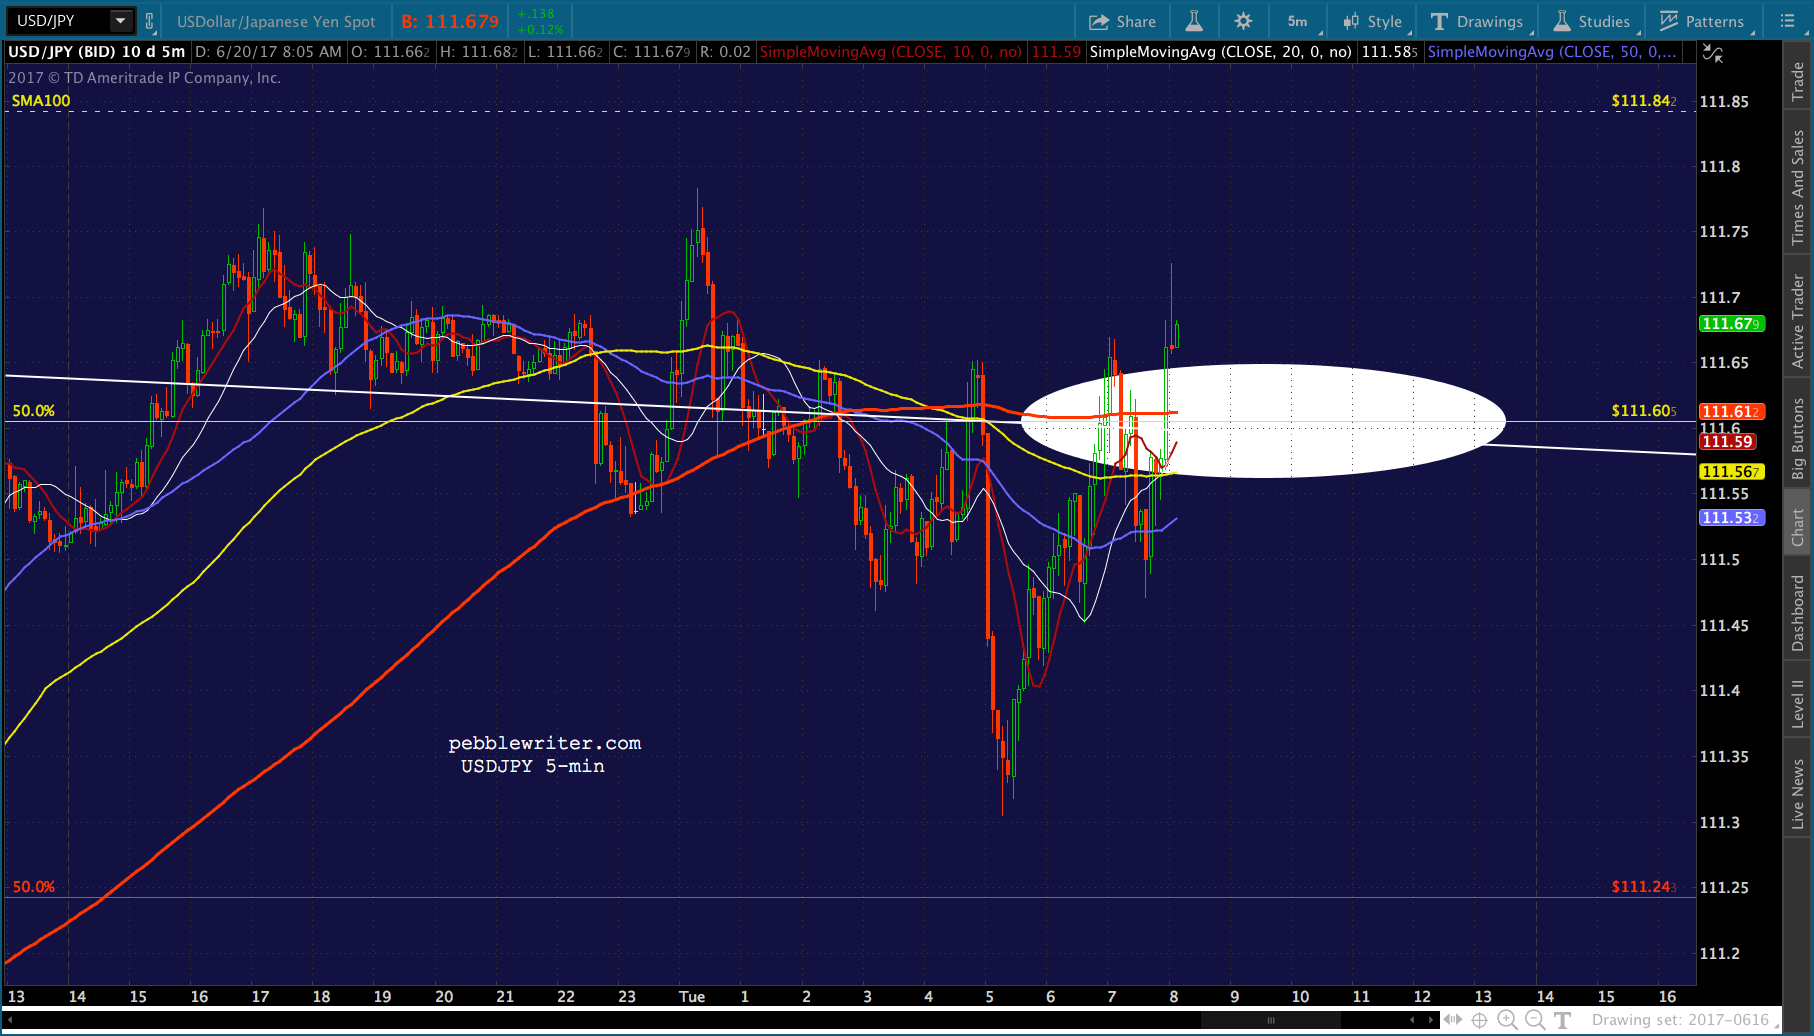
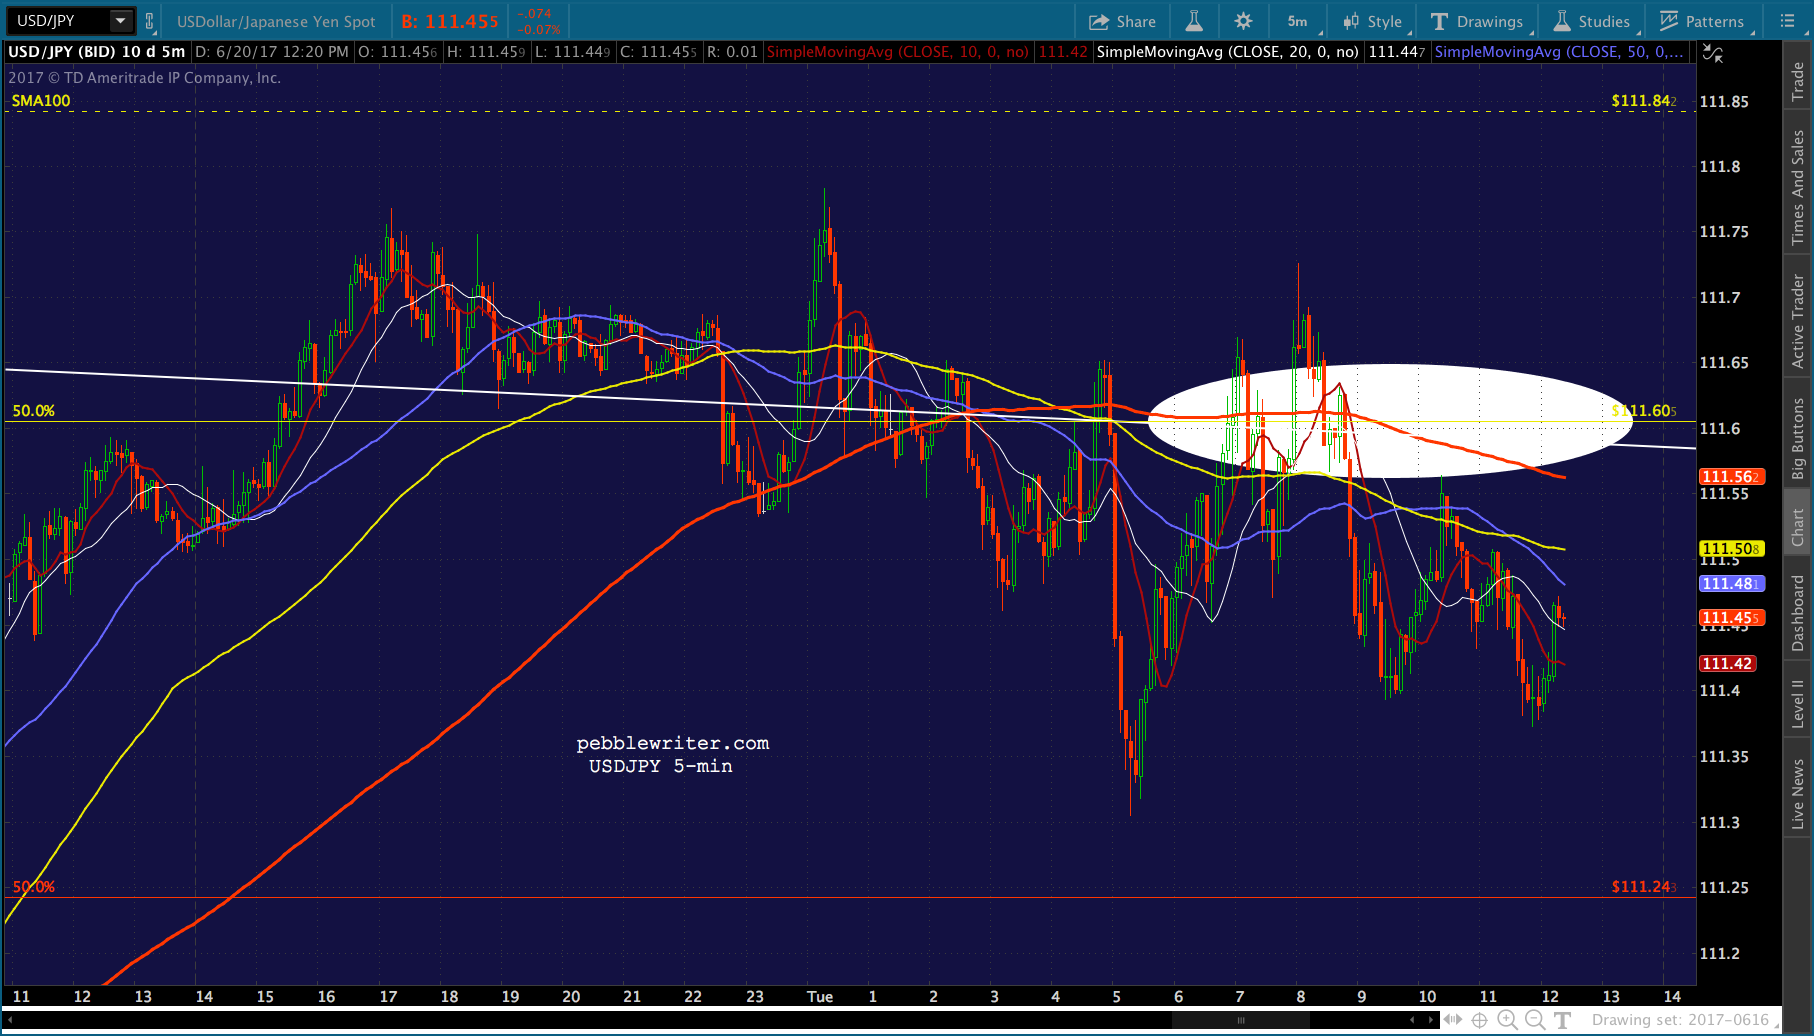
Here’s the basic problem: USDJPY reversing at the top of the falling white channel…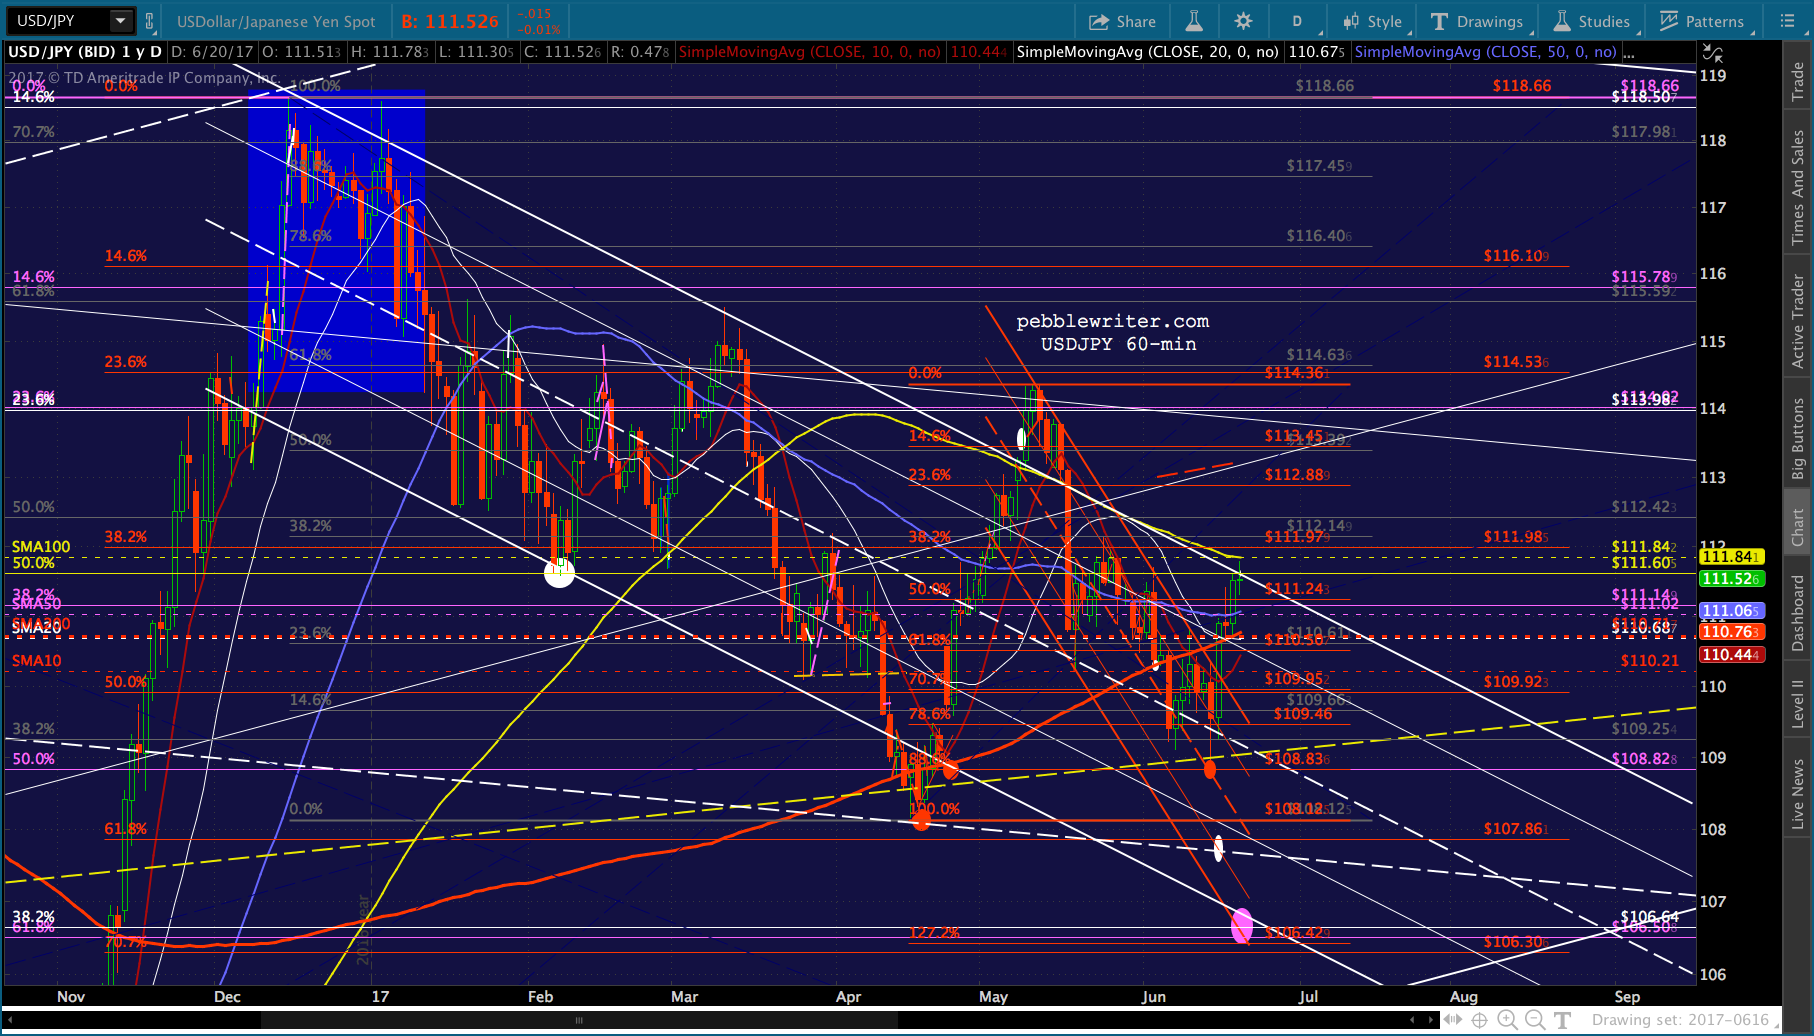 …and, CL dropping through that H&S neckline. It’s a tough combination for stocks, even with VIX trying to counter it.
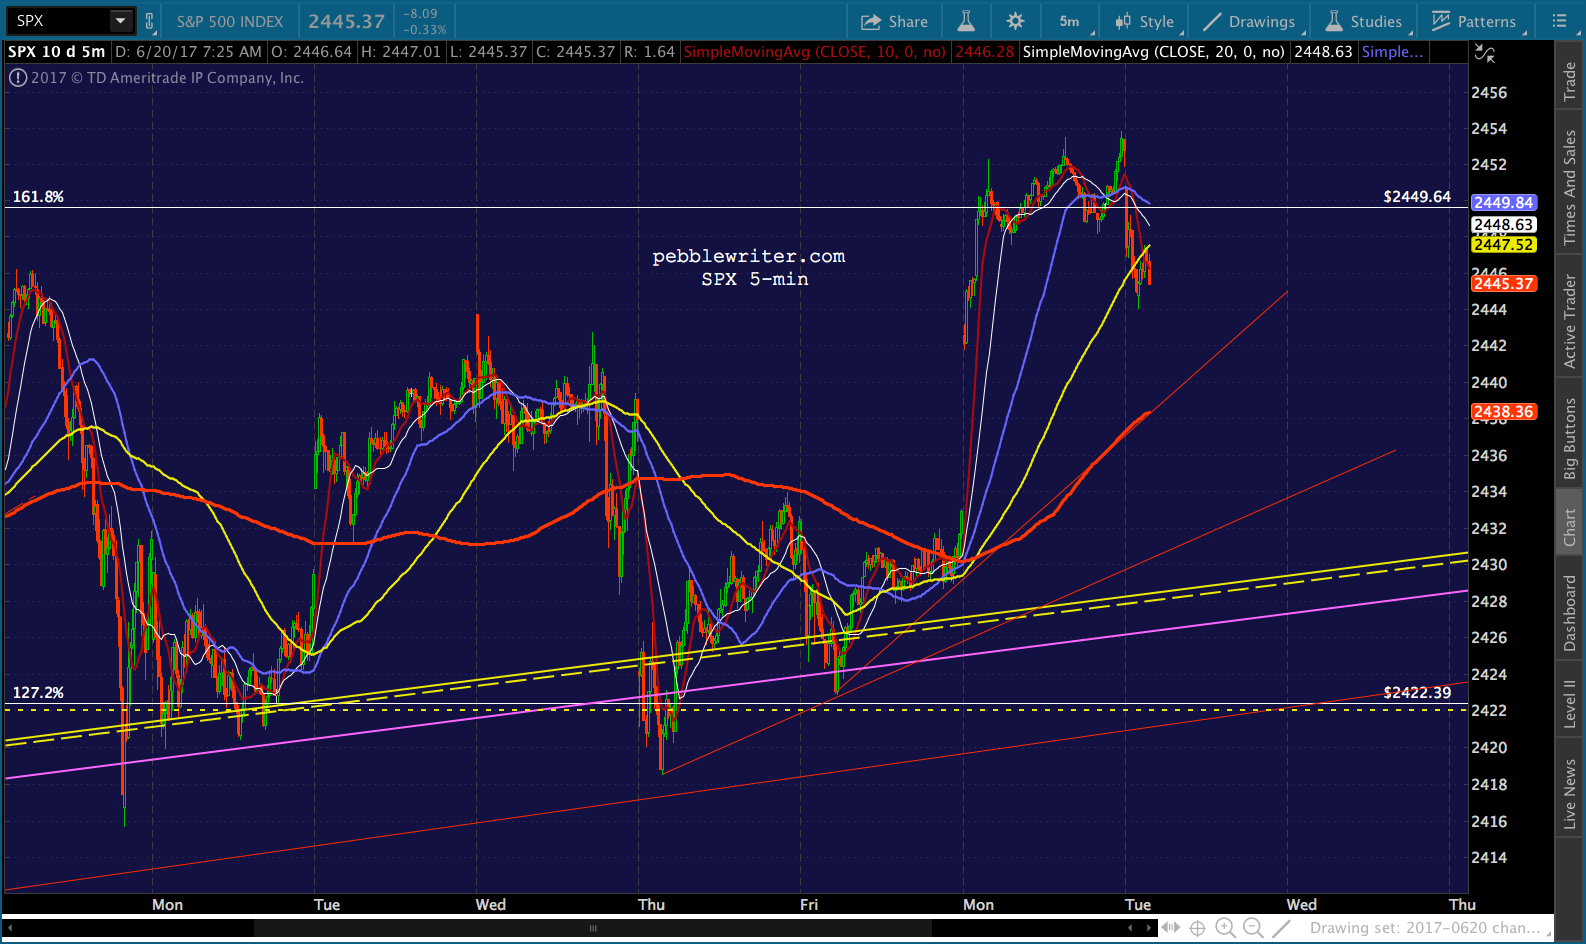
 UPDATE: 11:03 AM
Not looking very good here. I believe the bounce is failing, and would want to be short on any drop through the SMA5 10 at 2447. Still not out of the VIX or USDJPY woods, though.
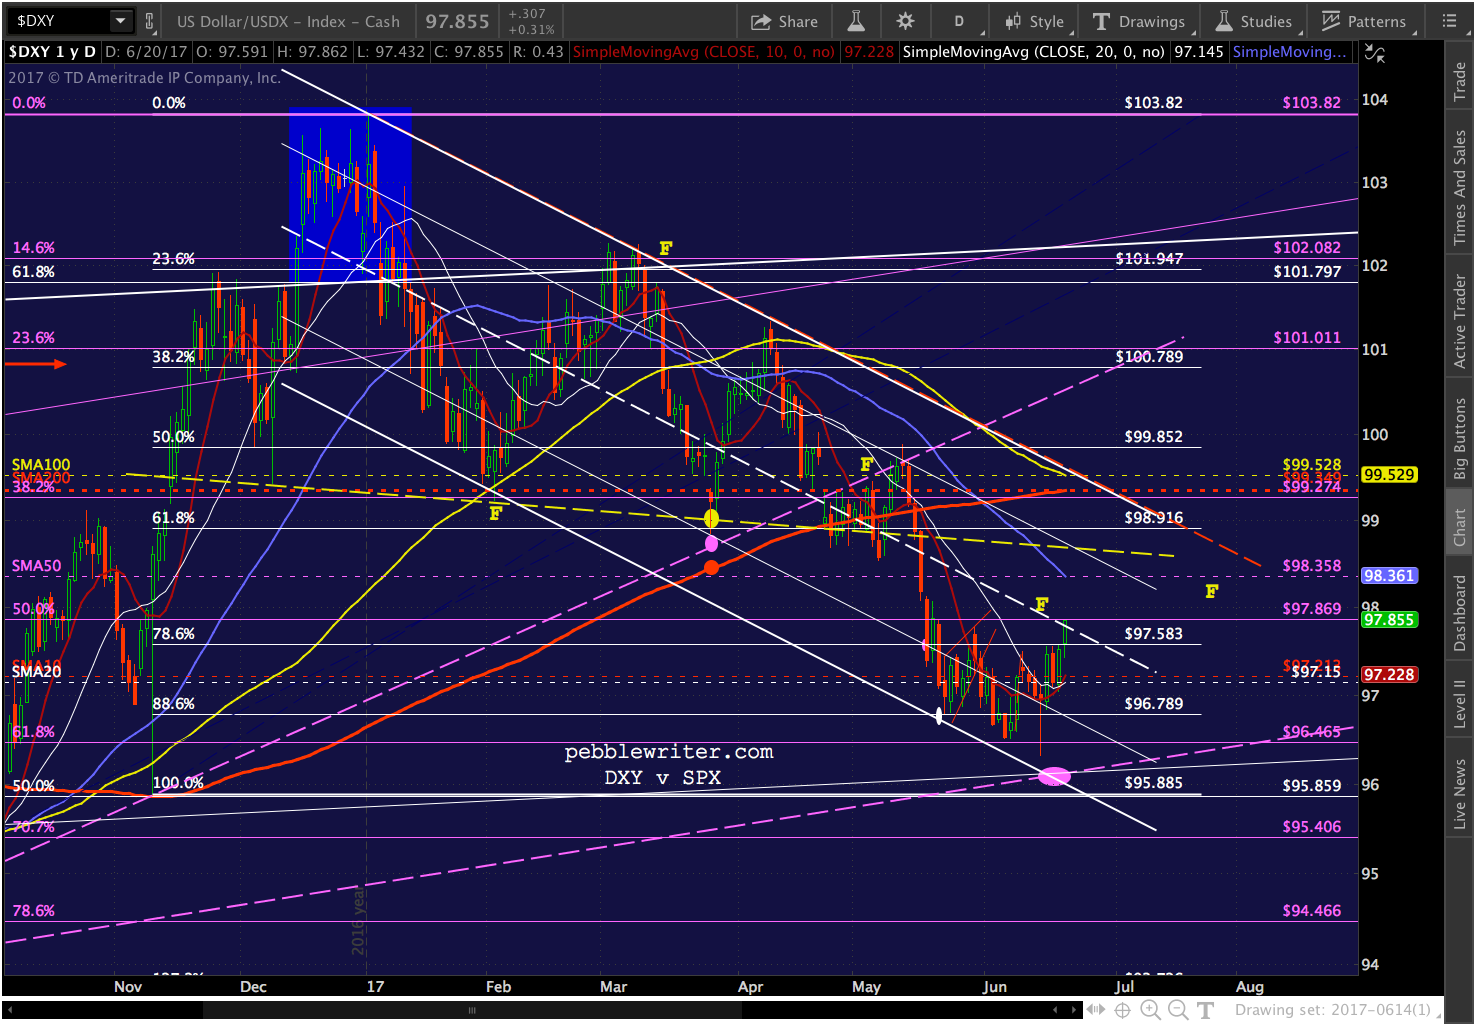
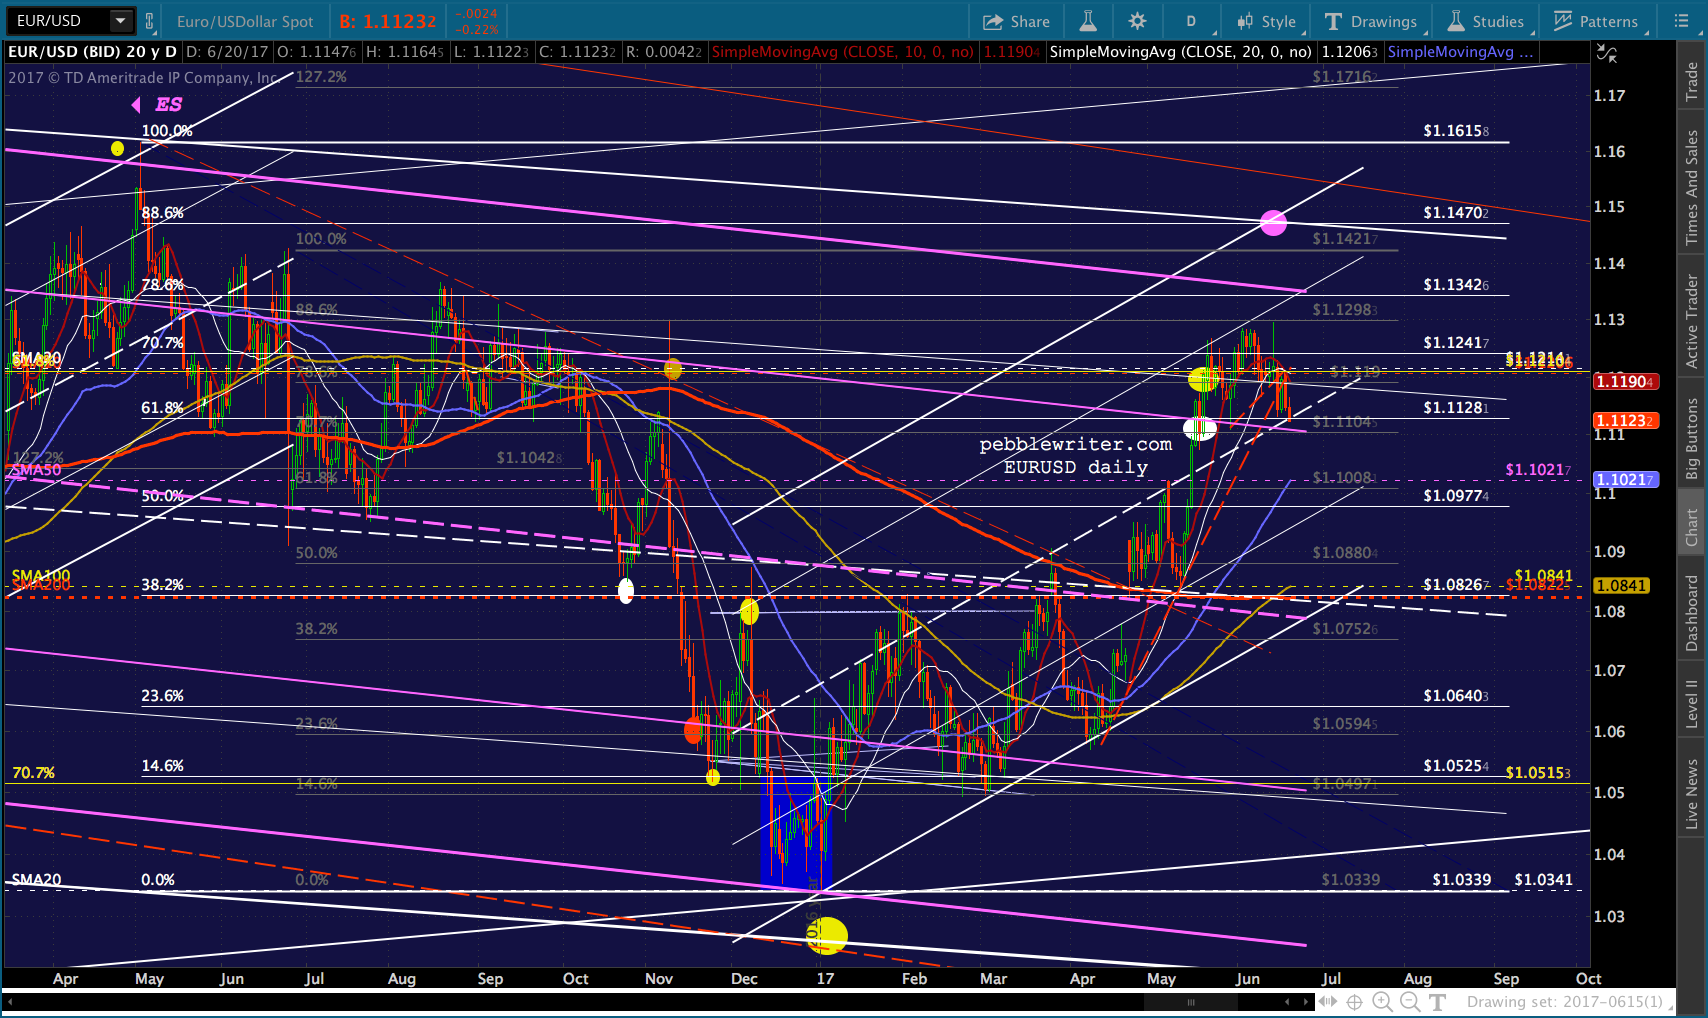
 The two charts that continue to nag me are DX and EURUSD. Last week, I was fairly confident we’d get another leg down in DX to 96.11, corresponding to a spike to 1.1470 in EURUSD. It simply hasn’t happened yet.
But, it would sure make my overdeveloped, Aspergy left brain happy.
 UPDATE: 11:48 AM
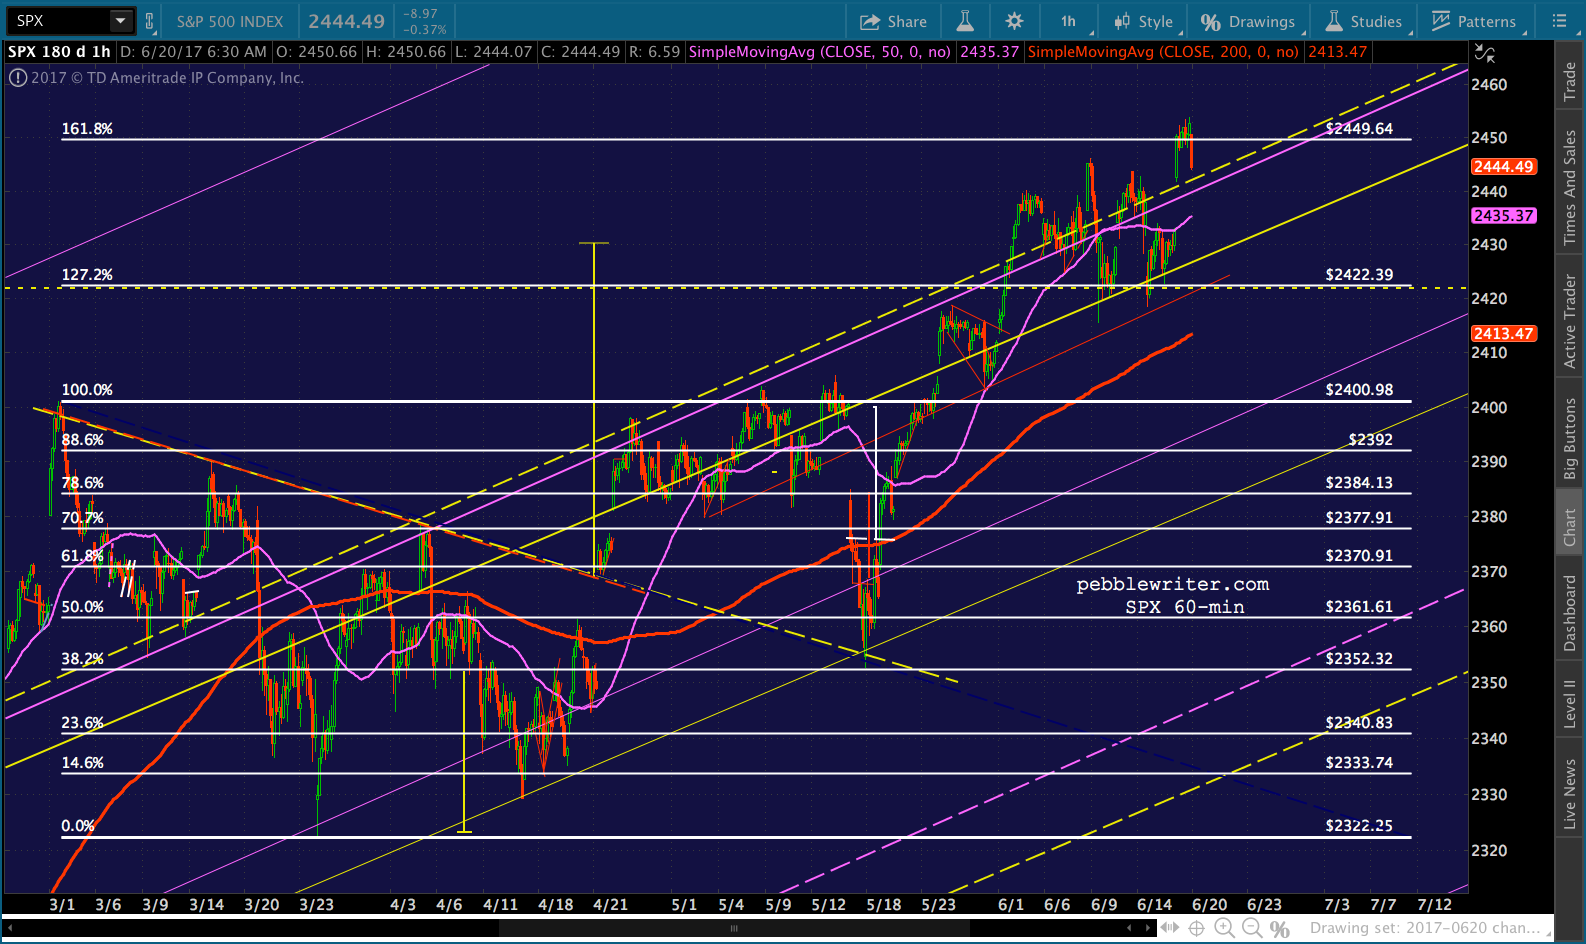
Updated thoughts on this move… I’d look to cover at the SMA5 200 (around 2440.12) but be prepared to remain short or short again if it fails to hold. Obviously, the SMA10 at 2435.48 is also a strong candidate.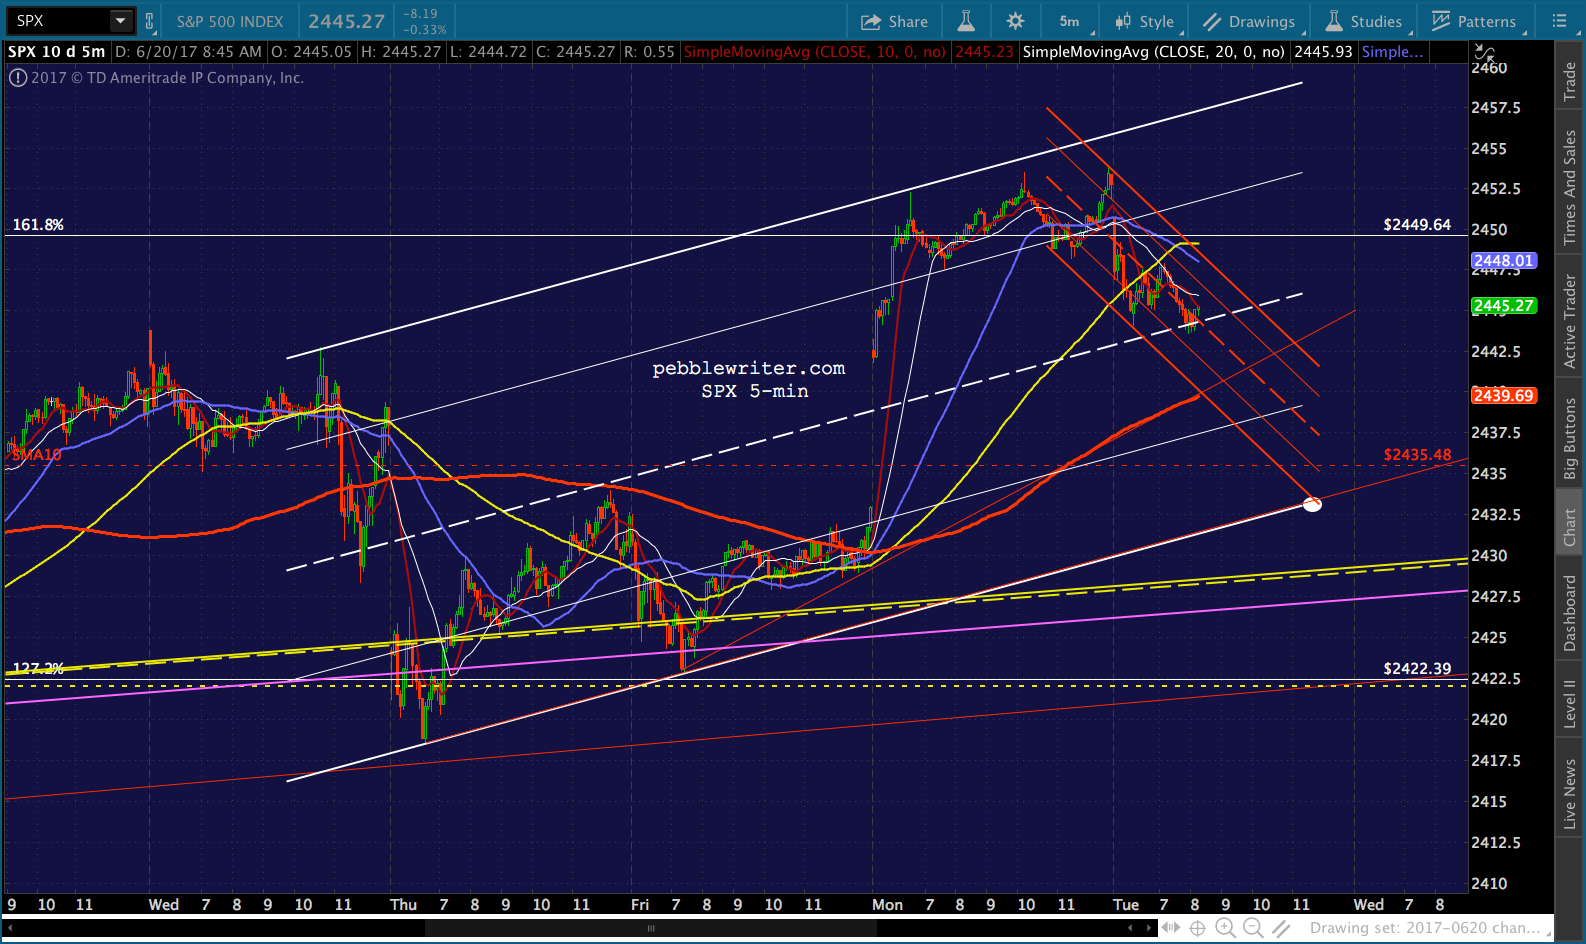 UPDATE: 12:33 PM
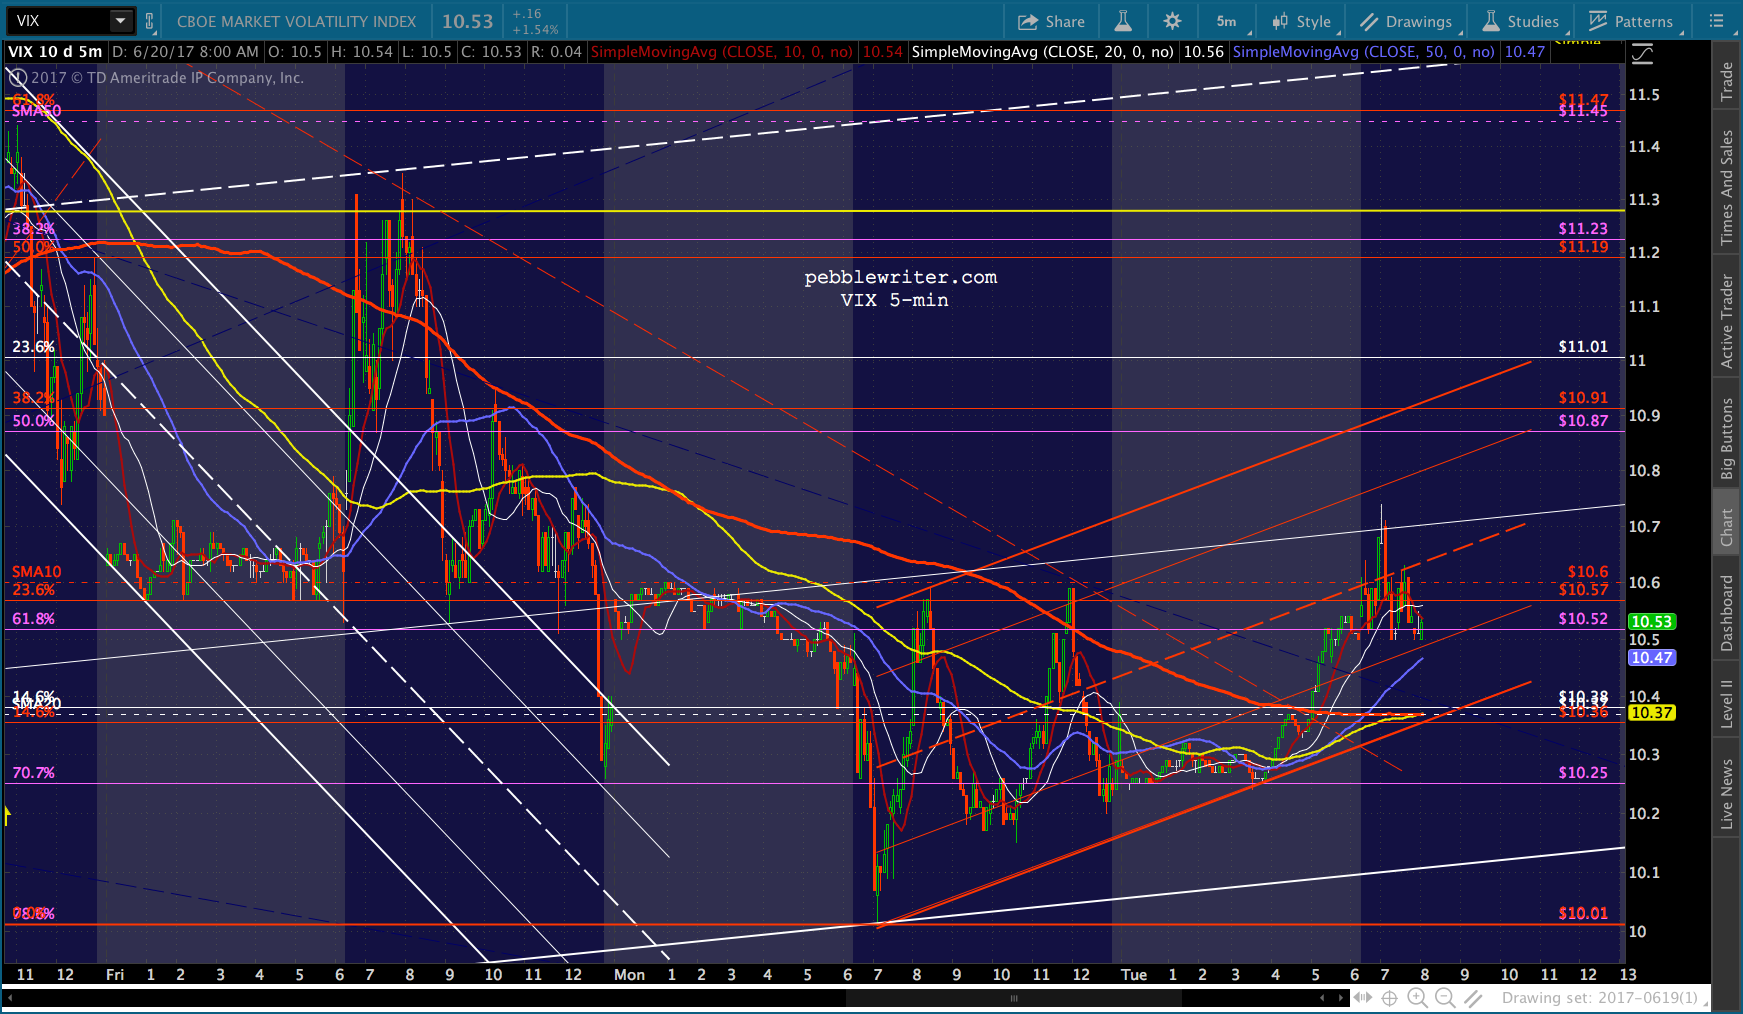
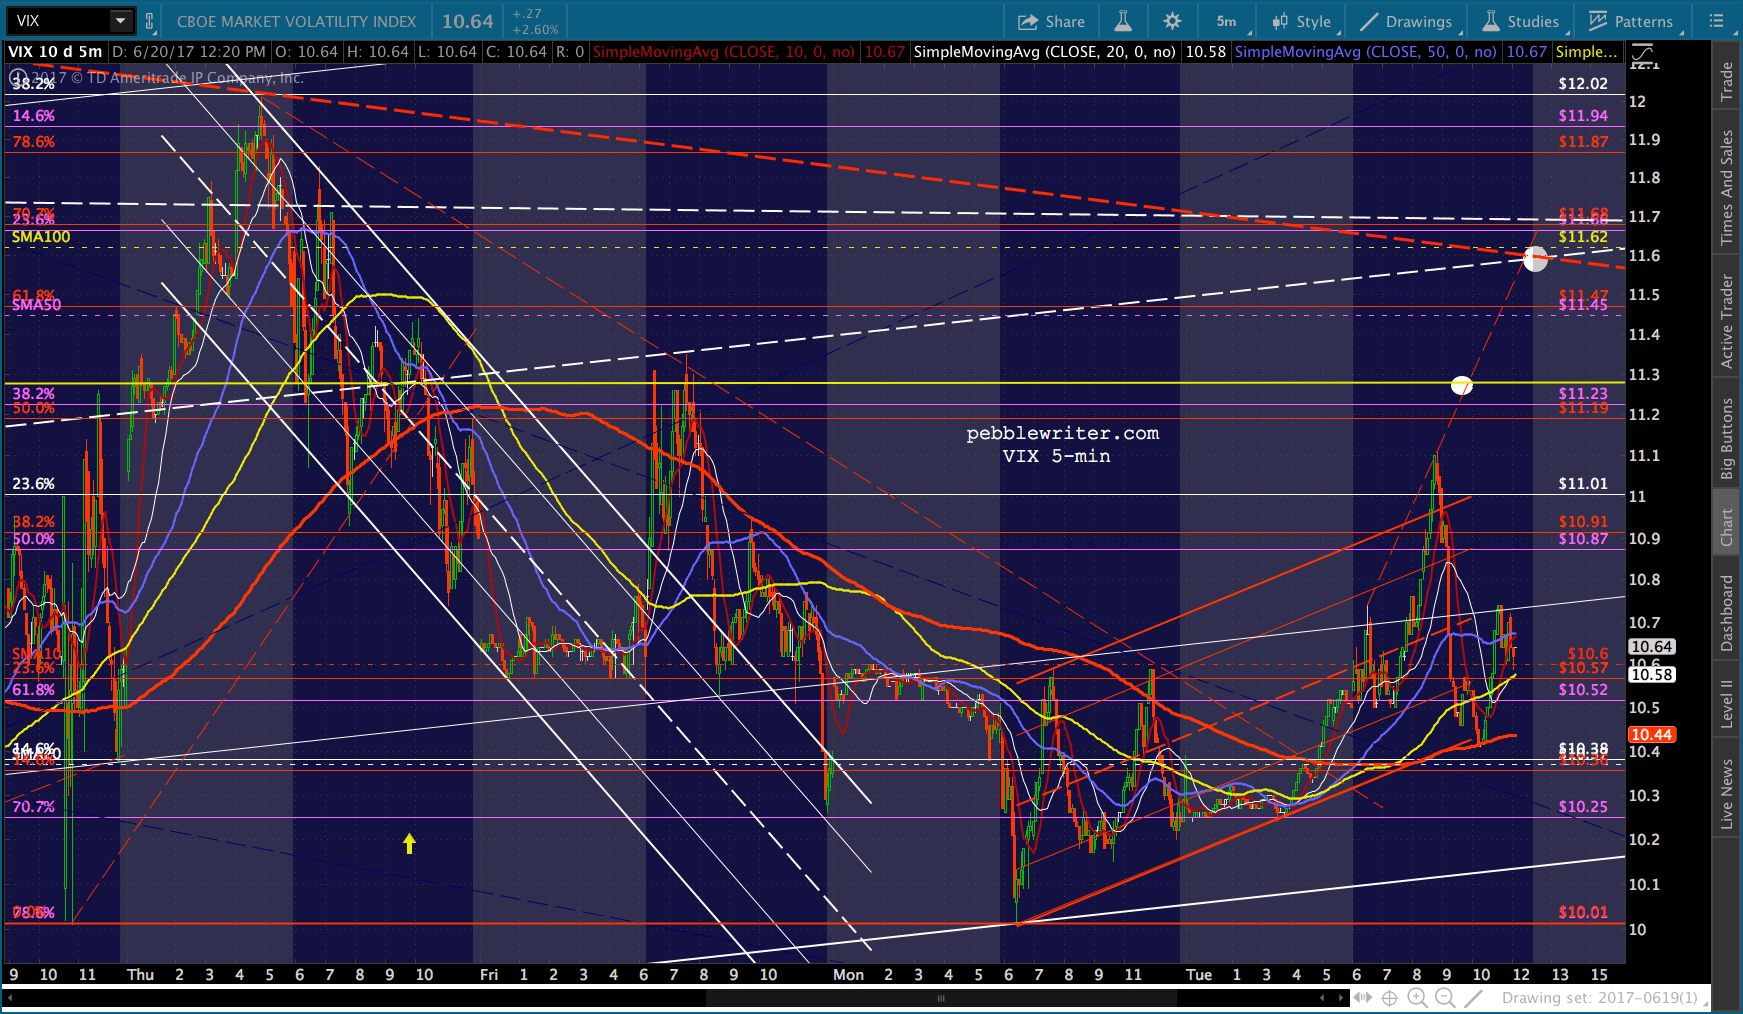
That’s probably close enough for the first encounter. I’d cover here but be prepared to short on any drop through the SMA5 200.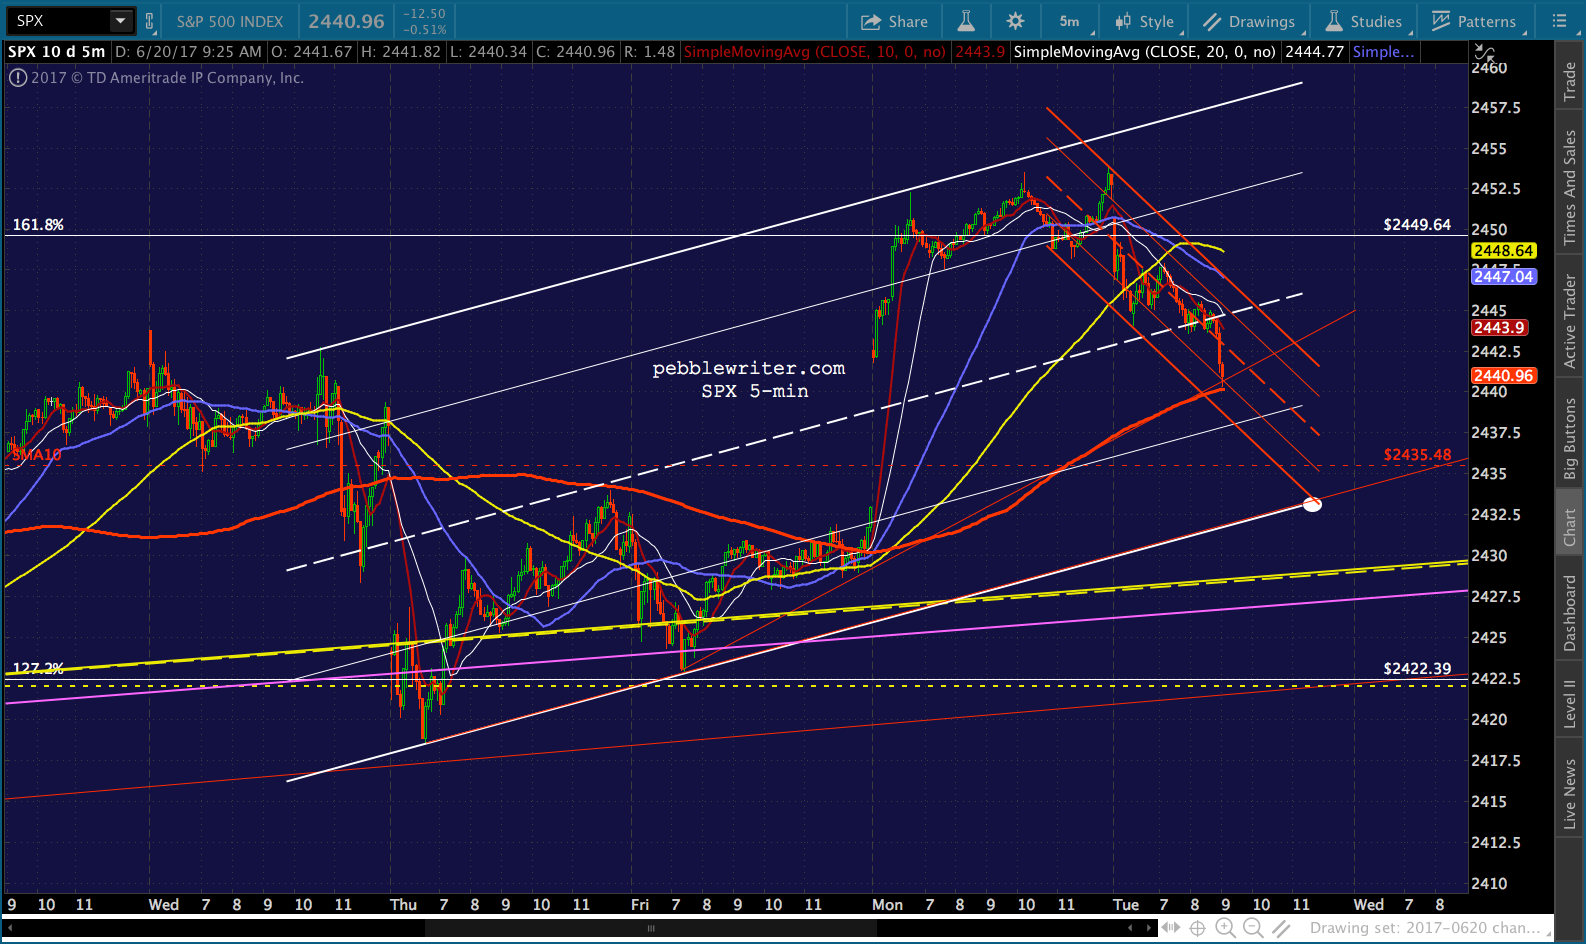 VIX is getting close to the yellow channel bottom again. Might be enough for SPX to get a better tag on its SMA5 200. 11.59 looks interesting, too.
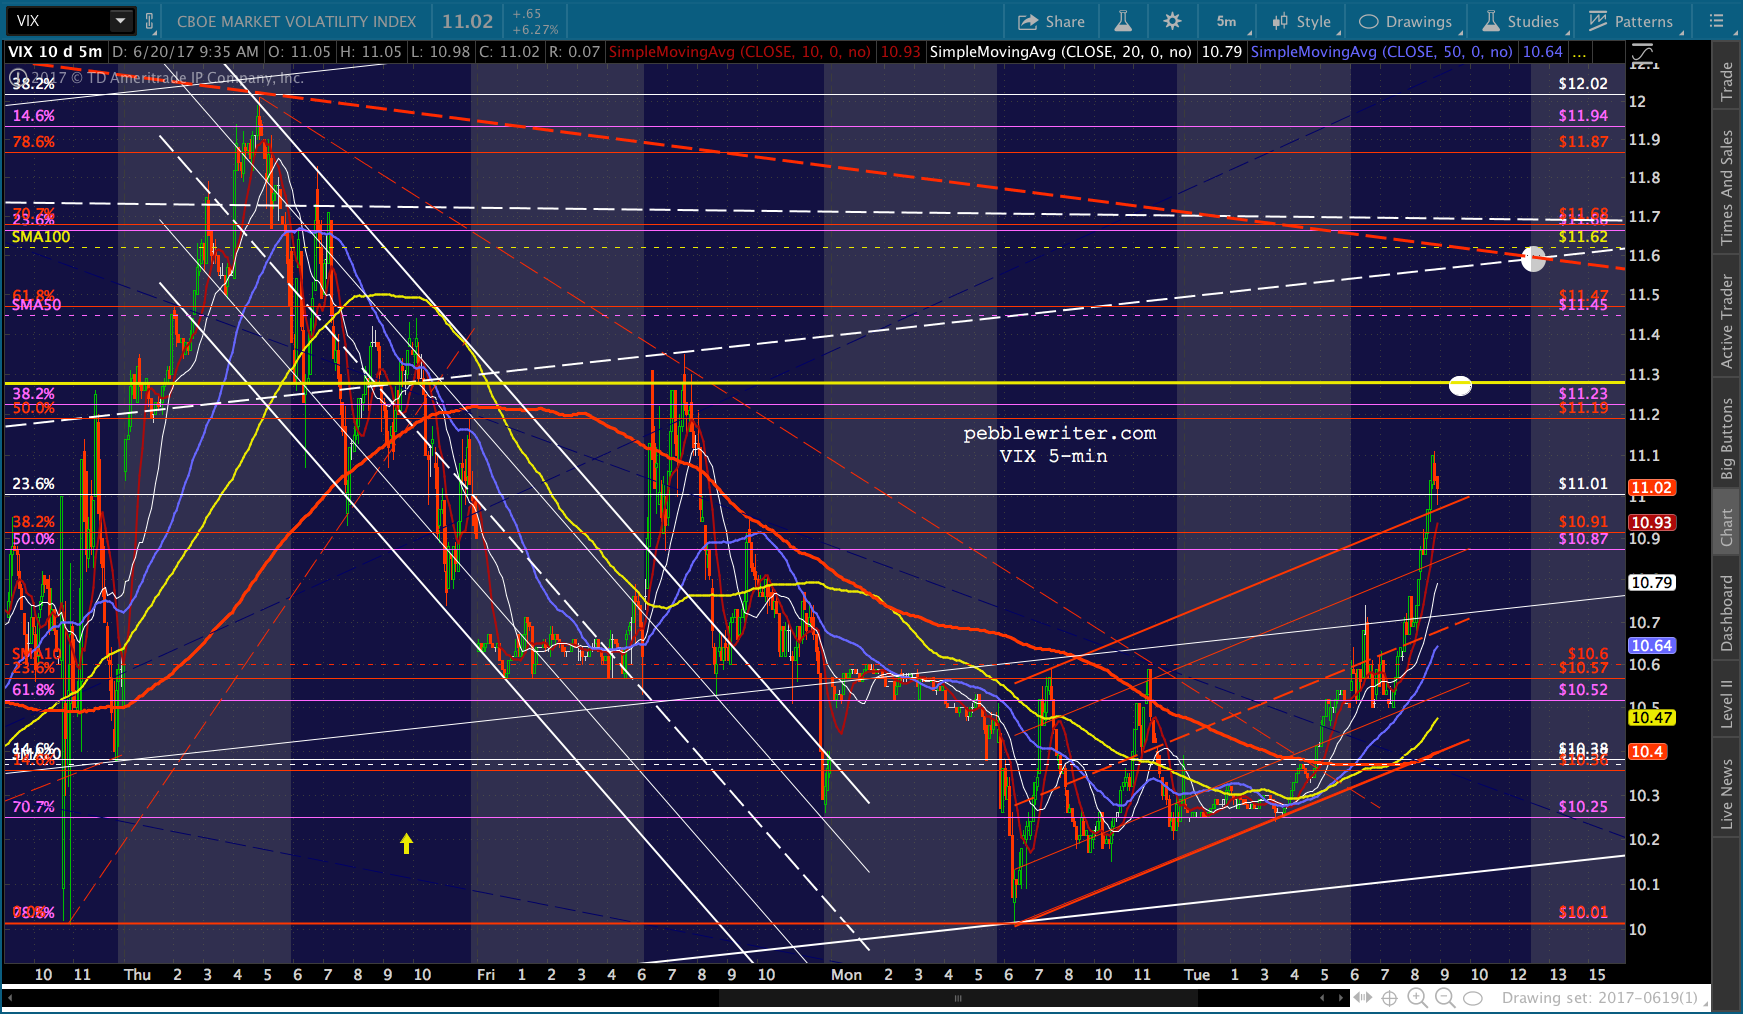 I have to run my daughter to a doctor’s appointment, so I’m going to sign off for a few hours. Should be back around 3 – 3:30.
UPDATE: 3:18 PM
2434 looks good as long as we get a drop starting right here. I’d want to be short.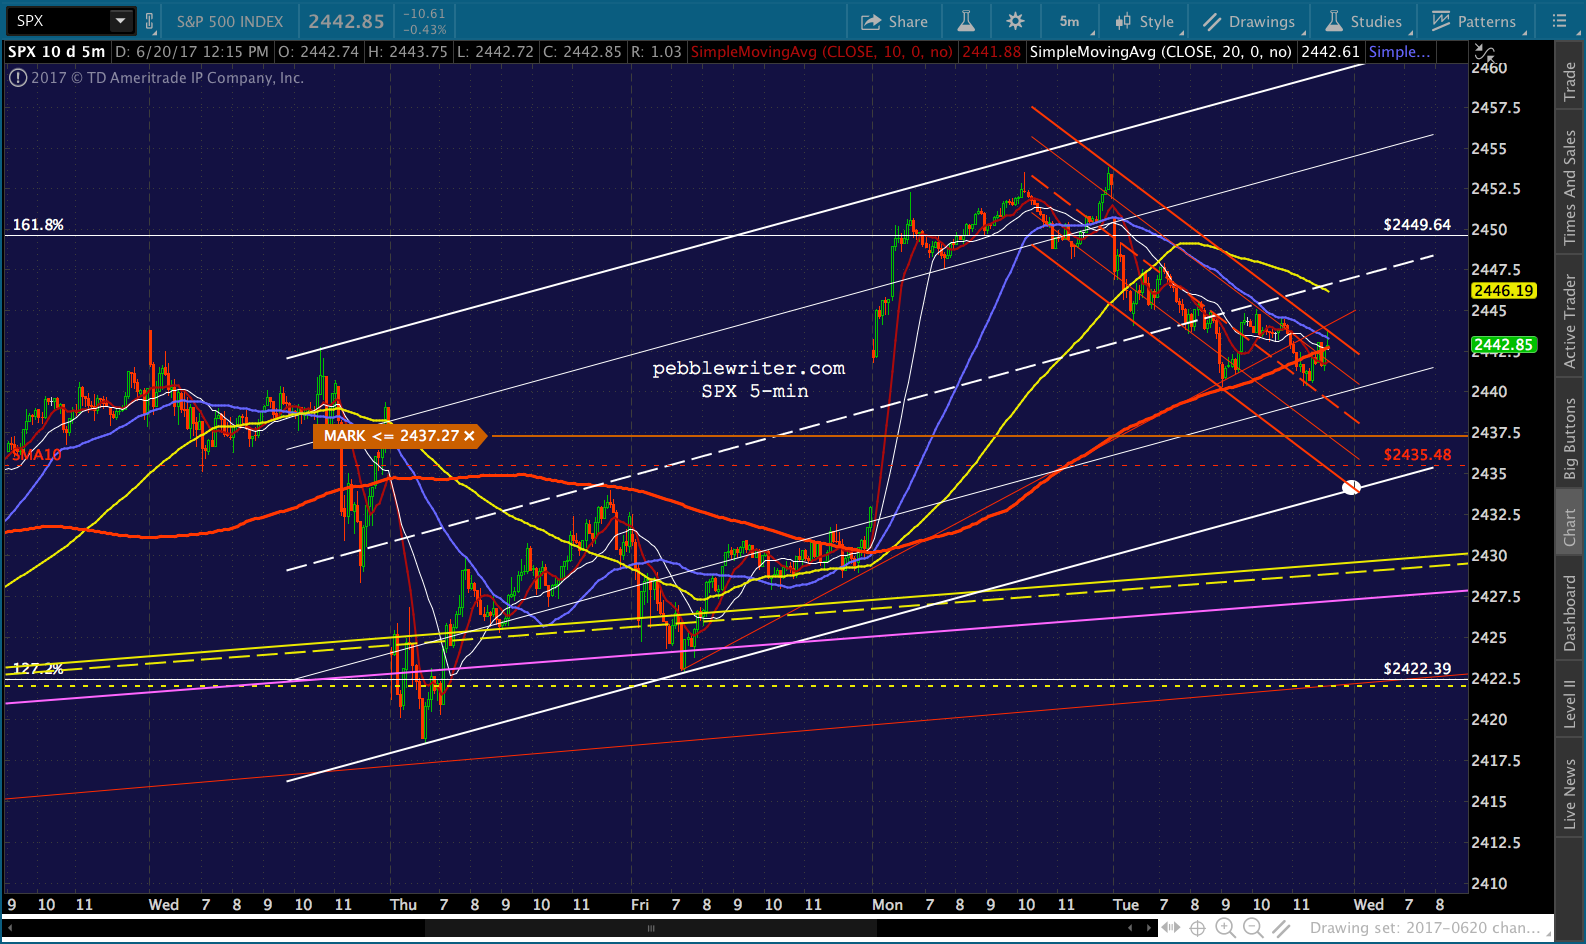
 With the Fibs drawn in…
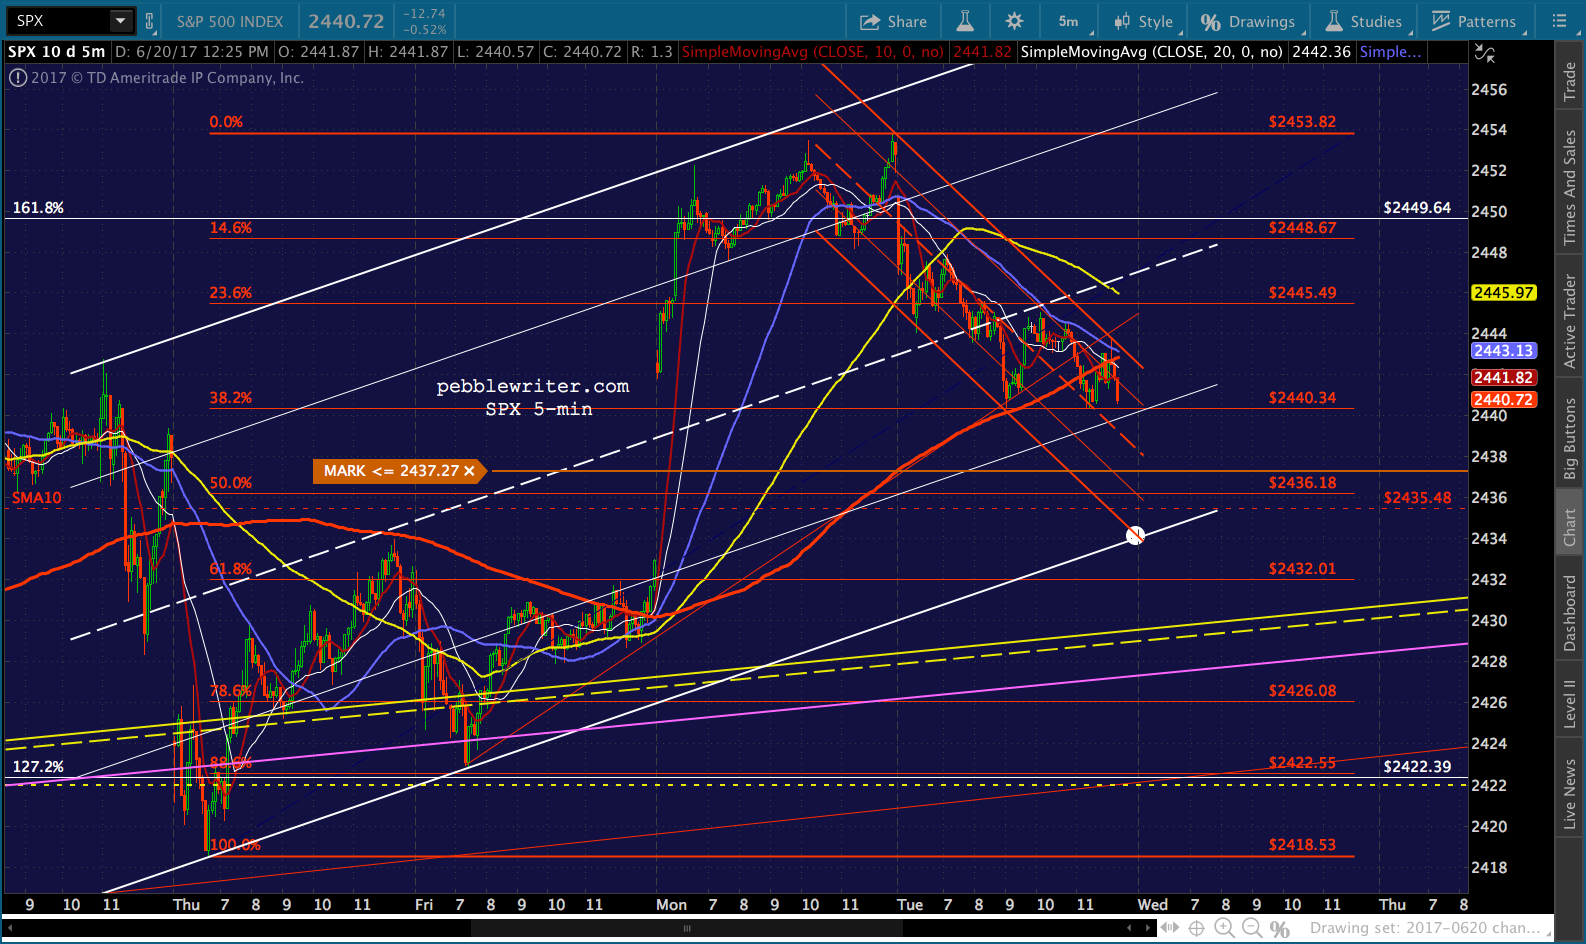 UPDATE: 3:55 PM
Looking to cover here at the close. Cash seems like a good place to be overnight.
 UPDATE: 4:00 PM
Out. I have a bunch of errands to run, will finish up in a few hours.