Month: September 2015

  • Update on Oil: Sep 8, 2015

    Although I post CL charts almost every day in our daily updates, a reader pointed out that it’s been a while since we looked at the big picture.   We called the March bottom very accurately [see: Mar 17 Update on Oil], but we were a few days early on last month’s lows [Aug 19 vs Aug 24, see: Oil Bottoms Out.]

    Our upside target of the falling white channel midline, however, was right on the money.2015-09-07 CL daily 0600Every channel midline tag raises the question of a reversal or breakout.  In this case, it’s all up to the BoJ.

    continued for members

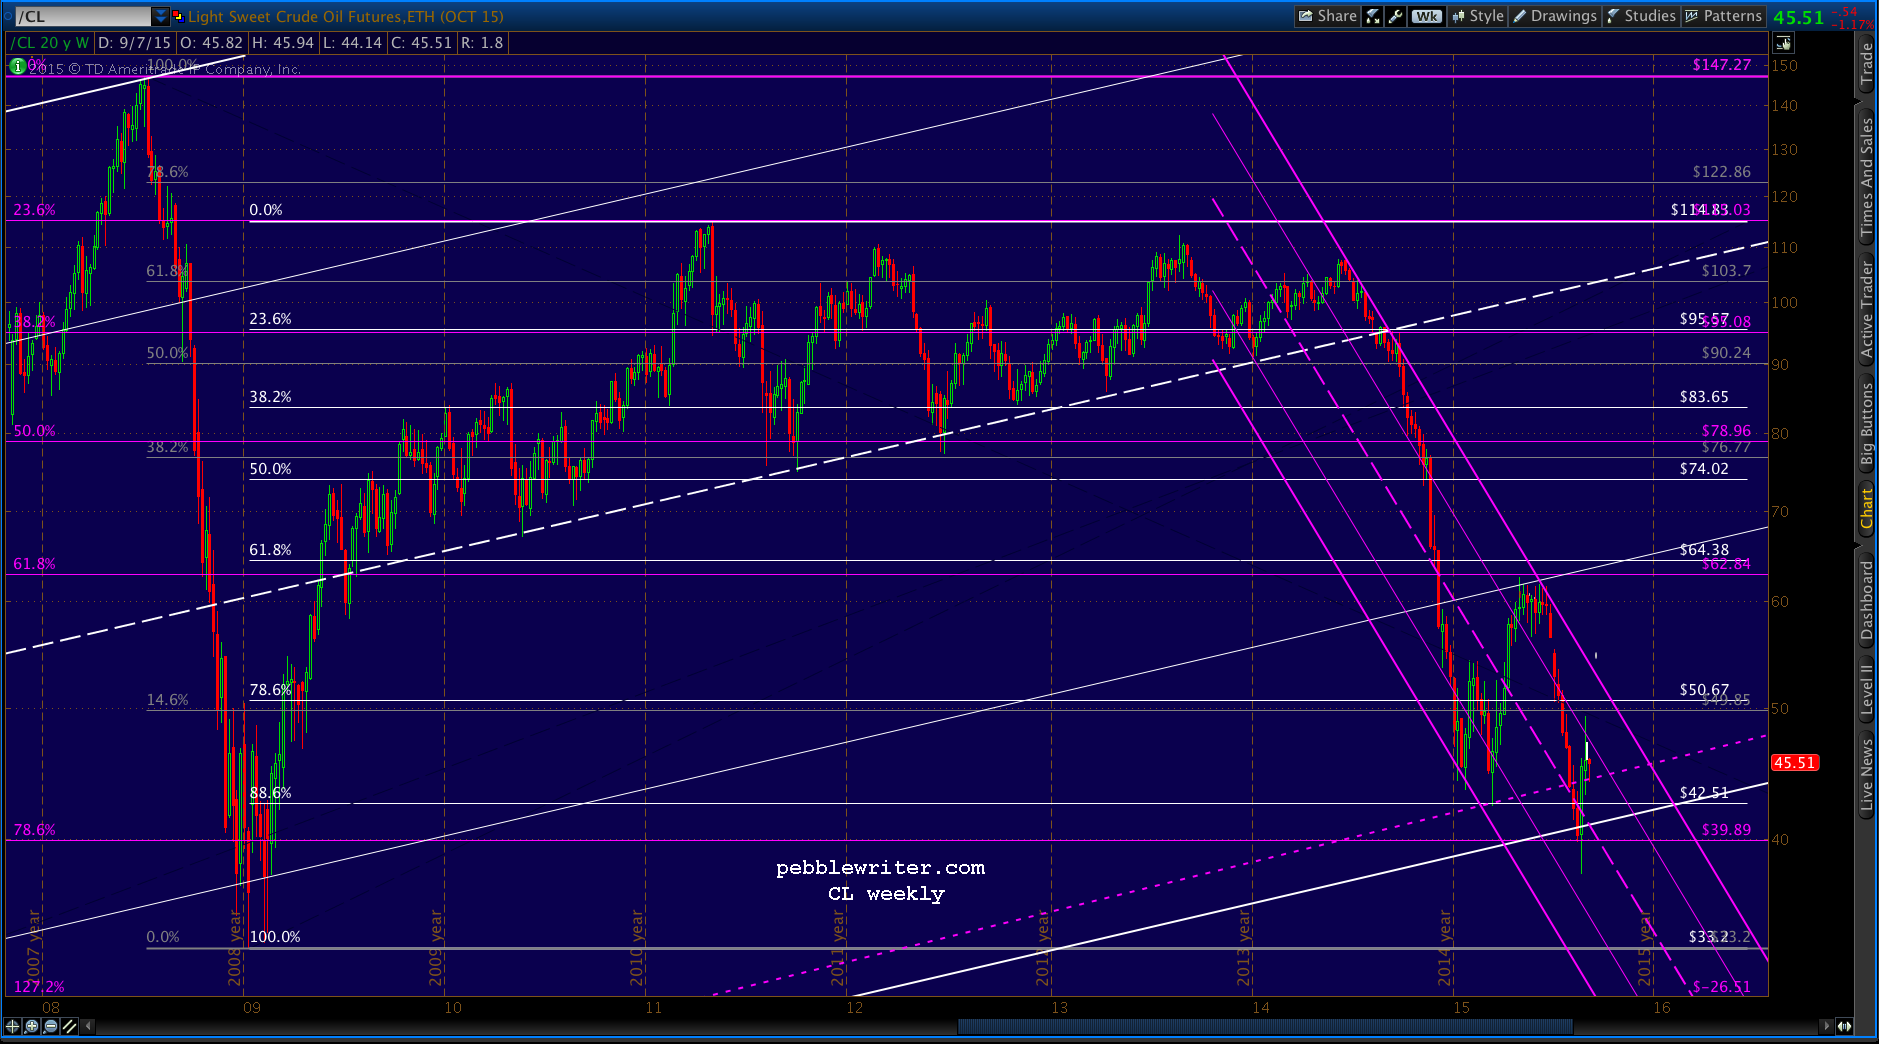
    Note that CL hasn’t quite reached the white midline (42.51) we talked about last week.  Beyond that, the August lows didn’t quite reach the red 1.618 — meaning another leg lower to 37.07 is still on the table.

    The first upside target, should prices break through the midline, is the purple .618 at 54.45.  The intersection with the white channel .786 is around Sep 21.  Other targets: the purple .886 (61.7) intersects the white channel top around Sep 11, and the .786 58.99) intersects it around Oct 9.

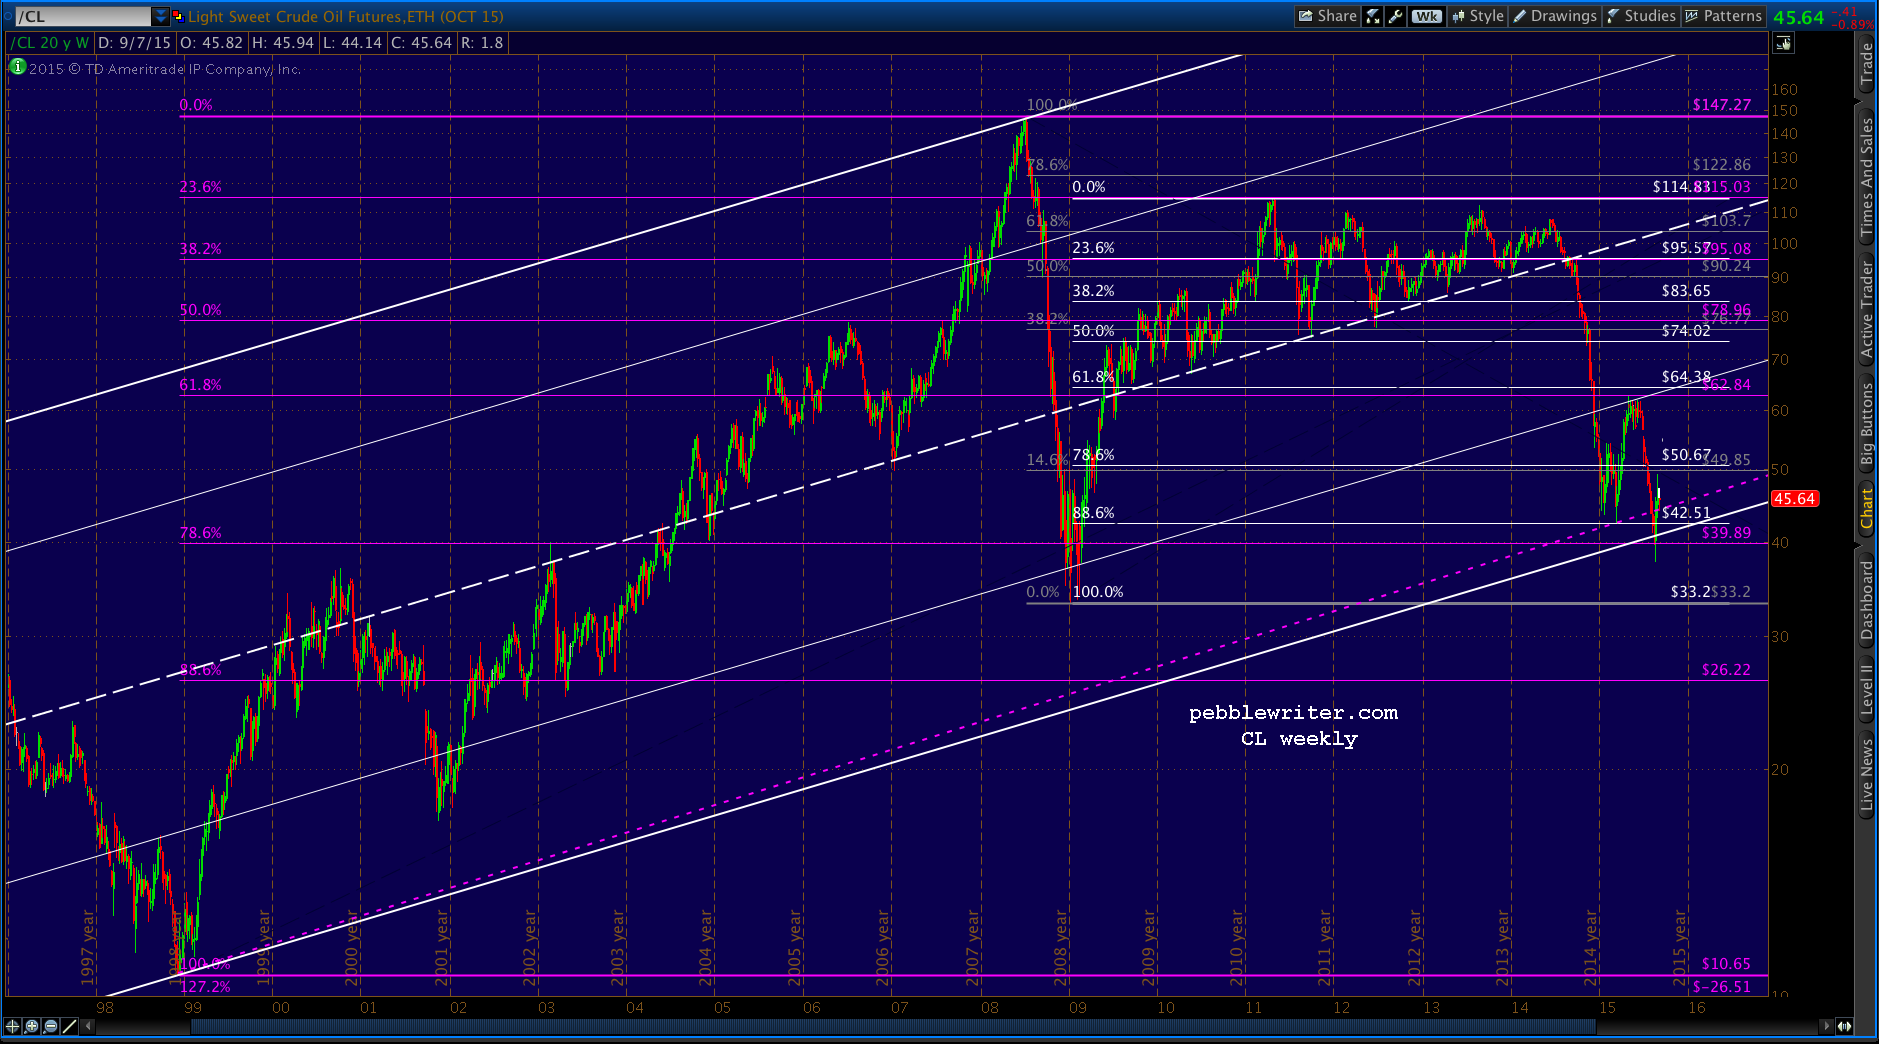
    The bigger picture remains quite bearish, with prices breaking below March’s Bat Pattern completion at the white .886.  And, the bounce off the .886 never even reached the .618.2015-09-07 CL weekly CU 0600As I’ve written about extensively, CL is now in the hands of the central planners — who will lower the price of oil if Japan plays along and depresses the yen even further to keep the yen carry trade alive.

    If, on the other hand, USDJPY is allowed to drop much below 120.11, look for the price of oil to increase — an incentive for the BoJ to do the right thing.  This morning, for instance, oil sold off nicely with USDJPY’s rally to 120.11, and immediately started rallying when USDJPY fell back below.

    So, like both stocks and bonds, CL is now subject to the whims of the central bankers and their efforts to keep QE-fueled prices on the rise.  When it comes to the BoJ, it’s the most effective club TPTB have.

    2015-09-07 CL weekly 0600

  • Why Trading Has Been So Damn Hard

    The futures are up over 30 points at present.  Why?  The headlines will point to China’s massive intervention, or this morning’s economic news, or maybe even speculation over the Fed’s upcoming action/inaction.

    The reality is that the BoJ decided that things were getting out of hand, and they decided to bring USDJPY back to the magic salvation of the .618 Fib at 120.11.2015-09-07 USDJPY CU 60 0600Who in their right mind could have looked at Friday’s falling red channel and felt bullish about USDJPY’s prospects?  As we wrote on Friday:

    Stay short over the weekend and risk a big pop higher over the 3-day weekend.  Go long and risk a 55-pt gap down.

    When equities, bonds and oil are all taking their cues from the whims of the BoJ and their notion of when “enough is enough,” well… that isn’t really a market anymore, is it?

    continued for members(more…)

  • Update on the Dollar: Sep 7, 2015

    In our last major update on March 13, I noted that DX was approaching the 61.8% retracement of the drop from 2001 to 2008 and two key channel lines, writing at the time:

    The white .618 intersects with two major channel lines… Should DX punch through, there’s much more upside.  Otherwise, look for a correction in the very near future.

    As fate would have it, March 13 itself was the high.  DX didn’t go on up and tag the .618.  Instead, it has been forming a slightly falling sideways pattern that would qualify as a flag pattern if it would zip up and tag the potential upper bound.

    2015-09-07 DX daily CU 1800continued for members(more…)

  • Update on VIX: Sep 7, 2015

    VIX finally broke out of its 8-month old flag pattern, and did it in style.  In the process, it did a darn good impersonation of the 1997-2007 cycle.

    2015-09-07 VIX wkly 1800continued for members(more…)

  • Update on EURUSD: Sep 7, 2015

    The volatility we projected in our last EURUSD update has been muted by a continuing lack of correlation with other markets.  The ECB was so long in actually instituting its easing that the markets were able to significantly front-run it, rendering it fairly useless as a carry trade vehicle.

    continued for members(more…)

  • Big Picture

    Not really big, more like medium range. Three weeks tops.  With lots of talking heads embracing the idea of another leg down, let’s evaluate the potential.

    continued for members(more…)

  • Central Banks Feeling the Heat

    The past few days have been all about whether the Fed, ECB and BoJ will or won’t step in and calm the markets.  With a better than expected unemployment rate out this morning, the Fed will be under increasing pressure to raise rates, if even a little.

    Needless to say, this isn’t helping stocks much.  The futures are currently off 25 points, but the real damage was done yesterday after Japan opened and USDJPY retreated once again from the safety of 120.11.

    2015-09-04 USDJPY ES daily 0615It’s pretty clear that stocks have protested each drop through the yellow Fib at 120.11, and each trip above has been rewarded.  While the BoJ wishes it weren’t in this predicament, it is.  And, of course, it’s not by accident.

    continued for members(more…)

  • Charts I’m Watching: Sep 3, 2015

    Note: I’ve posted August’s results (+32.44%), available HERE.  I’ve also let the membership promotion run through today’s trading session for anyone who would still like to take advantage.  It’s a 39% savings off the regular annual price (which increases this afternoon) and a 55% savings off a monthly subscription.  Best of all, it locks in your rate for as long as you’re a member.  For more details and to sign up, CLICK HERE.

    *  *  *  *  *

    Draghi’s comments could be summarized as “all sizzle, no steak.”  They were enough to momentarily boost ES over 20 points — now back down to a mere 9-pt gain.  Importantly, the boost gave USDJPY a chance to reset.  It dropped nearly half a percent with little effect on stocks due to the offsetting ECB effect (and, the fact that the “markets” haven’t yet opened.)2015-09-03 USDJPY 60 0620This was beneficial on two counts.  First, it gives “markets” the opportunity to experience the euphoria of topping 120.11 all over again.  Second, it allows ES to develop a nice little right shoulder in yet another IH&S.  Our decision to go long at 1904.11 on Tuesday is looking better and better.

    For all you daredevils out there, here’s your opening!  Long at 1904.11.  And, if you do, good luck sleeping tonight!

    continued for members(more…)

  • August 2015 Results

    August was one of those months I’ve been dreaming about since last March.  Instead of the drip, drip, drip of 5-point, algorithm-driven melt-ups, we had some good old-fashioned volatility.  Stocks were actually permitted to decline.

    Those few hedge funds still around which have a short bias or are volatility plays also reported great numbers.  Good on them.  Except for a couple of very brief downdrafts in October and December, they’ve been sucking on fumes.  The vast majority of funds, which gave up hedging a long time ago as too expensive and altogether unnecessary, got a pointed reminder of why the word “hedge” appears in their prospectuses.

    Our August numbers were much better than average.  Since calling a top on May 20 [see: The Last Big Butterfly] we’ve anticipated a substantial decline which was forecast by an analog I developed in late March [see: A New Analog.]  Bottom line, it called for a good scare that would prompt BoJ easing.

    Ideally, it’ll be preceded by a sharp downturn which is just scary enough to convince The Powers That Be that another expansion of Japanese QQE is vital to the global economy.

    We’re waiting for the BoJ’s reaction, but I’d say this decline was reasonably scary.

    2015-09-02 SPX AugustThe Nikkei 225 fell over 18% in less than a week. And, USDJPY had its biggest single-day decline since May 6, 2010 which, in turn, prompted the biggest single-day SPX decline since May 6, 2010.  Some readers may recall that 2010 scare (and the hints regarding QE2 that were dropped at Jackson Hole shortly thereafter.)

    This latest decline, and all the volatility — both preceding and following it — was favorable to our style of market analysis, which focuses on changes in direction as forecast by chart patterns, harmonic patterns and, of course, analogs.  Unfortunately, the volatility led to what is, in my opinion, an excessive number of intra-day calls – averaging almost 5/day.

    It’s always a struggle to find a balance between performance and level of activity.  The more hectic a session, the more head fakes and reversals – which leads to more intra-day calls.  August was an extremely hectic month, with six sessions involving rare 50-point ranges and many calls which were reversed within minutes after being posted.

    Buy-and-hold and swing trading members, who aren’t as focused on intra-day trading, are reminded to check the Current Forecast page for my view on the next few weeks.

    By the way, it has become quite common for whatever trend is in place at the end of each session to be reversed the following day — especially when the trend is down.  It’s not at all unusual for SPX to plunge below support at the closing bell, only to gap up by 10-20 points the following morning.  It happened just this morning (Sep 2.)

    So, while I usually offer an opinion as to what I expect the following day, these opinions are wrong nearly as often as they’re right.  It’s a lovely little feature of the predatory algorithmic trading that has prevailed since late 2011.  I urge members not to put too much stock into these end-of day forecasts, and to trade on them only when they can hedge or at least monitor their position overnight.

    One last note: a member pointed out last night that I still hadn’t changed the membership pricing back to the normal rates following our recent promotion.  Unfortunately, I’ve been working 15-18 hour days lately and have just been too busy.  I’ll change it back following today’s close, giving anyone who’s interested one last chance at a great deal.  For more info and to sign up, CLICK HERE.

    Screen Shot 2015-09-02 at 7.51.49 PMScreen Shot 2015-09-02 at 7.52.14 PMAugust’s results raised the median monthly figure from 13.76% to 16.08%. The monthly results for 2015 to date are as follows.

    Screen Shot 2015-09-02 at 7.47.14 PM

    A reminder, these results reflect the performance of a theoretical portfolio where the S&P 500 index is bought or shorted based on signals generated by my research.  Your mileage will vary.  No leverage is assumed; the portfolio is assumed to be 100% long, 100% short or 100% cash.

    Prices listed reflect the index at the time that tops/bottoms are called and are believed, but not guaranteed, to be accurate. There is typically a 2-3 minute lag in the posting of each call.  Dividends, transaction costs and the cost of any hedging are not included.  And, past results are not necessarily indicative of future results.  See Disclosures and Use Agreement for important information.

  • All Clear or Dead Cat Bounce?

    One of the biggest challenges in charting the day after a big plunge is whether the subsequent rebound is the start of a new trend or a relief rally before the real ugliness sets in.  With the futures currently up around 20 points, our decision to go long at 1904.11 yesterday afternoon looks like the right one.

    For all you daredevils out there, here’s your opening!  Long at 1904.11.  And, if you do, good luck sleeping tonight!

    Will we still feel the same after today’s action?

    continued for members(more…)