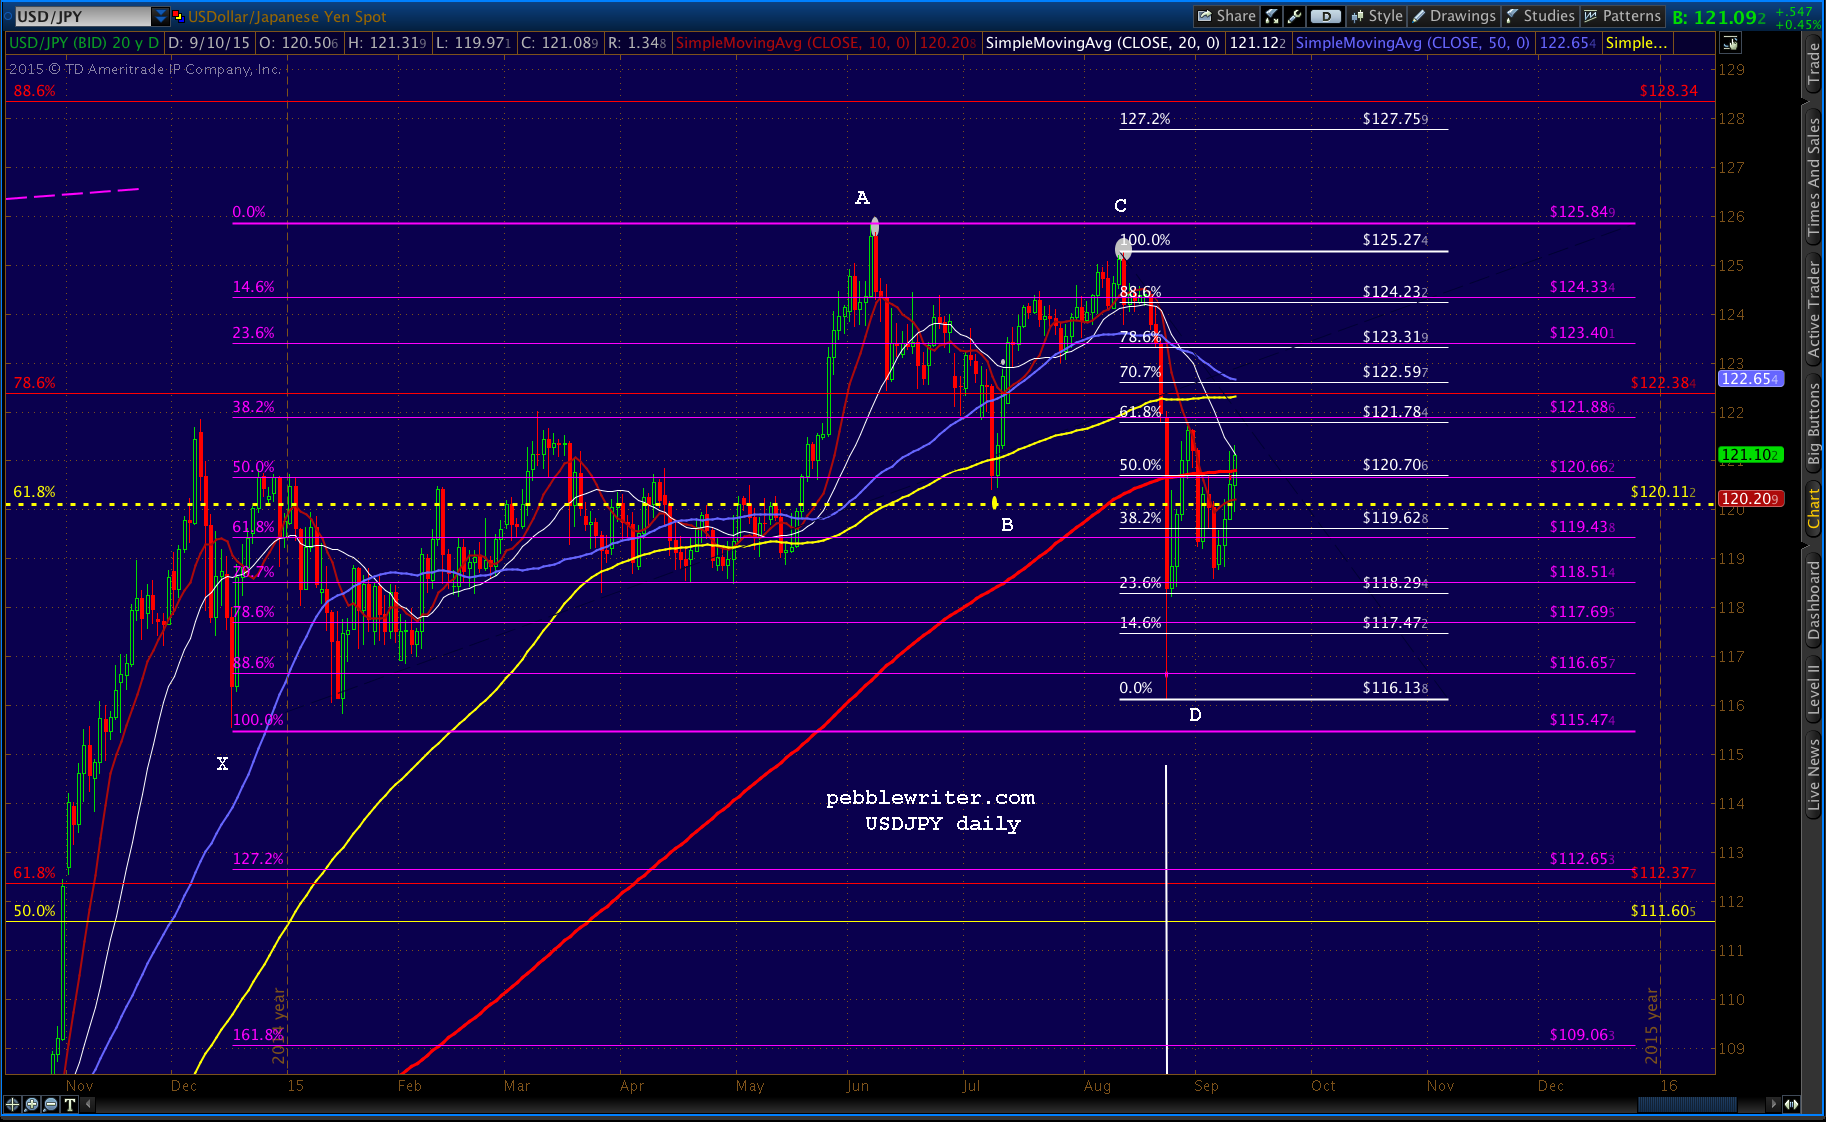
Yesterday’s USDJPY recovery above the key Fib at 120.11 was good for 48 points on SPX. So, it stands to reason that today’s USDJPY pop above the SMA200 should be good for more of the same.
Abe announced a 3.3% corporate income tax rate cut to take effect sometime next year (and, he’ll respect them in the morning) which, coupled with USDJPY topping the SMA200, was good for an 800-pt gain in the Nikkei futures.
While the price action is in keeping with our analog, we have to wonder what could prompt another leg up? continued for members…
It’s pretty clear that NKD is testing the falling white channel midline, and has a long ways to go to regain the broken H&S neckline at 19,240.
SPX looks likely to reach the purple .886 at 1983.17 — also the bottom of the original falling gray channel which, truth be told, was a far better channel than the expanded red one ever was.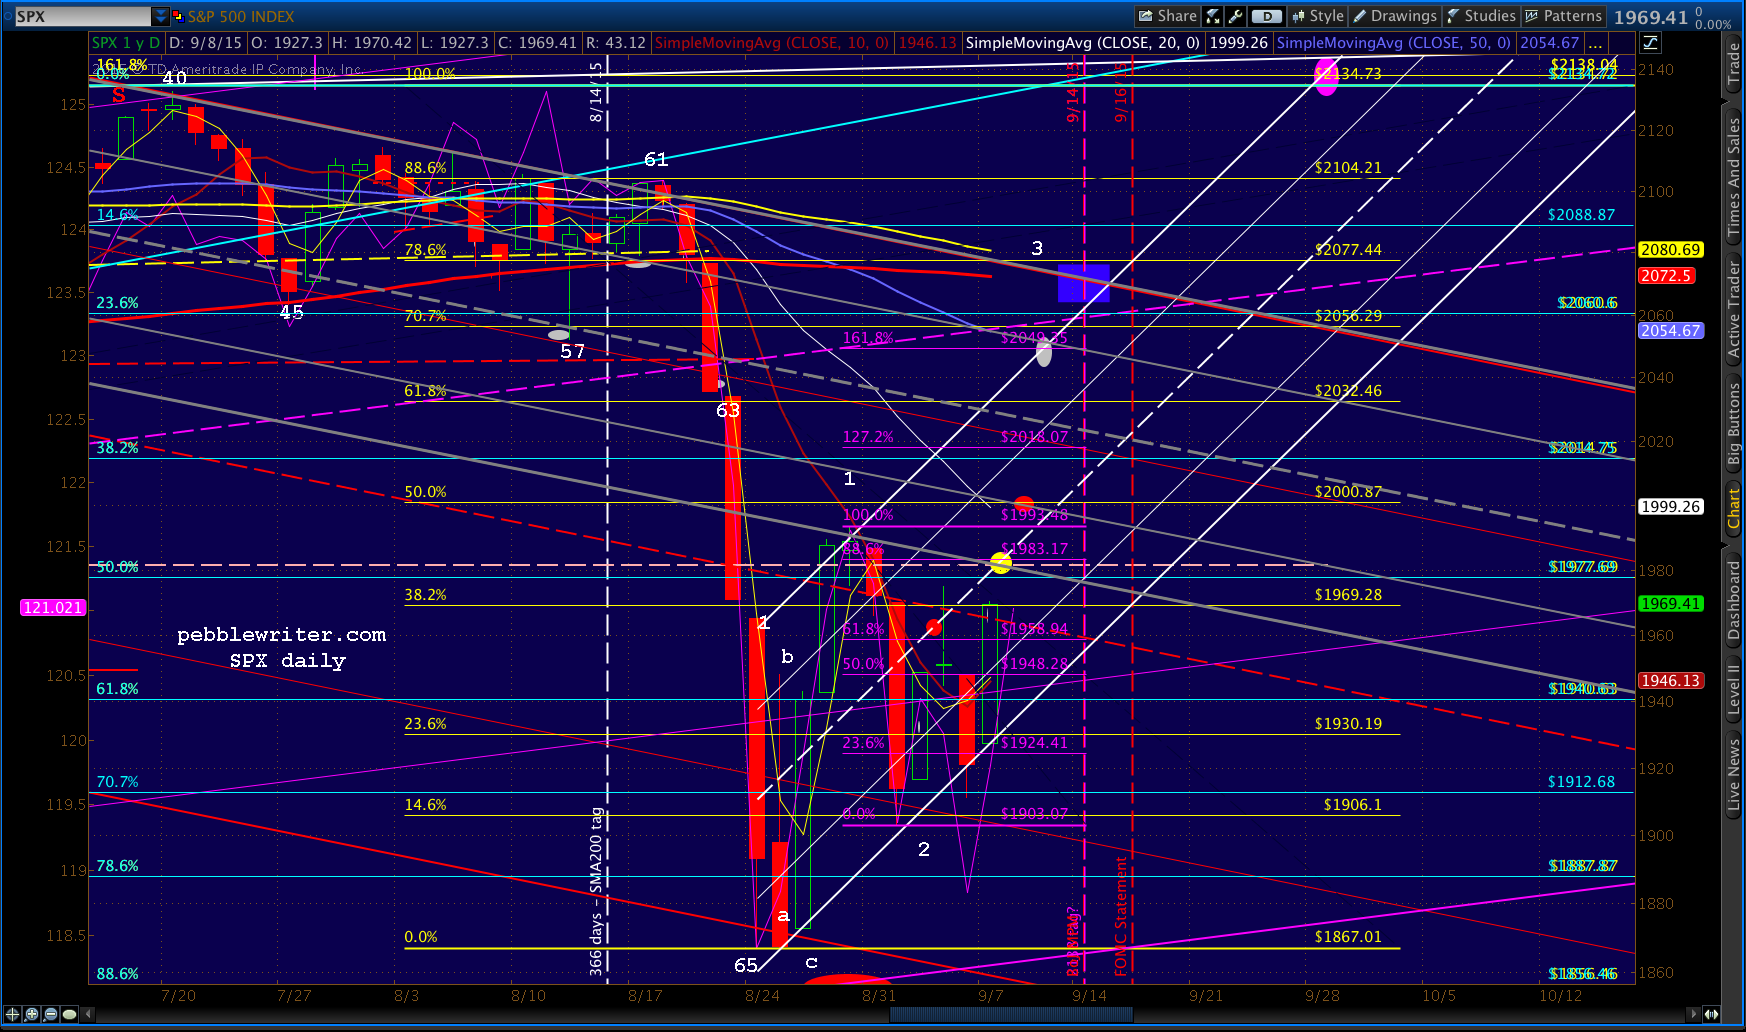 Here’s a peek at the bigger picture.
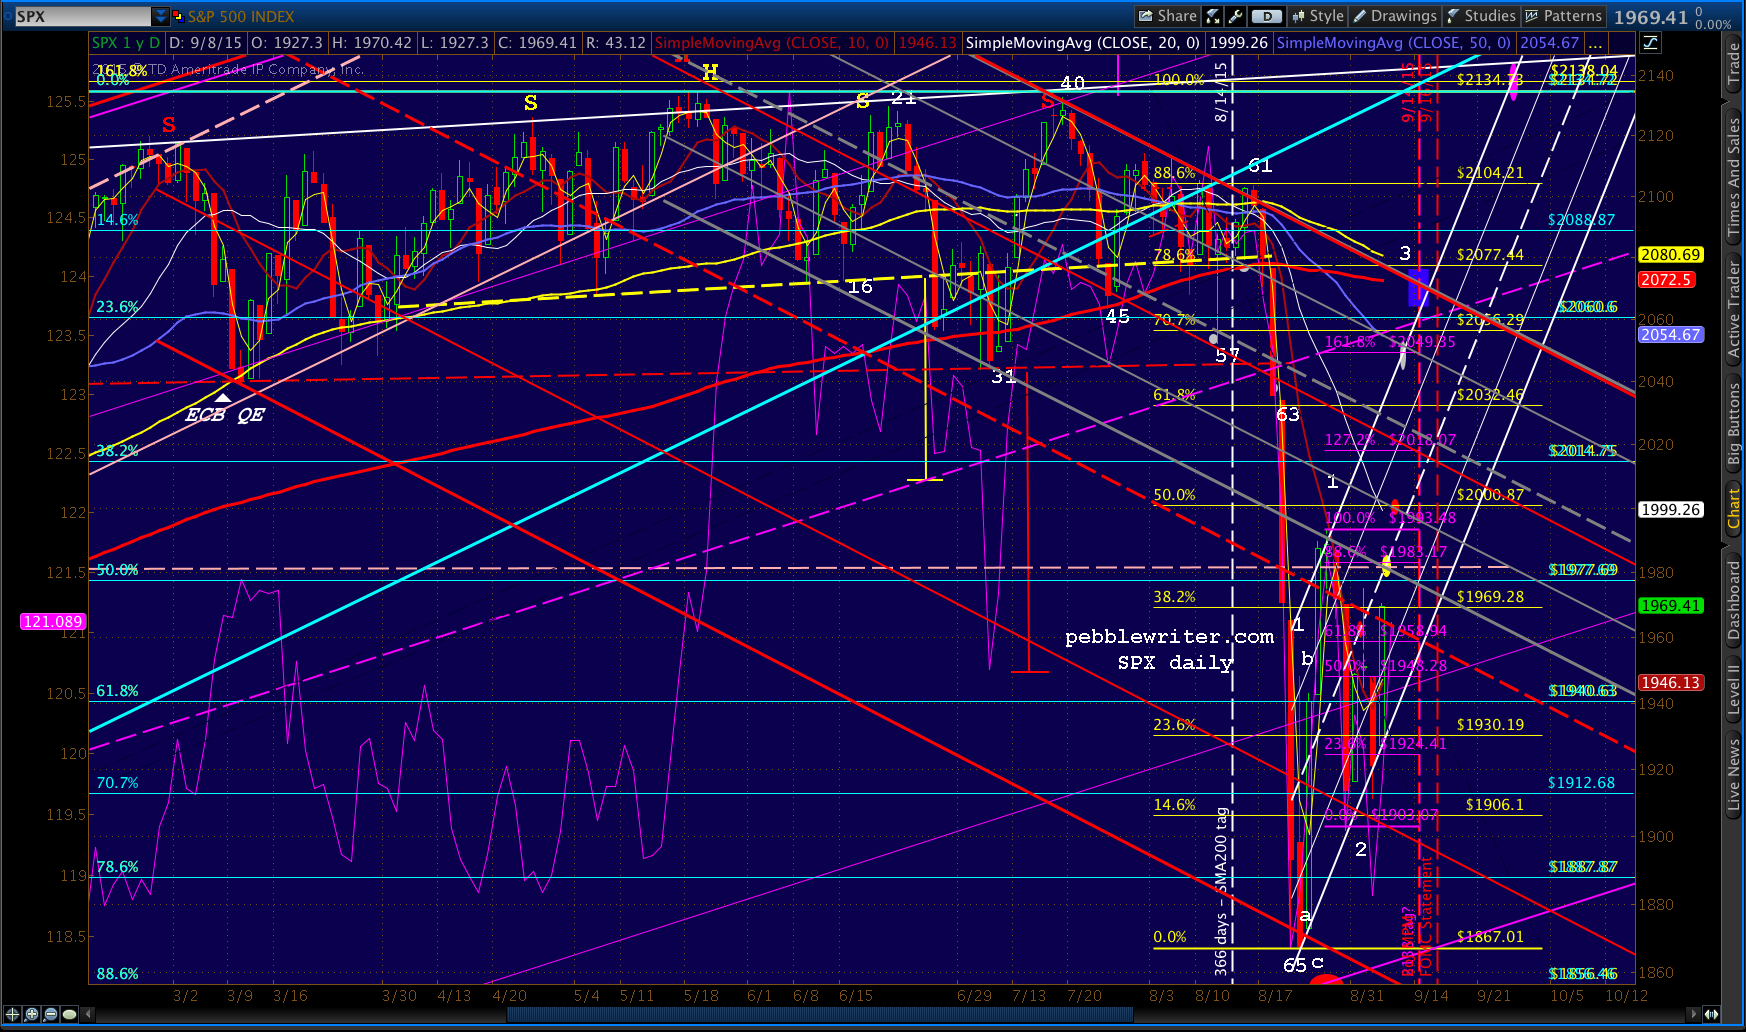 Should 1983.17 be topped, the next most appealing upside target is the SMA20, currently around 1999.26. There’s a .500 Fib nearby at 2000.87, so we’ll call that the secondary target.
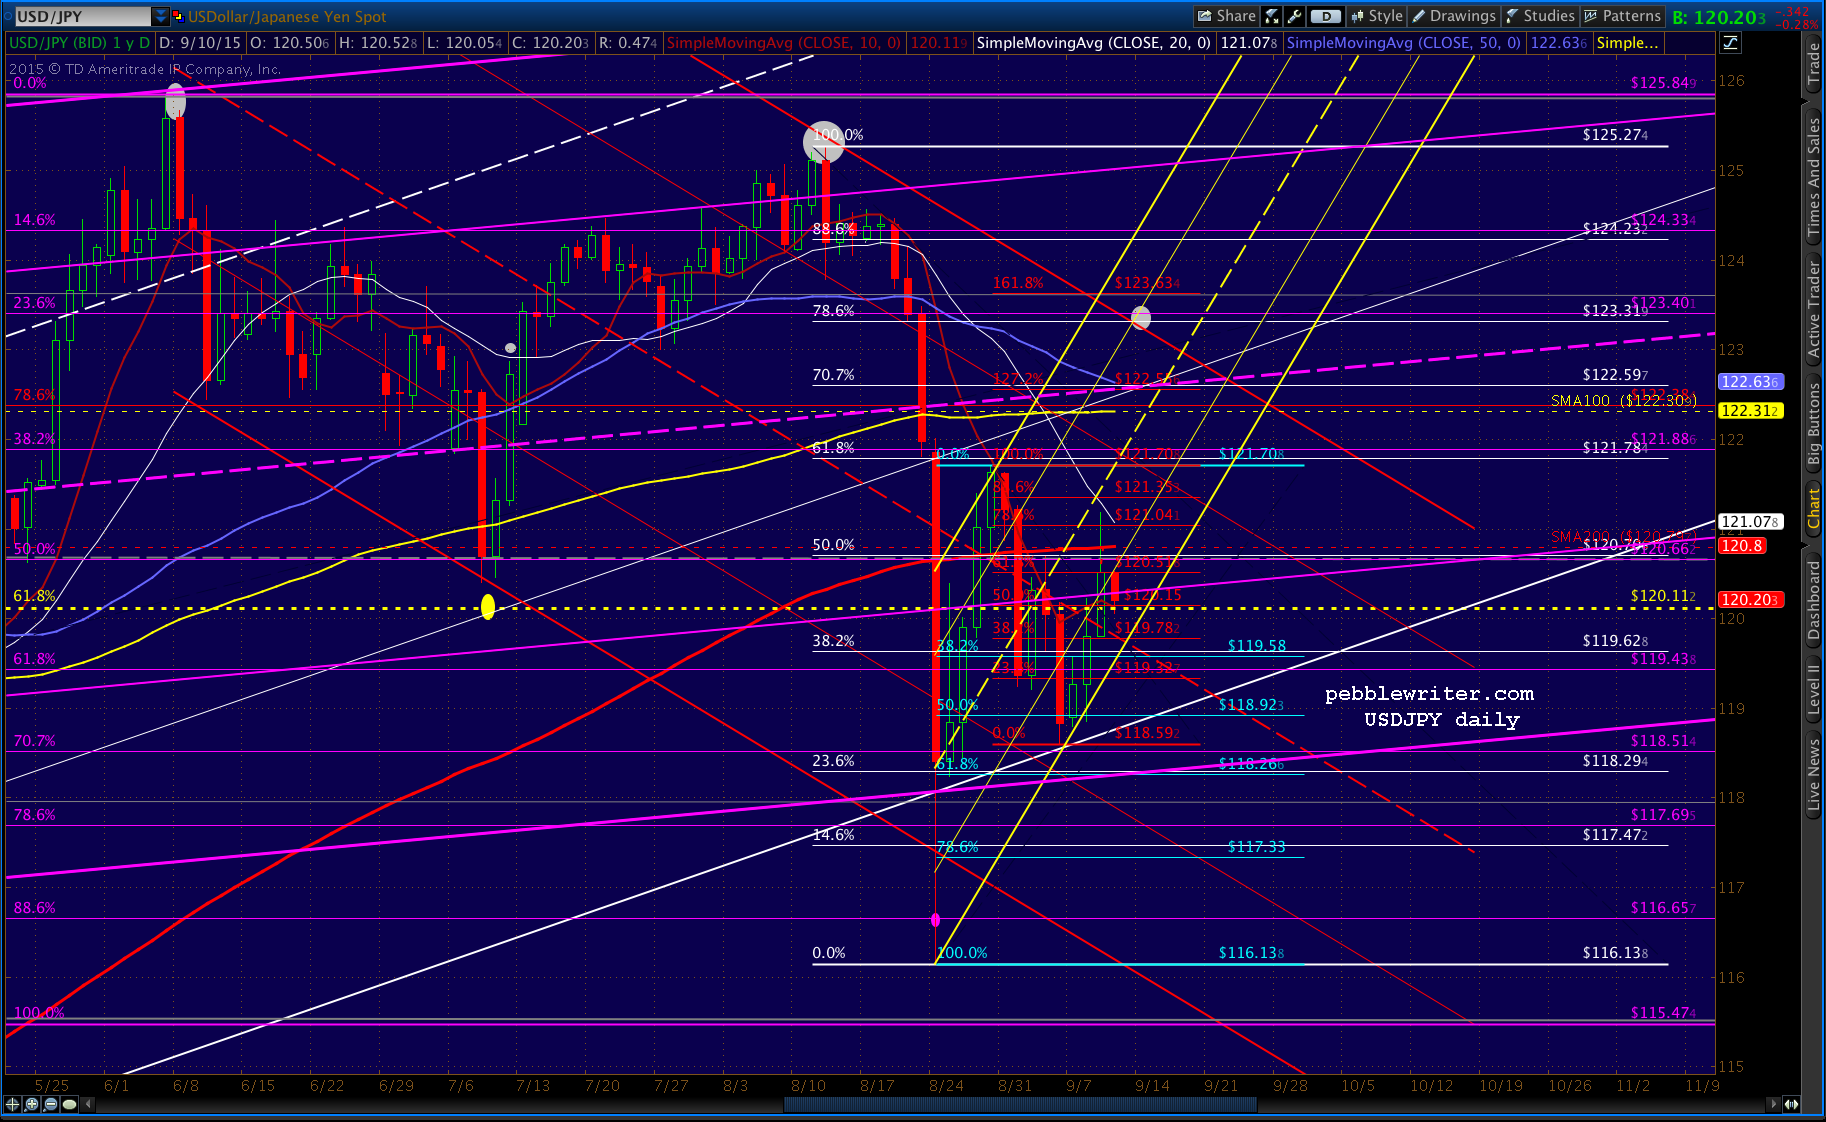
As usual, it largely depends on USDJPY, and whether or not it can/will hold the SMA200. At this point, it’s still going strong. It has retraced .786 and is aiming for .886 of the drop from 121.708 on Aug 29. Several charts follow:
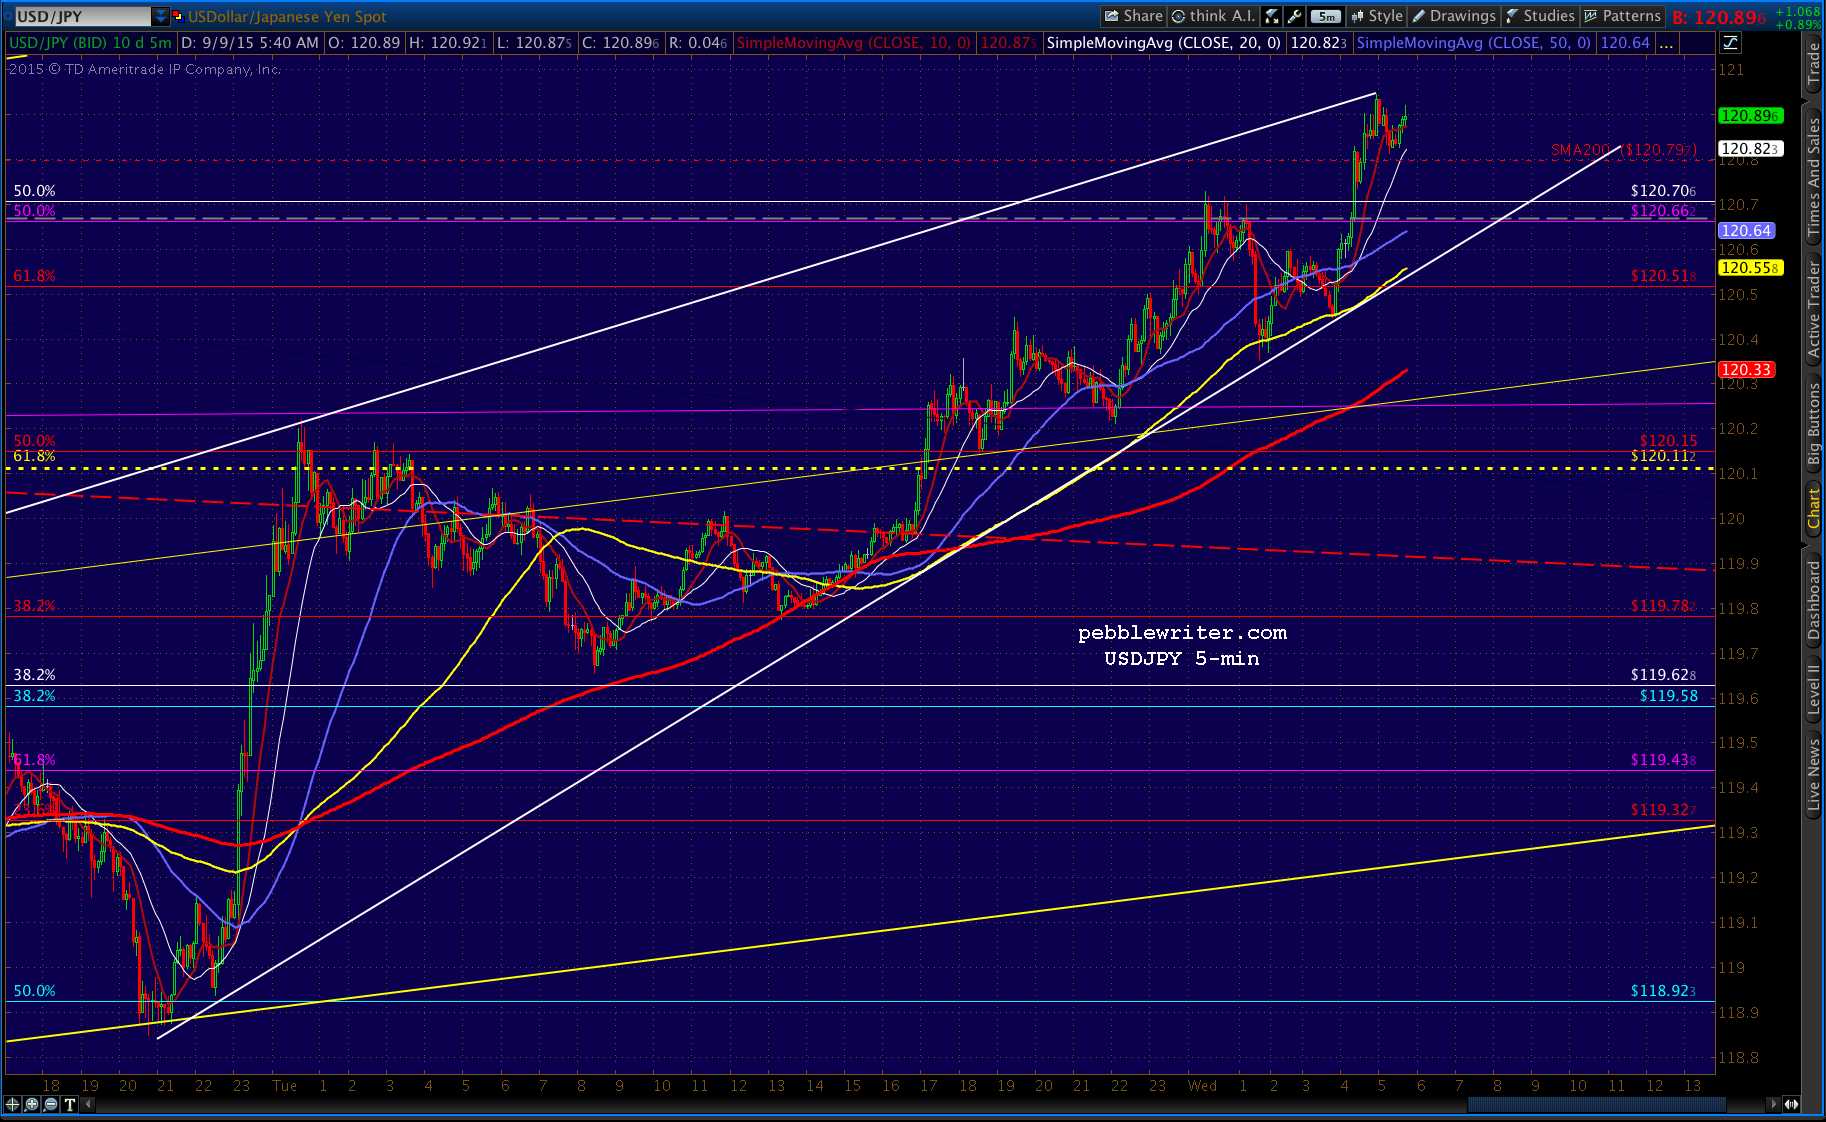
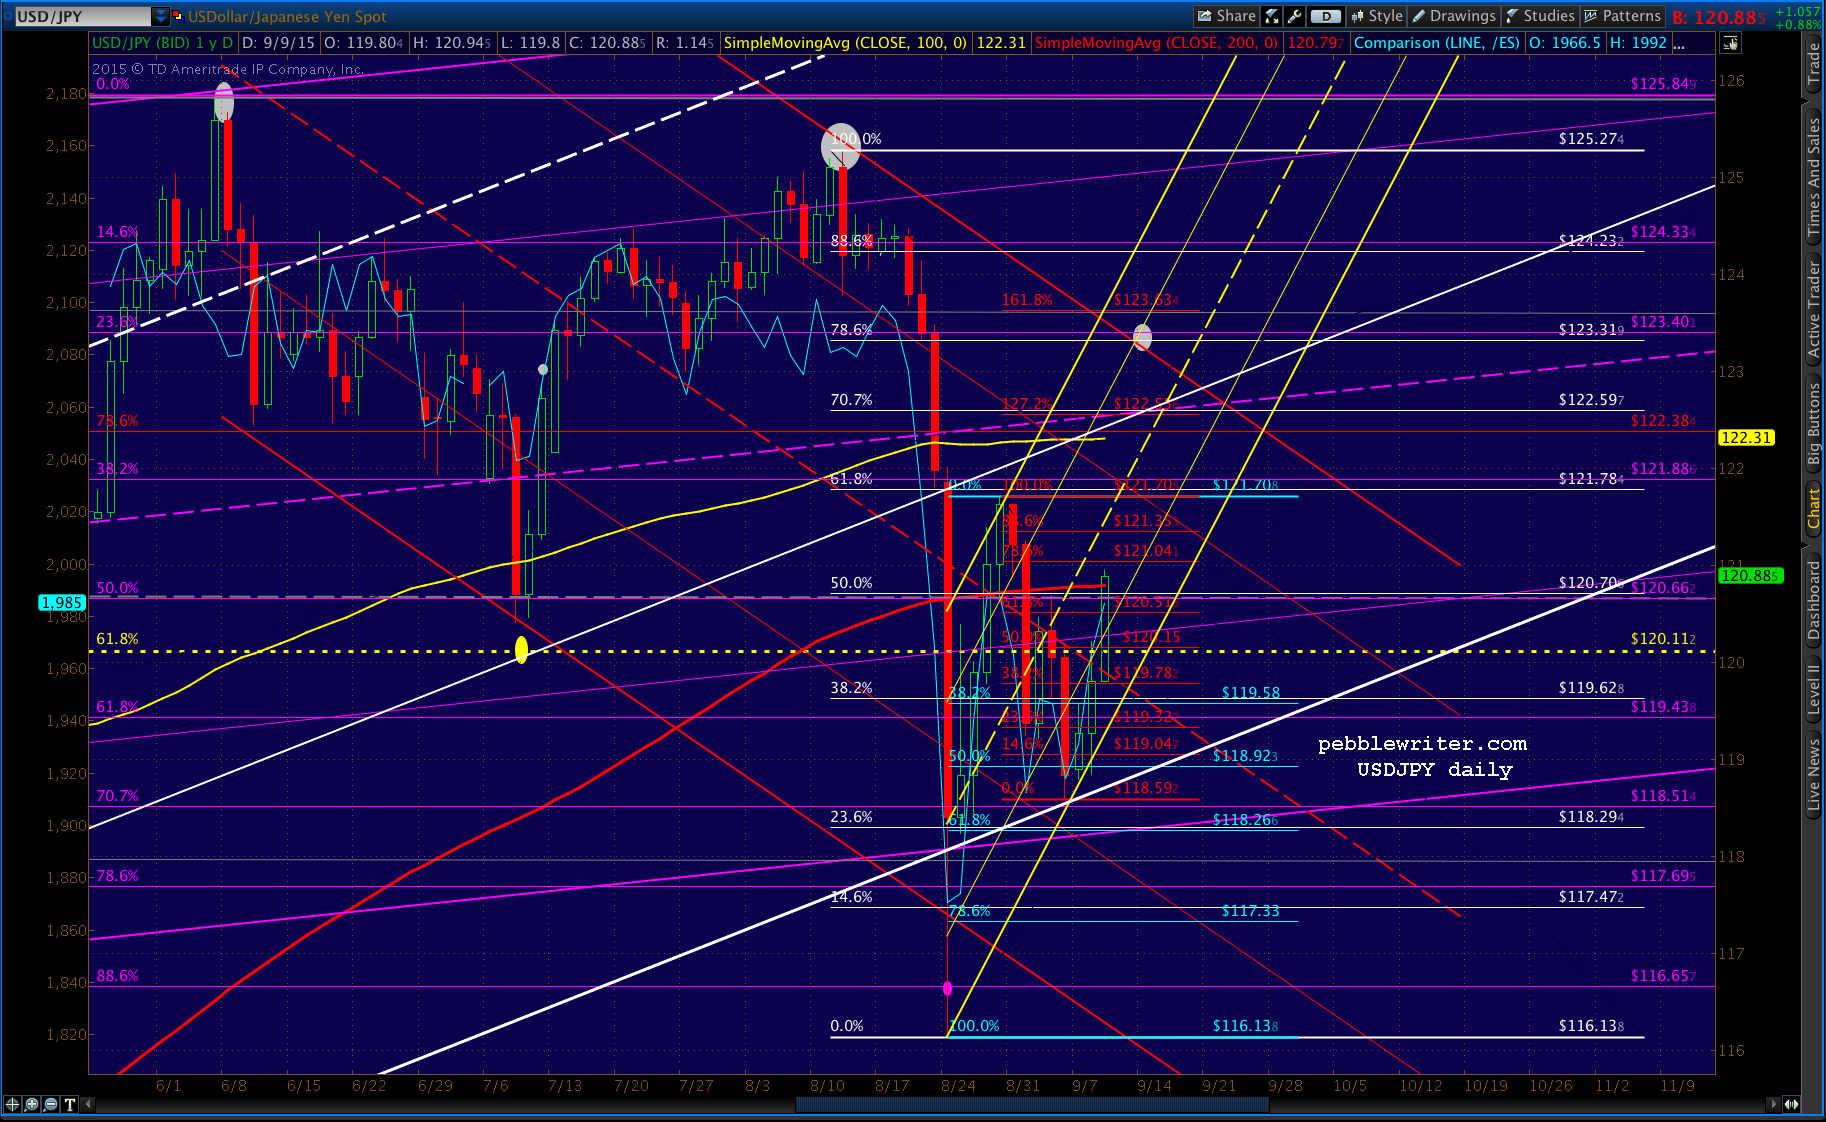
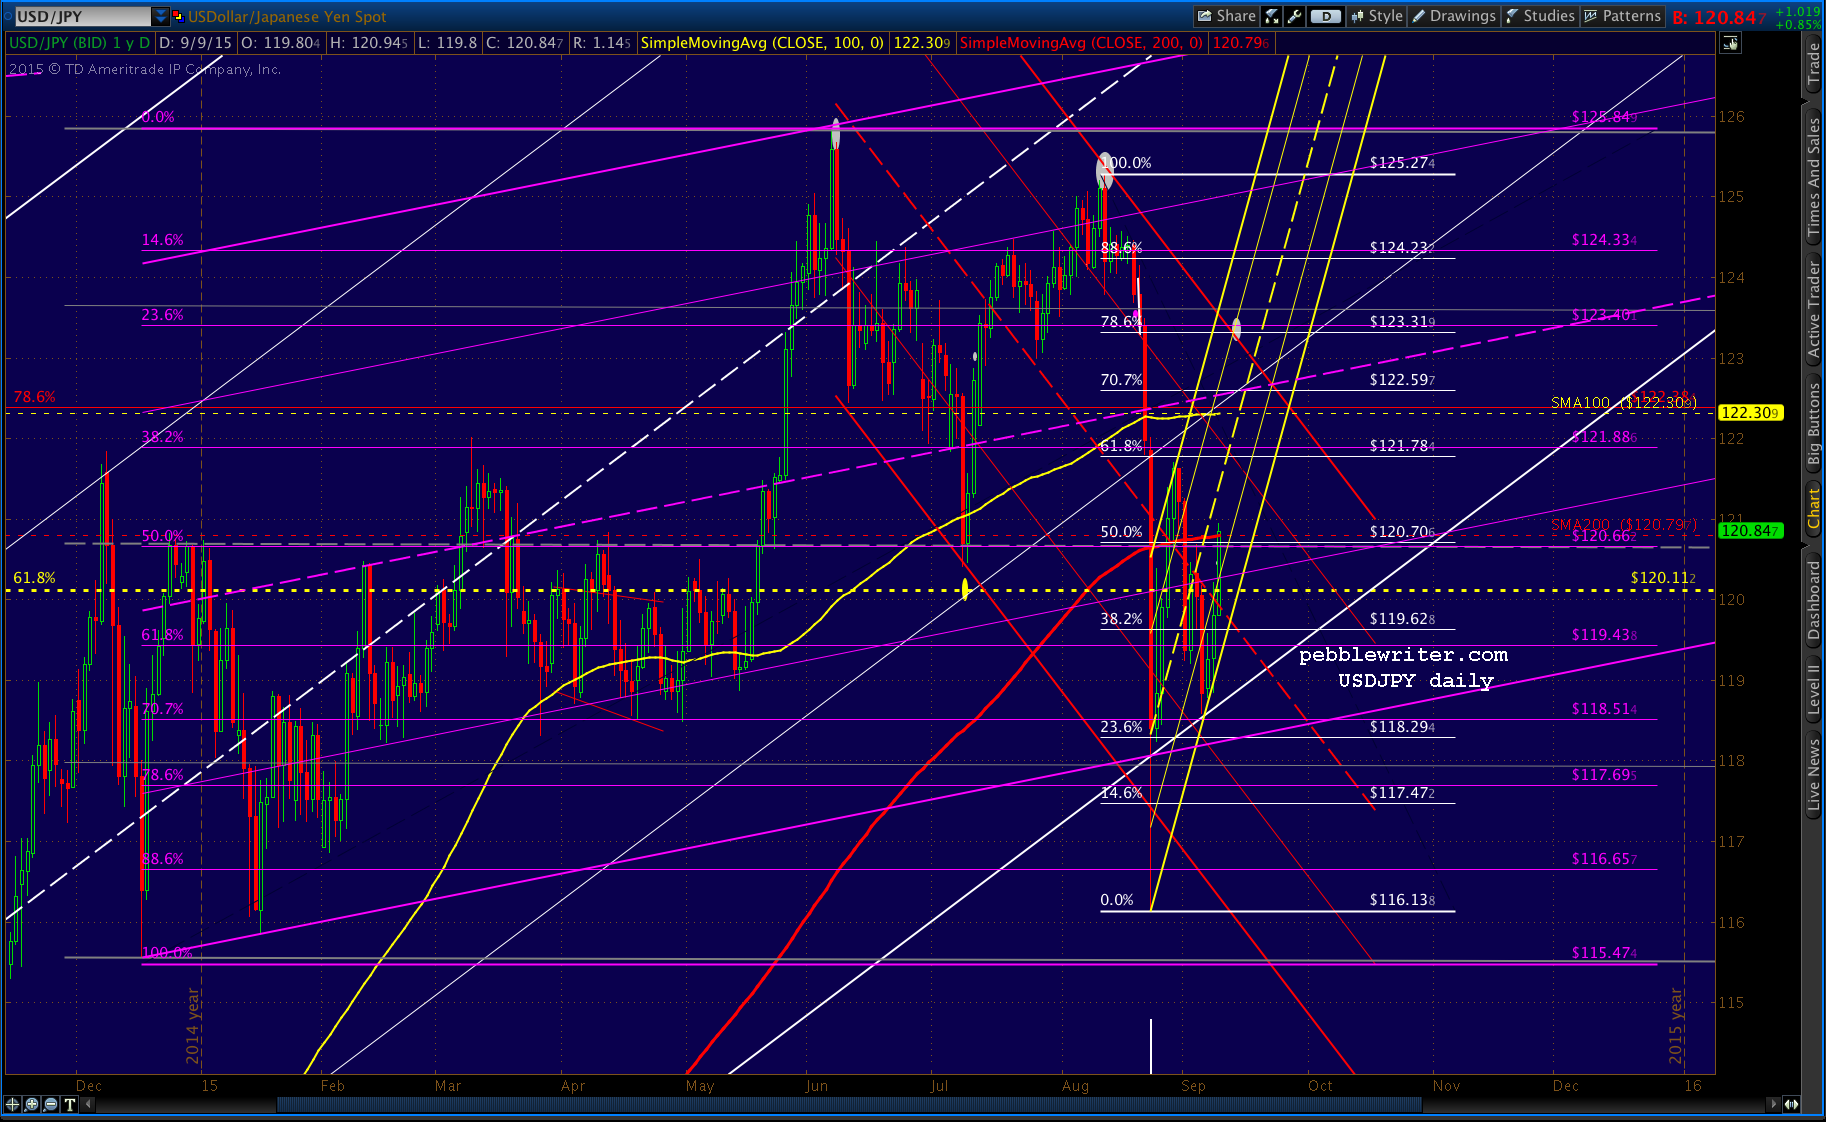 The steep rising yellow channel won’t hold of course. But, it should hold long enough to get SPX where it’s going.
UPDATE: 9:35 AM
The initial push has taken SPX beyond 1983.17, but — like ES — stopped short of the Aug 28 high. We should get a pullback to at least backtest the gray channel bottom/.886 somewhere in here, but TPTB should defend 1980 pretty strenuously.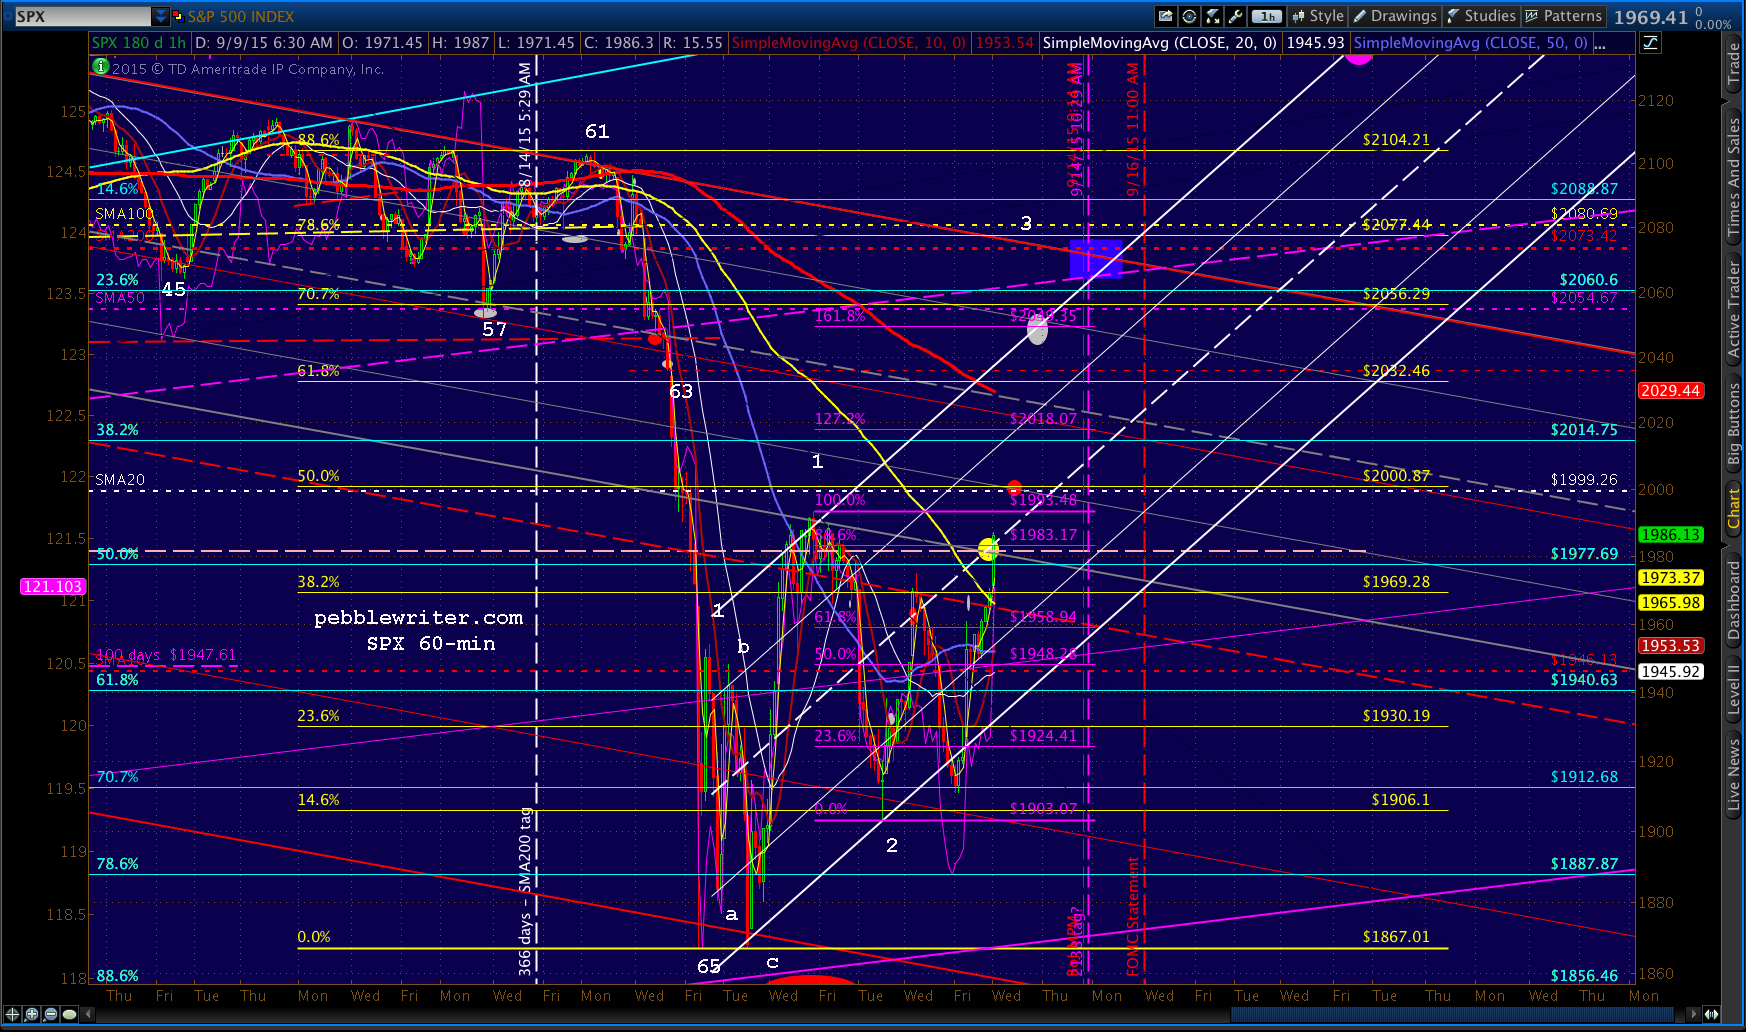 UPDATE: 9:49 AM
That’s a pretty good backtest of the gray channel bottom here at 1980.91. I’d be comfortable going long again at these levels with tight stops. If it slips further, the next support is the .786 at 1974.13, followed by the yellow .382 at 1969.28.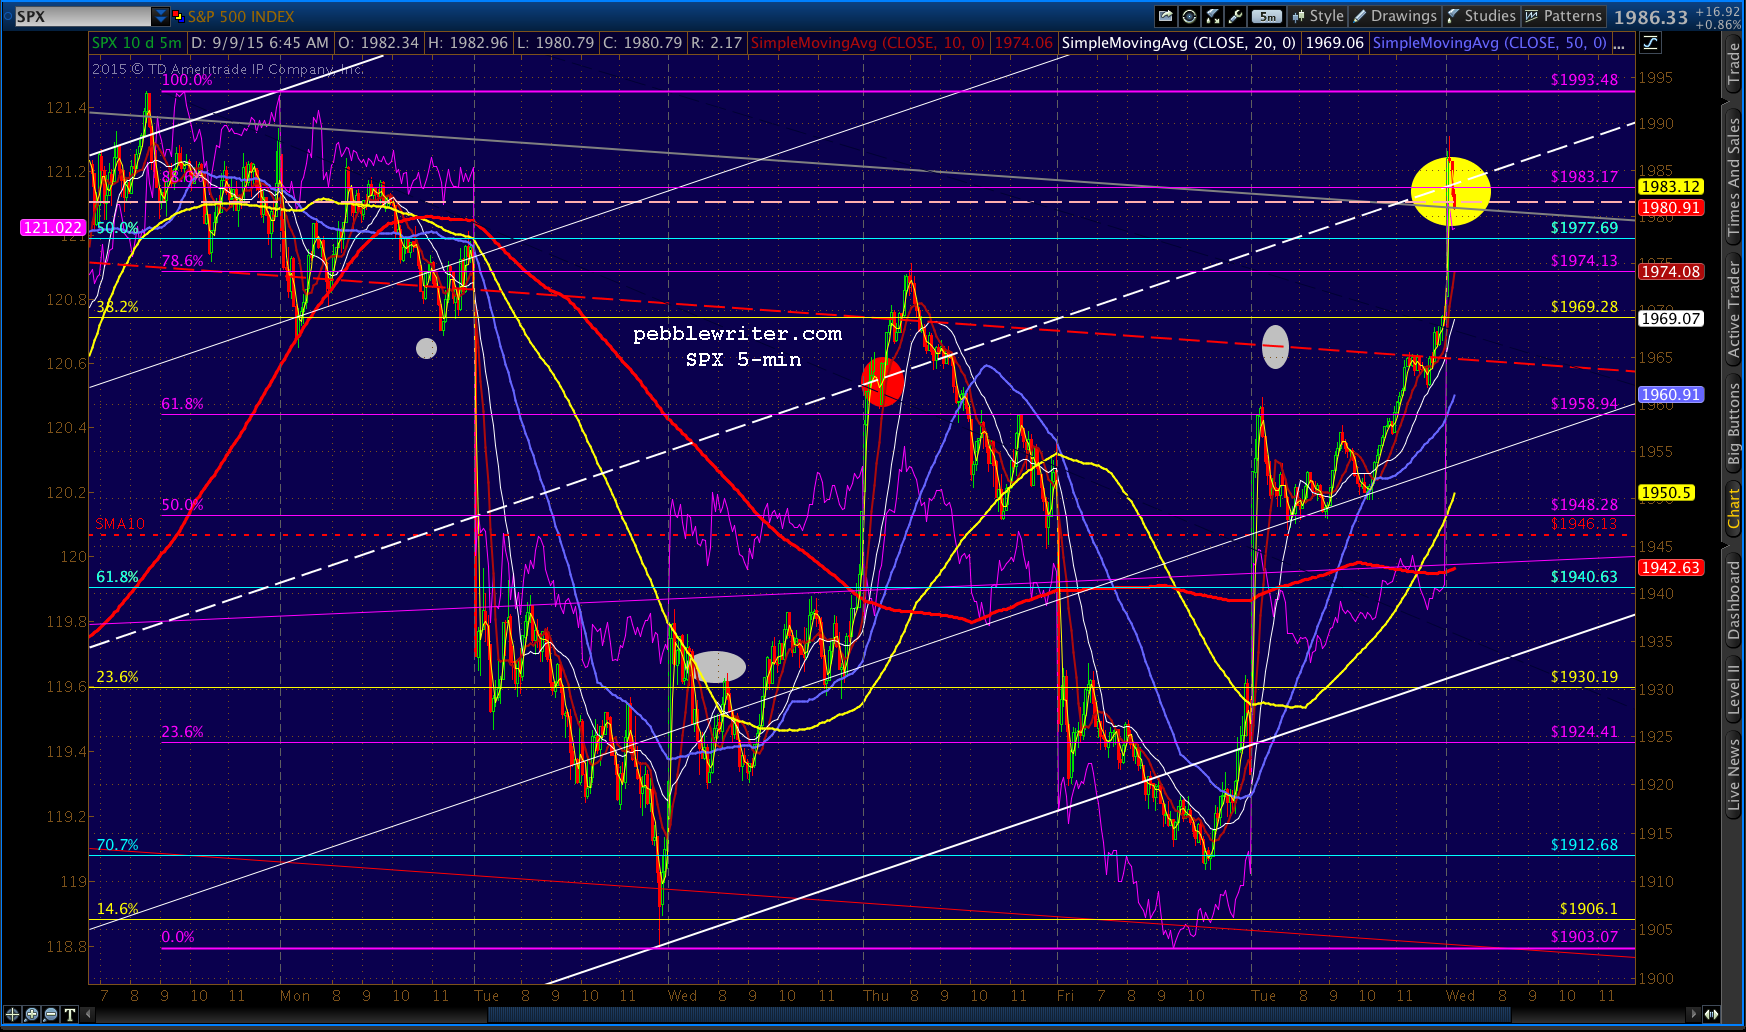 UPDATE: 10:05 AM
SPX slipping below the gray channel bottom, next stop should be 1974.13, then 1969.28 and finally, the red channel midline around 1965ish. At some point, USDJPY should backtest the SMA200, which should be when SPX stops sliding. 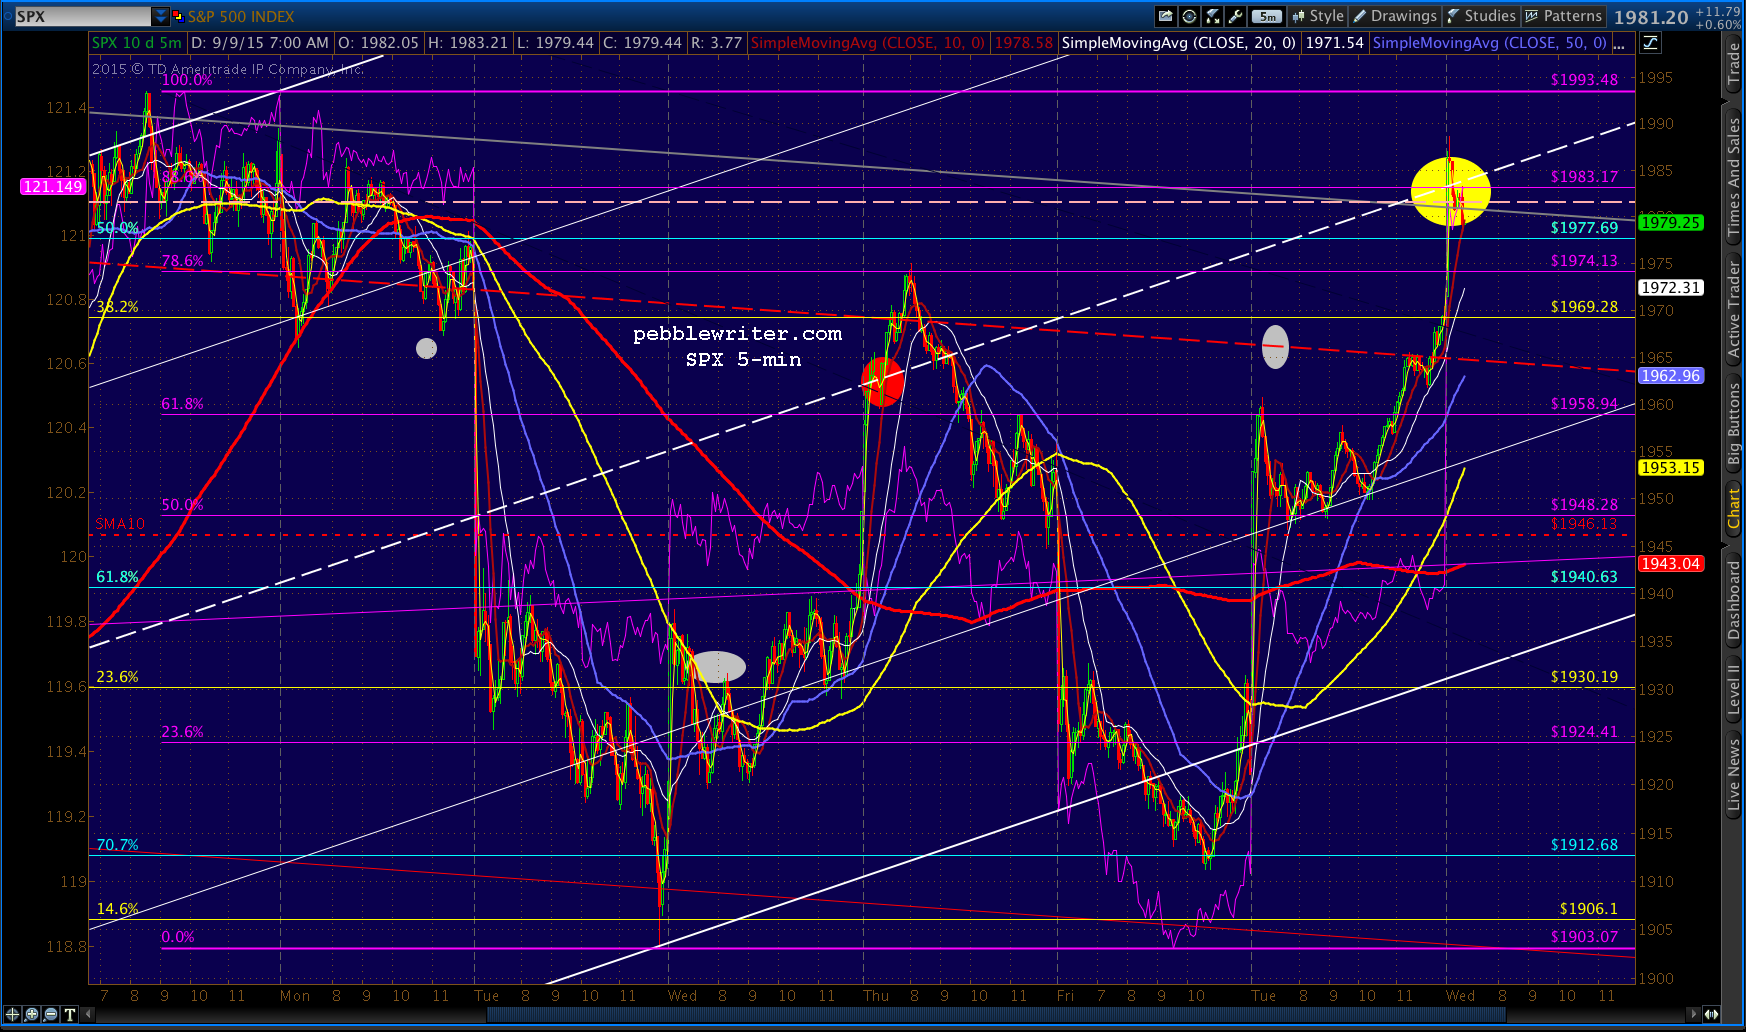 UPDATE: 11:00 AM
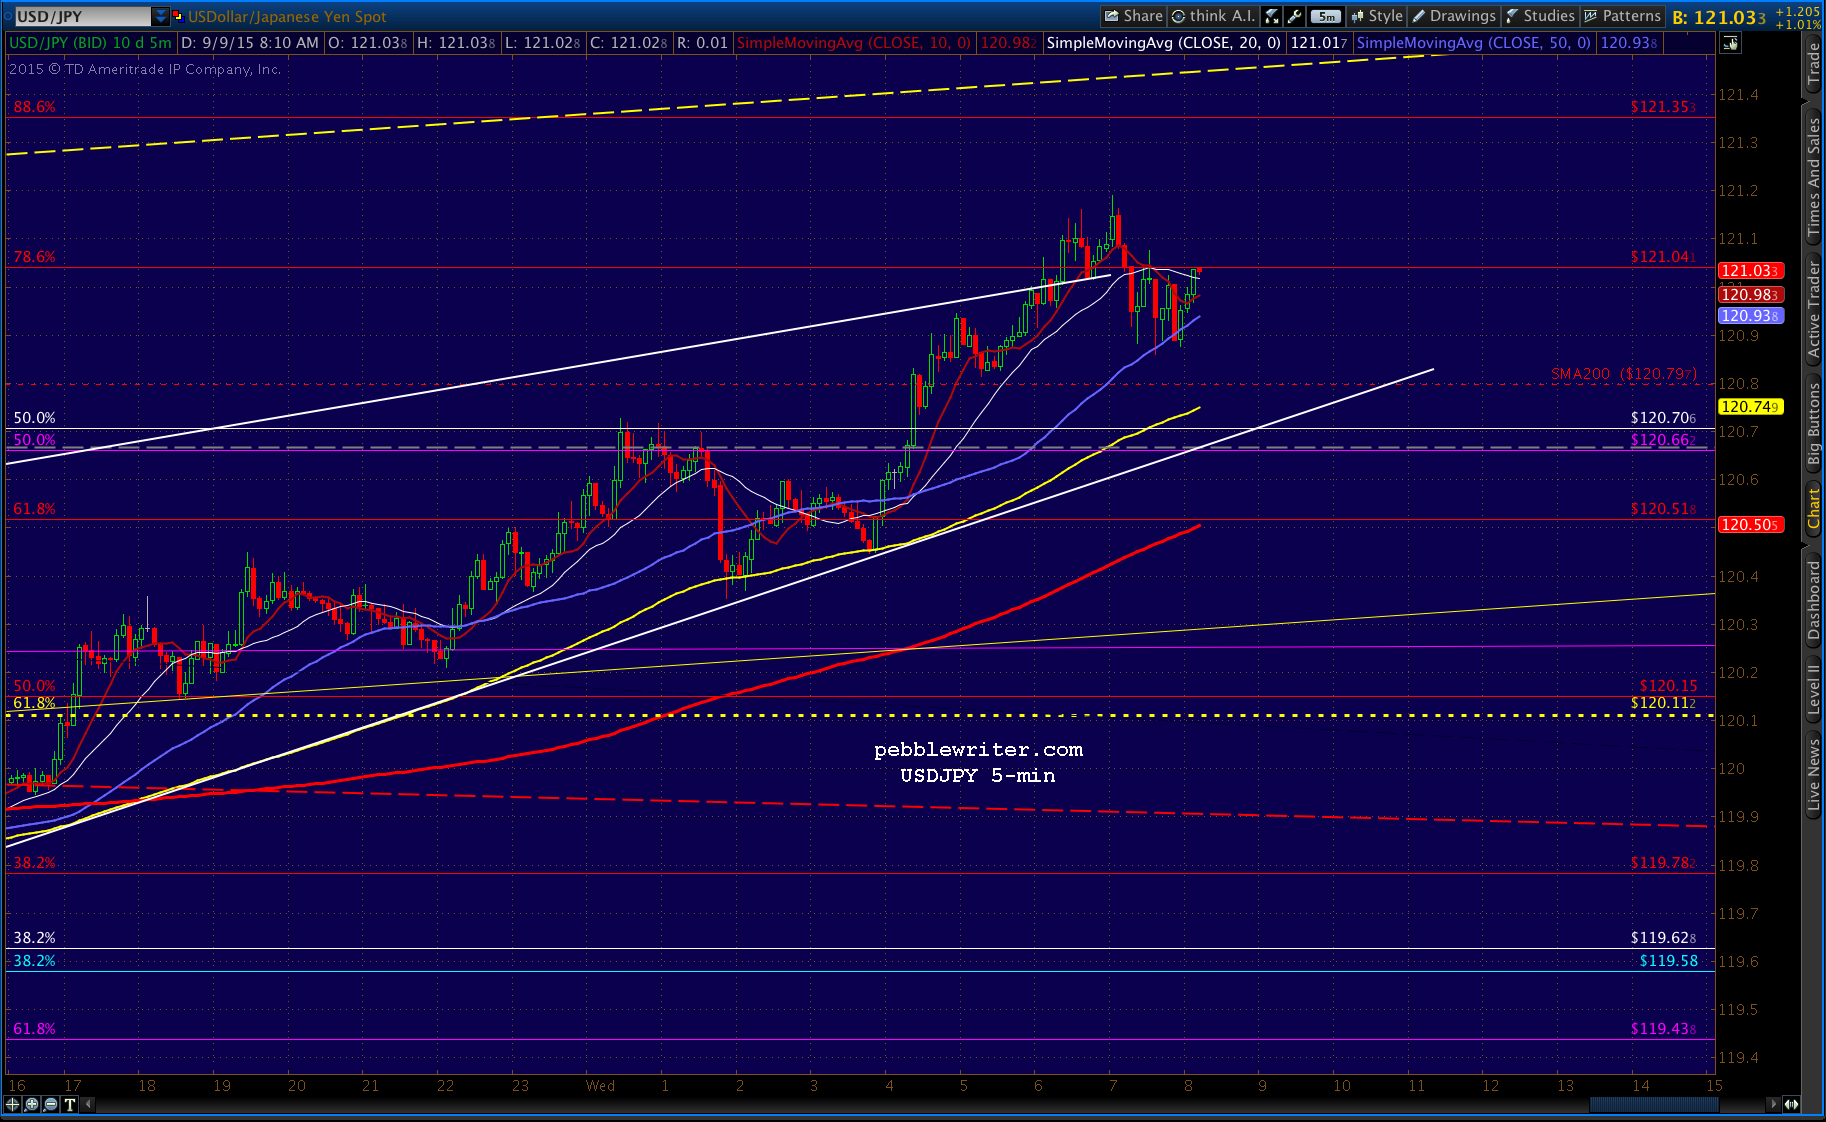
SPX has reached the .382 at 1969.28. Should see that bounce here, though stops are still in order in case the red midline is the ultimate objective. 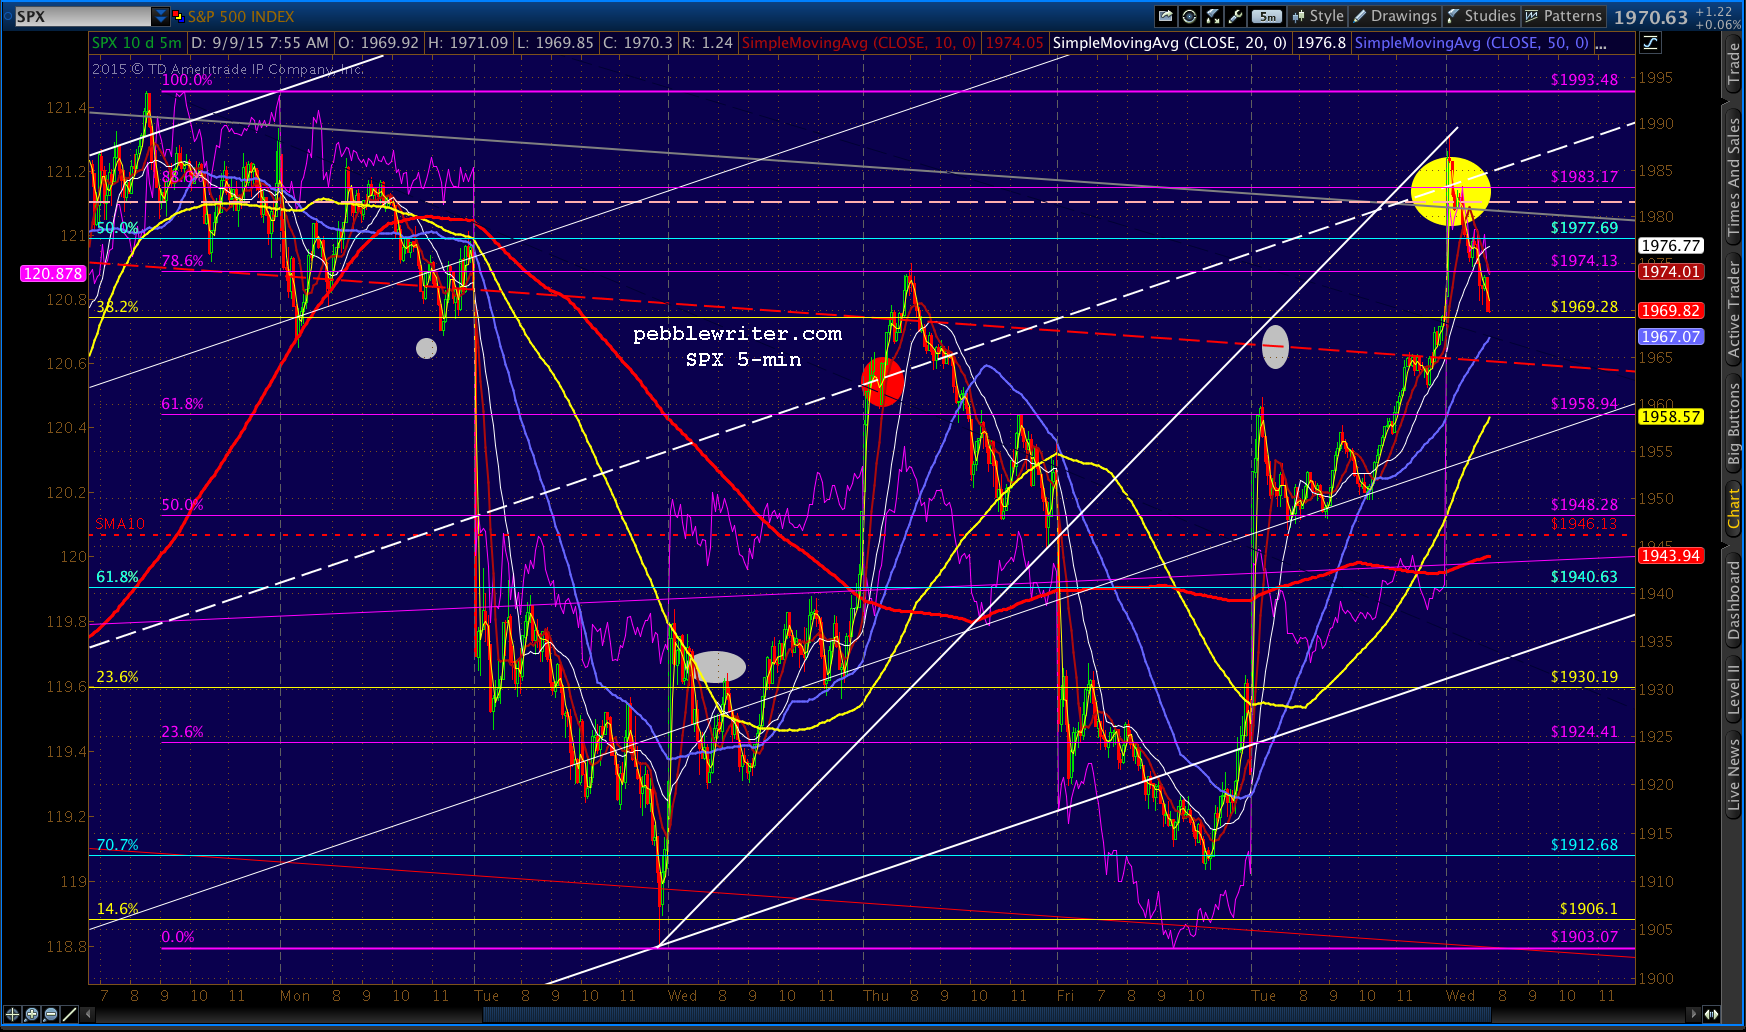 USDJPY still hasn’t backtested the SMA200, but my guess is that it won’t until the SMA100 or 200 (5-min) catches up with the daily SMA200 — which could be hours from now.
 UPDATE: 11:45 AM
SPX just pushed through and backtested the .382 at 1969.28. If this support doesn’t hold, then the red midline at 1965 is up next, followed by the purple .618 at 1958.94 around 2pm.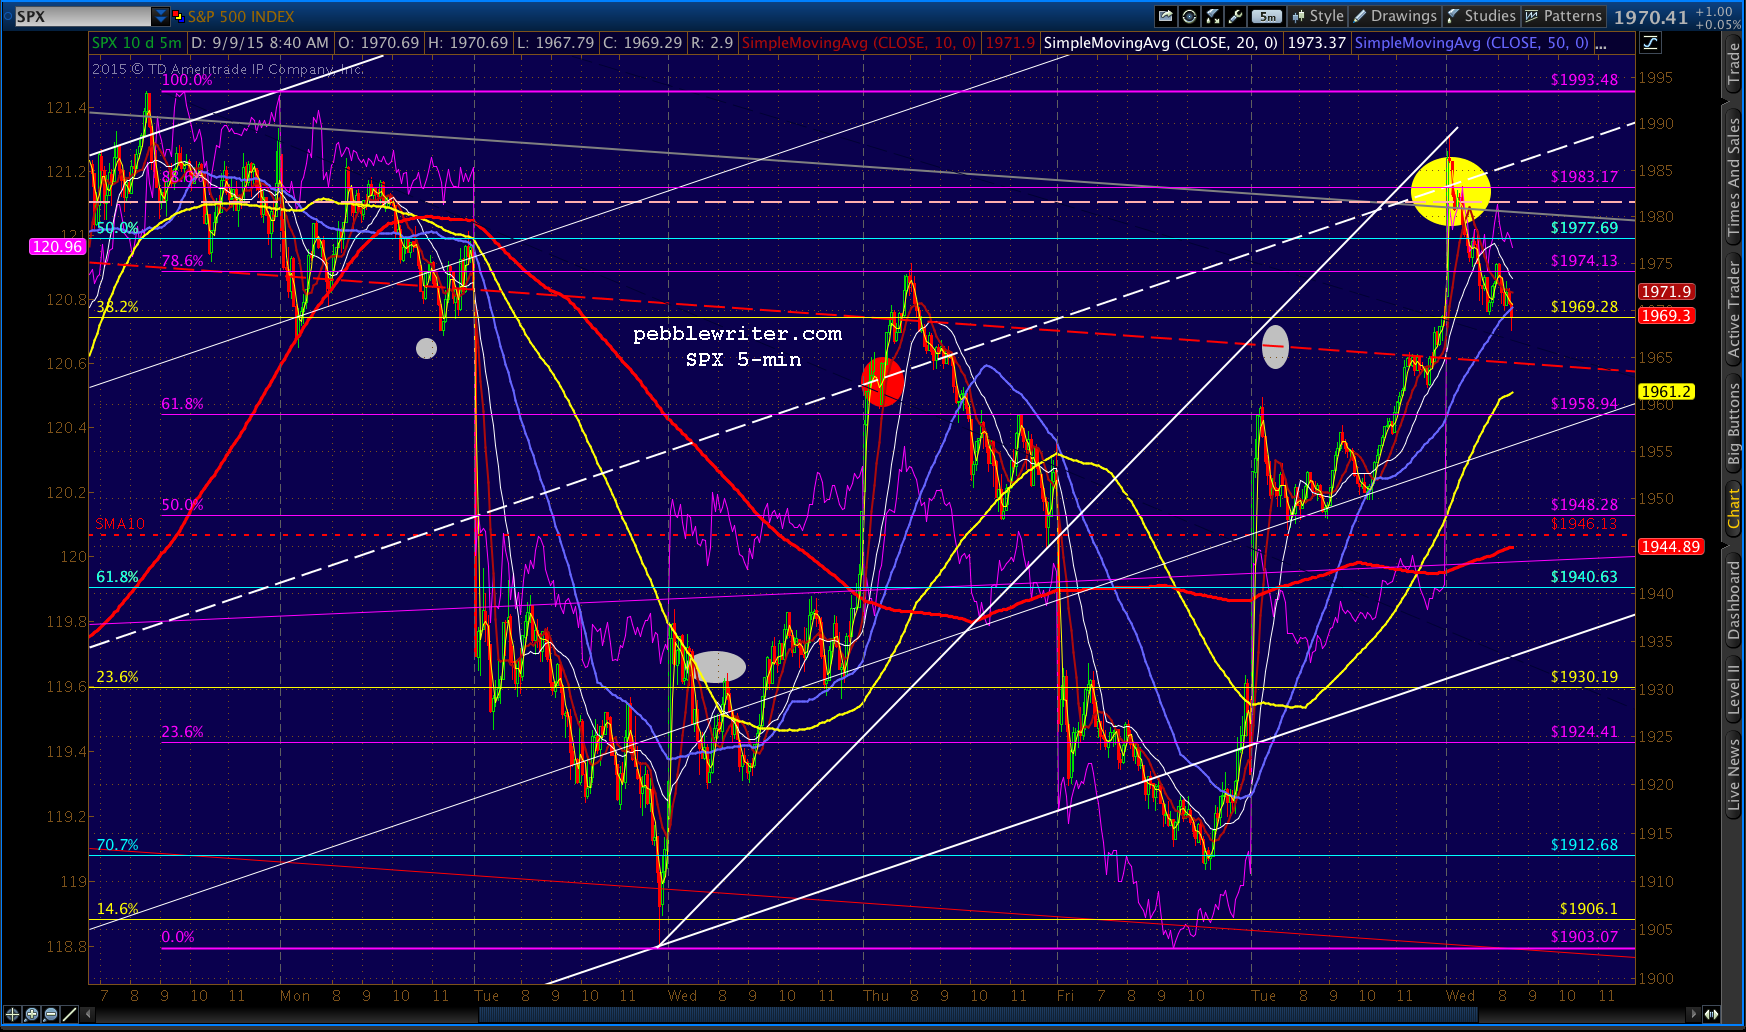 Note that previous dips below the SMA50 (5-min) have held, so I’d not get too worried about this one. Yet, USDJPY’s SMA200 has still not been backtested. Could have done it a couple of hours ago with little impact; now, it might have to wait until the end of the day. The bottom of the rising wedge crosses the SMA200 around 13:45 ET, though the earlier option is when the 5-min SMA100 crosses 120.79.
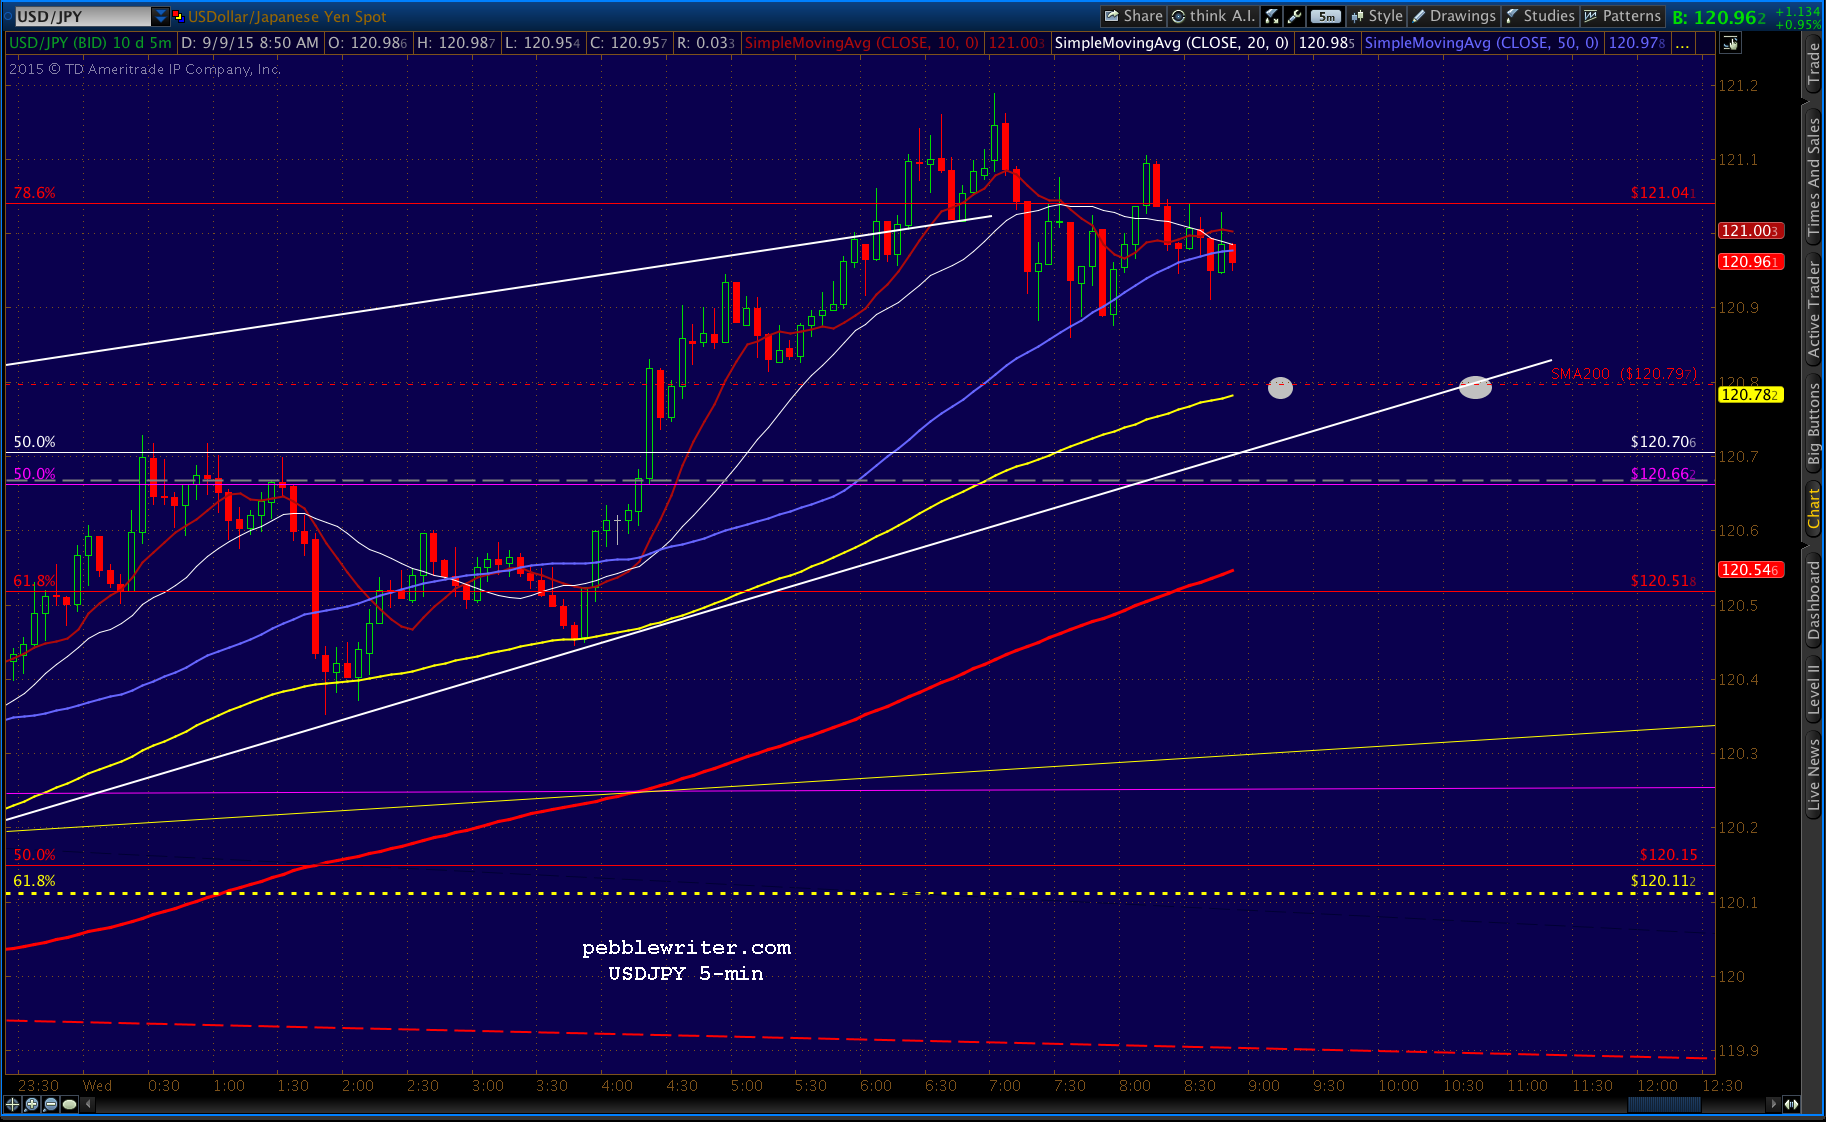 UPDATE: 12:37 PM
SPX has bounced back to the .786, staying ahead of the SMA50. 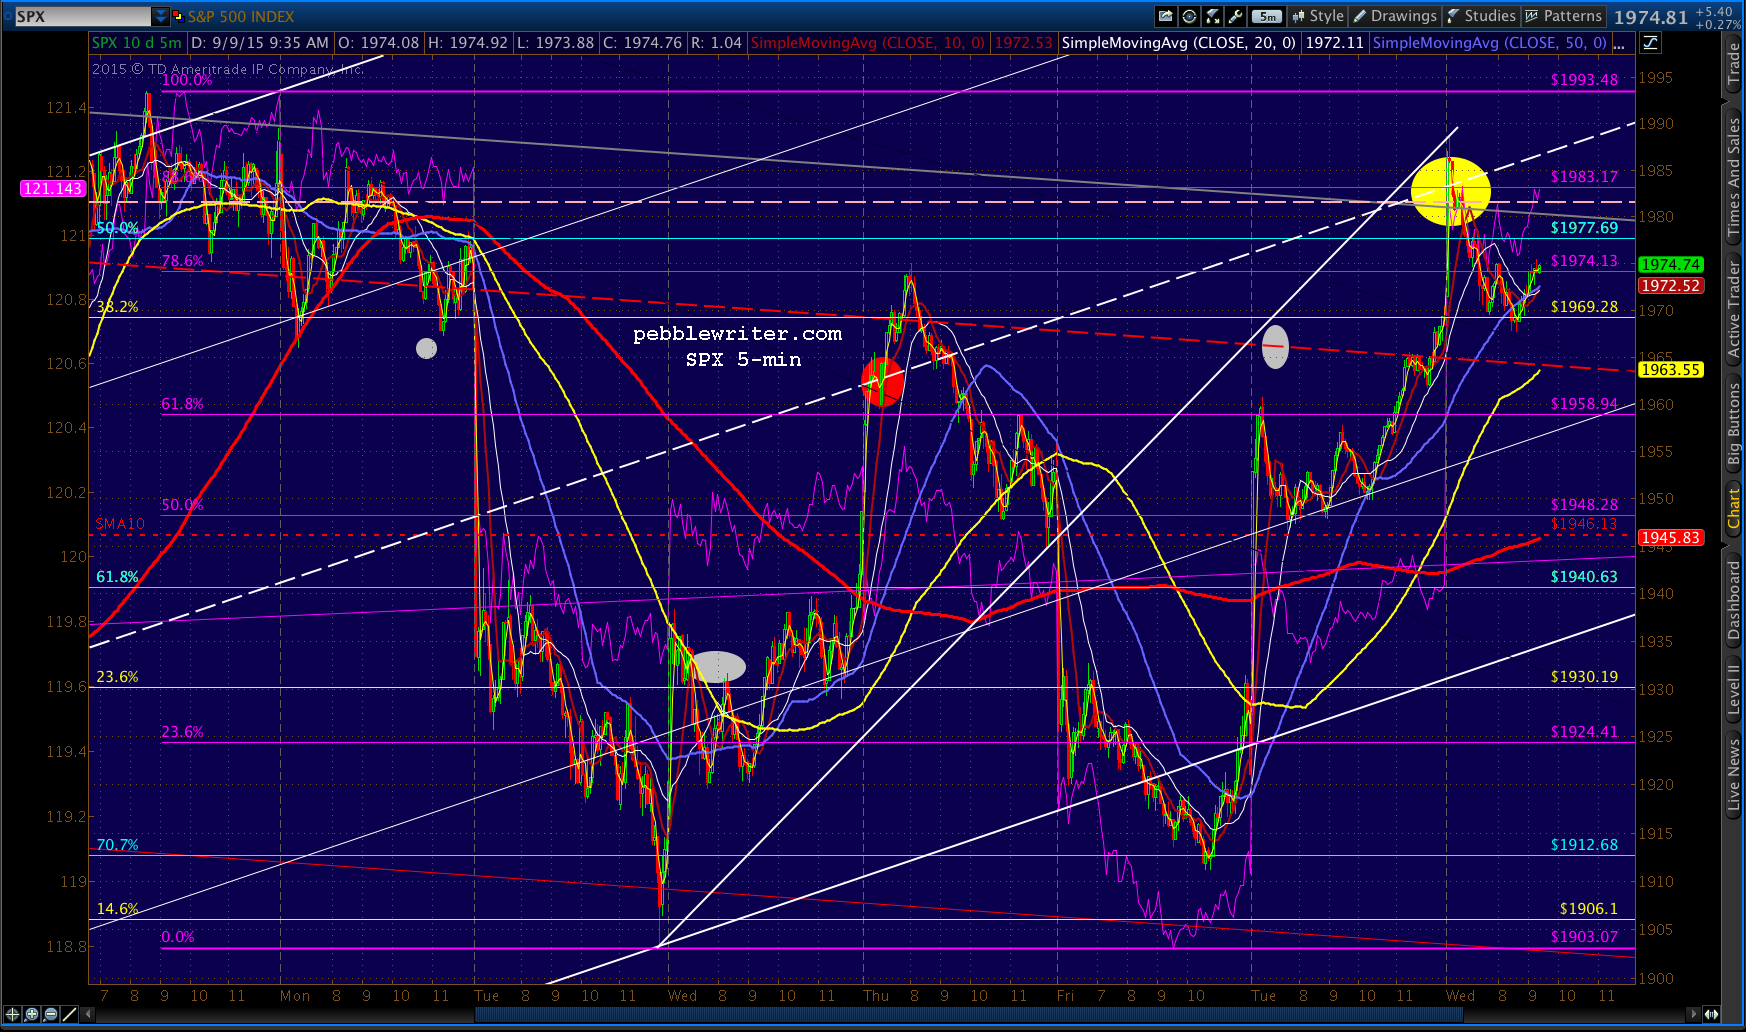 It will have trouble making any further headway unless USDJPY breaks out, which is unlikely at this point. More likely it’ll go sideways until the close, when the 5-min SMA200 reached the daily SMA200. After hours, USDJPY can crater all it wants without ES necessarily following along.
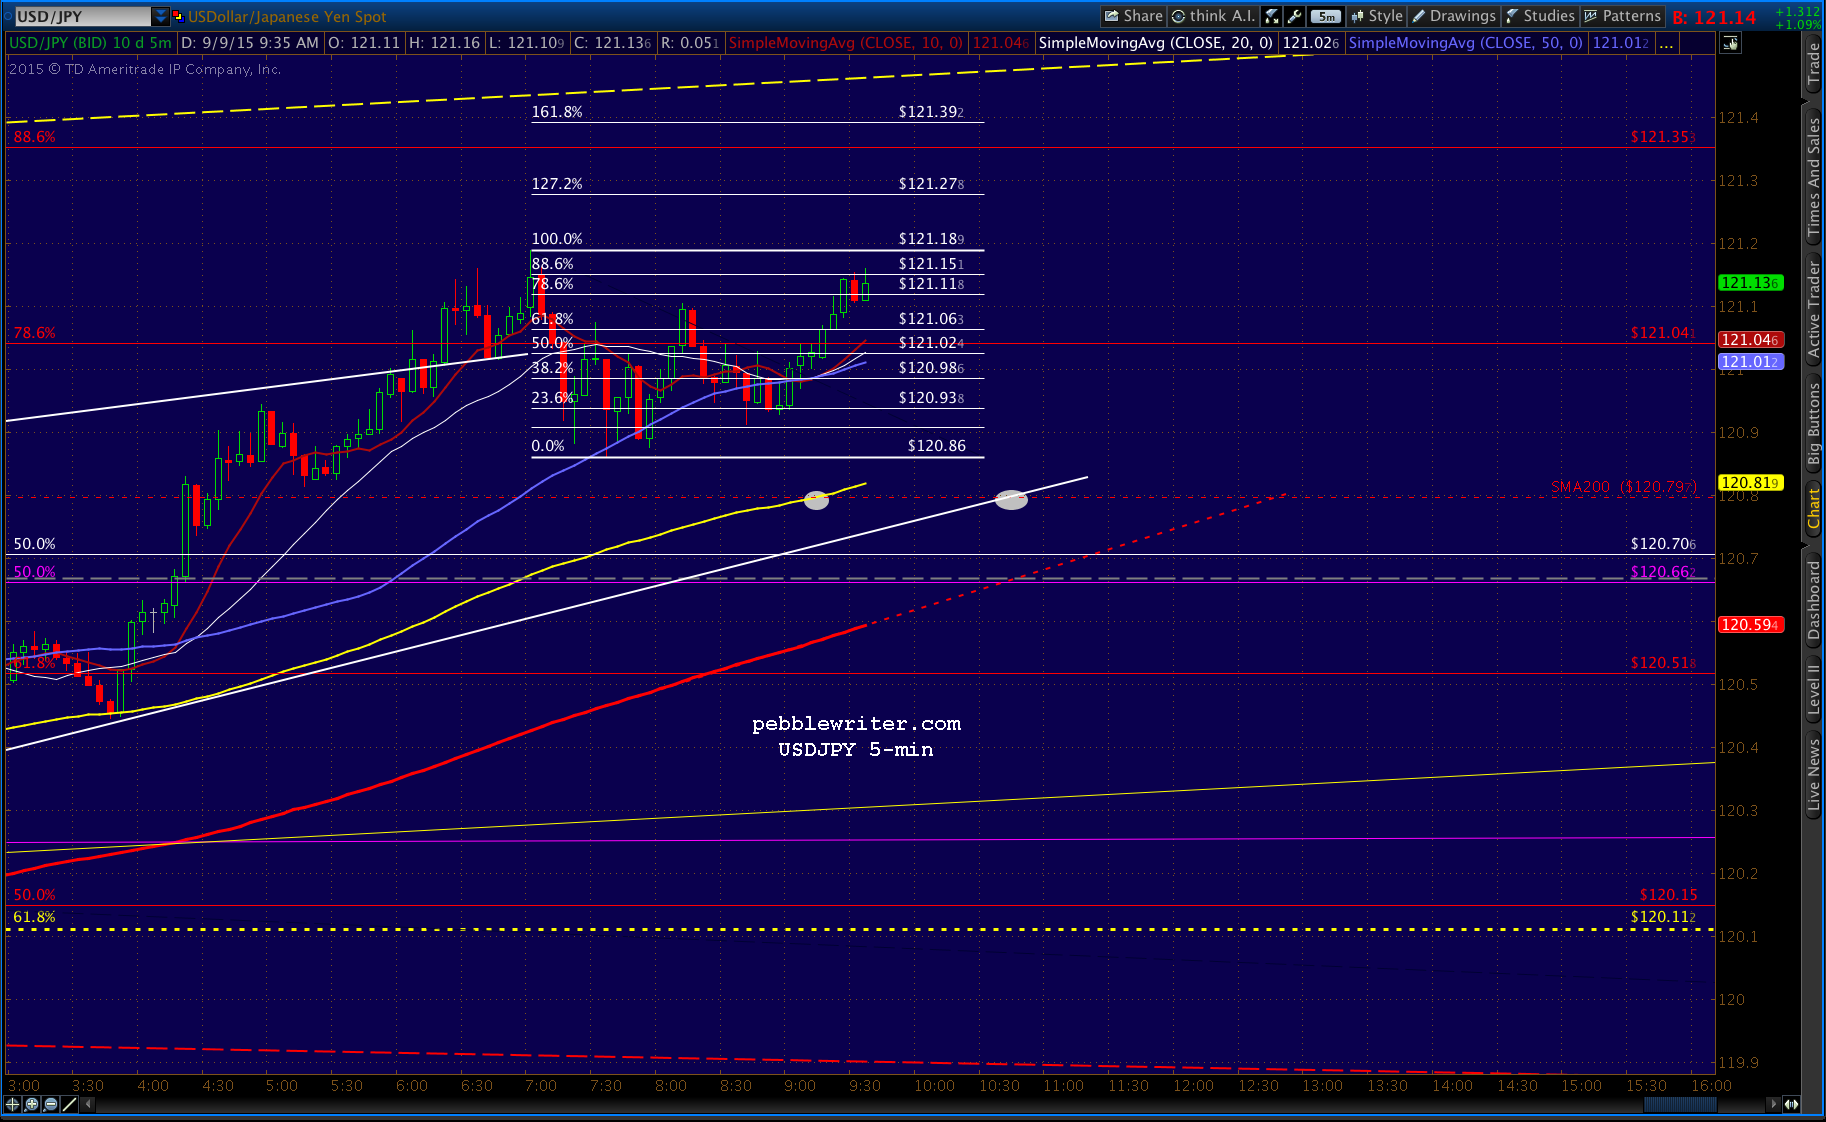 Bottom line, don’t expect more upside today. And, depending on how artfully the SMA200 backtest is executed, we could easily see more of a sell-off from here.
I’d be inclined to take profits here or, for nimble traders, consider shorting and see if it can’t get down to the red channel midline or that purple .618 at 1958.94.
Just know that it might not be much downside at all, and it could be limited to that .382 at 1969.28 by a sudden blip higher by USDJPY or even CL.
CL is still positioned in a rising channel and could easily return to the white midline or higher over the next few days to help the cause. The SMA200 will reach the purple .618 in another week or so, making a really nice target of 54.45.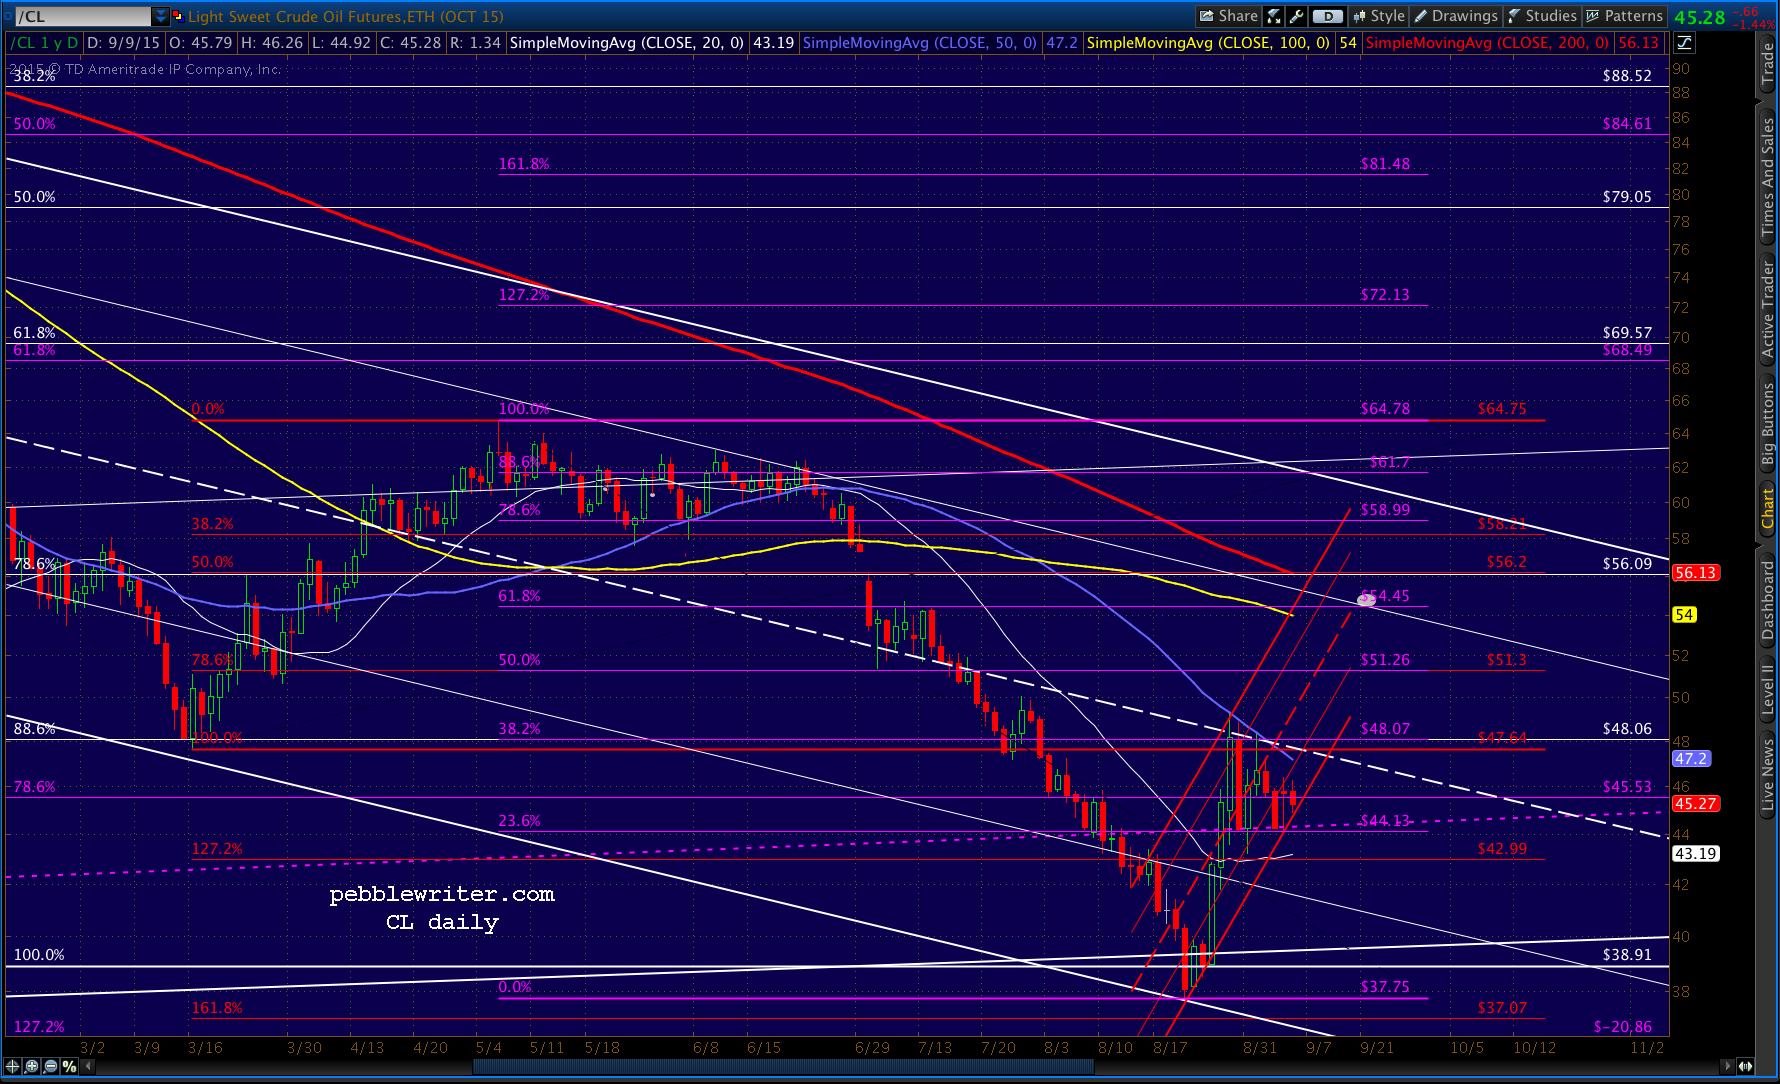 UPDATE: 1:40 PM
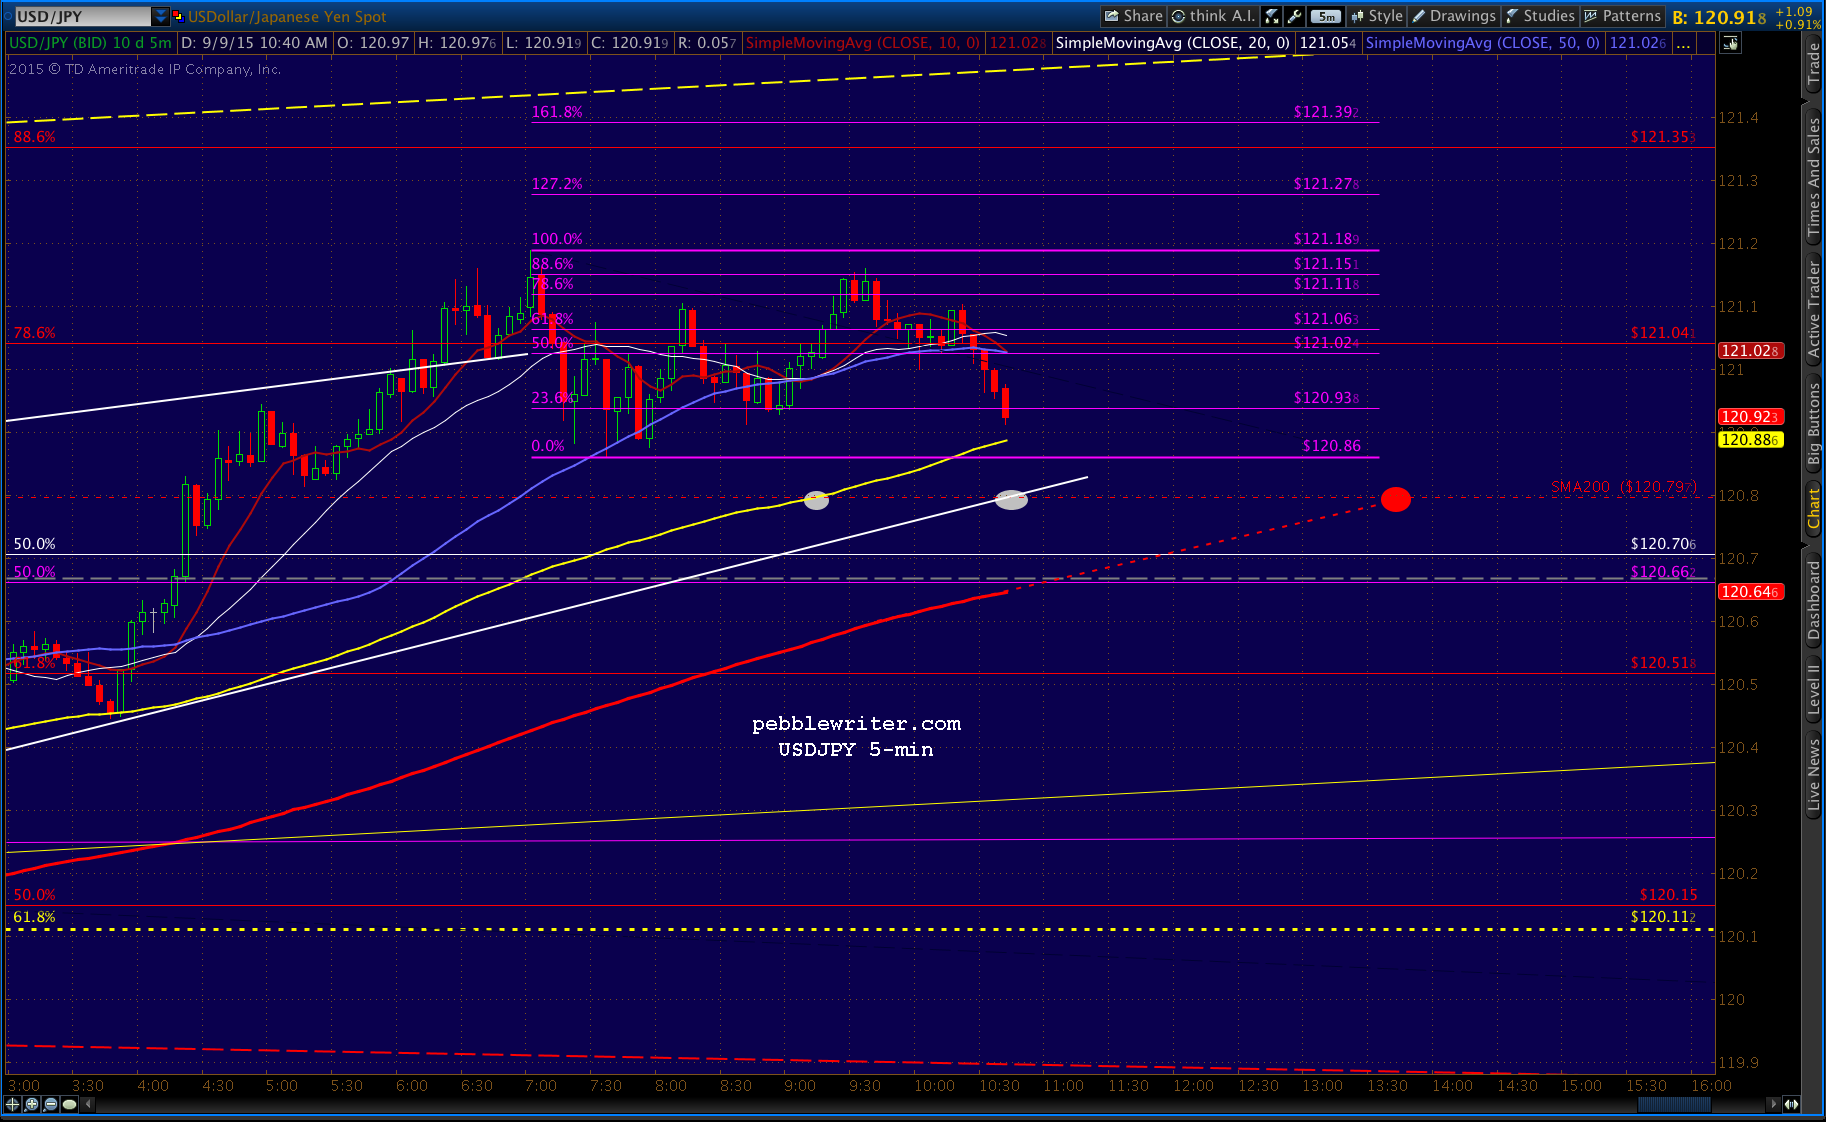
SPX has reached our next downside target of the red channel midline. It could bounce here, but 1958.94 is the better target. Though, be aware that yesterday’s initial wave higher topped at 1960.75. Wavers might consider a dip below there problematic.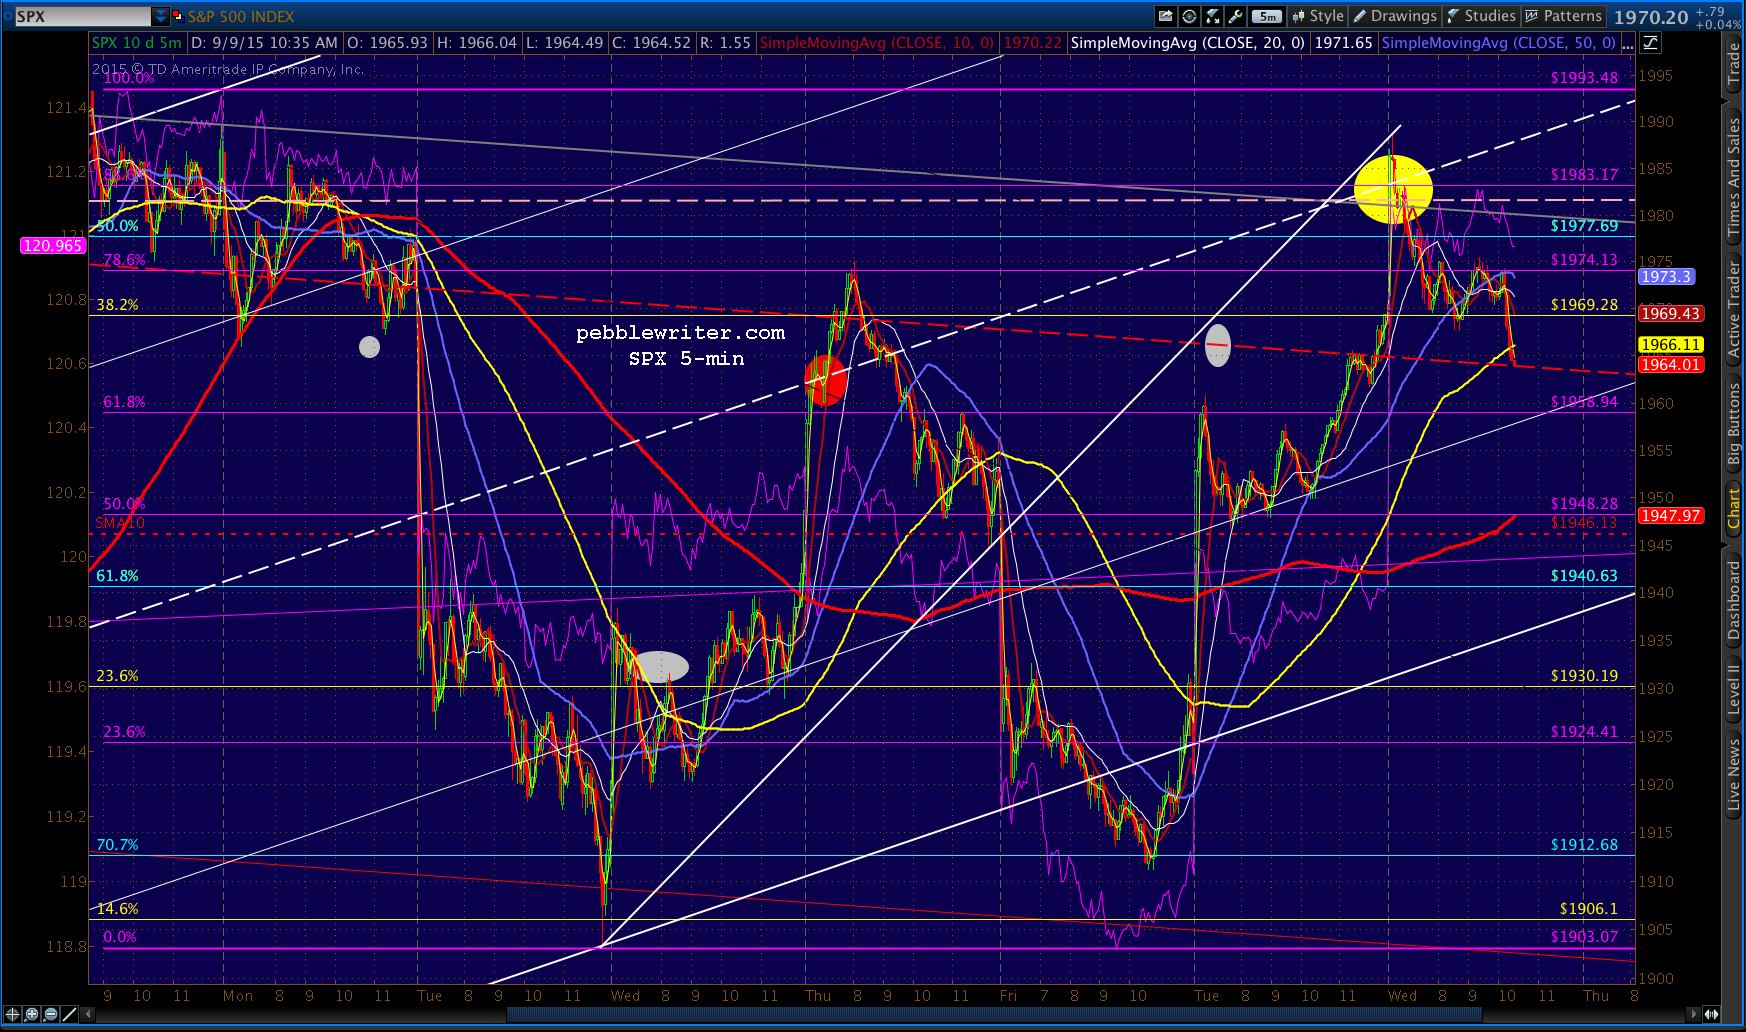 Still no backtest of any kind for USDJPY. But, it has a golden opportunity to bounce at the TL/SMA200 intersection in the next 10-15 minutes — which should coincide with SMA’s tag of 1958.94.
 UPDATE: 1:53 PM
That’s probably close enough. I’d be long again here at 1959.73.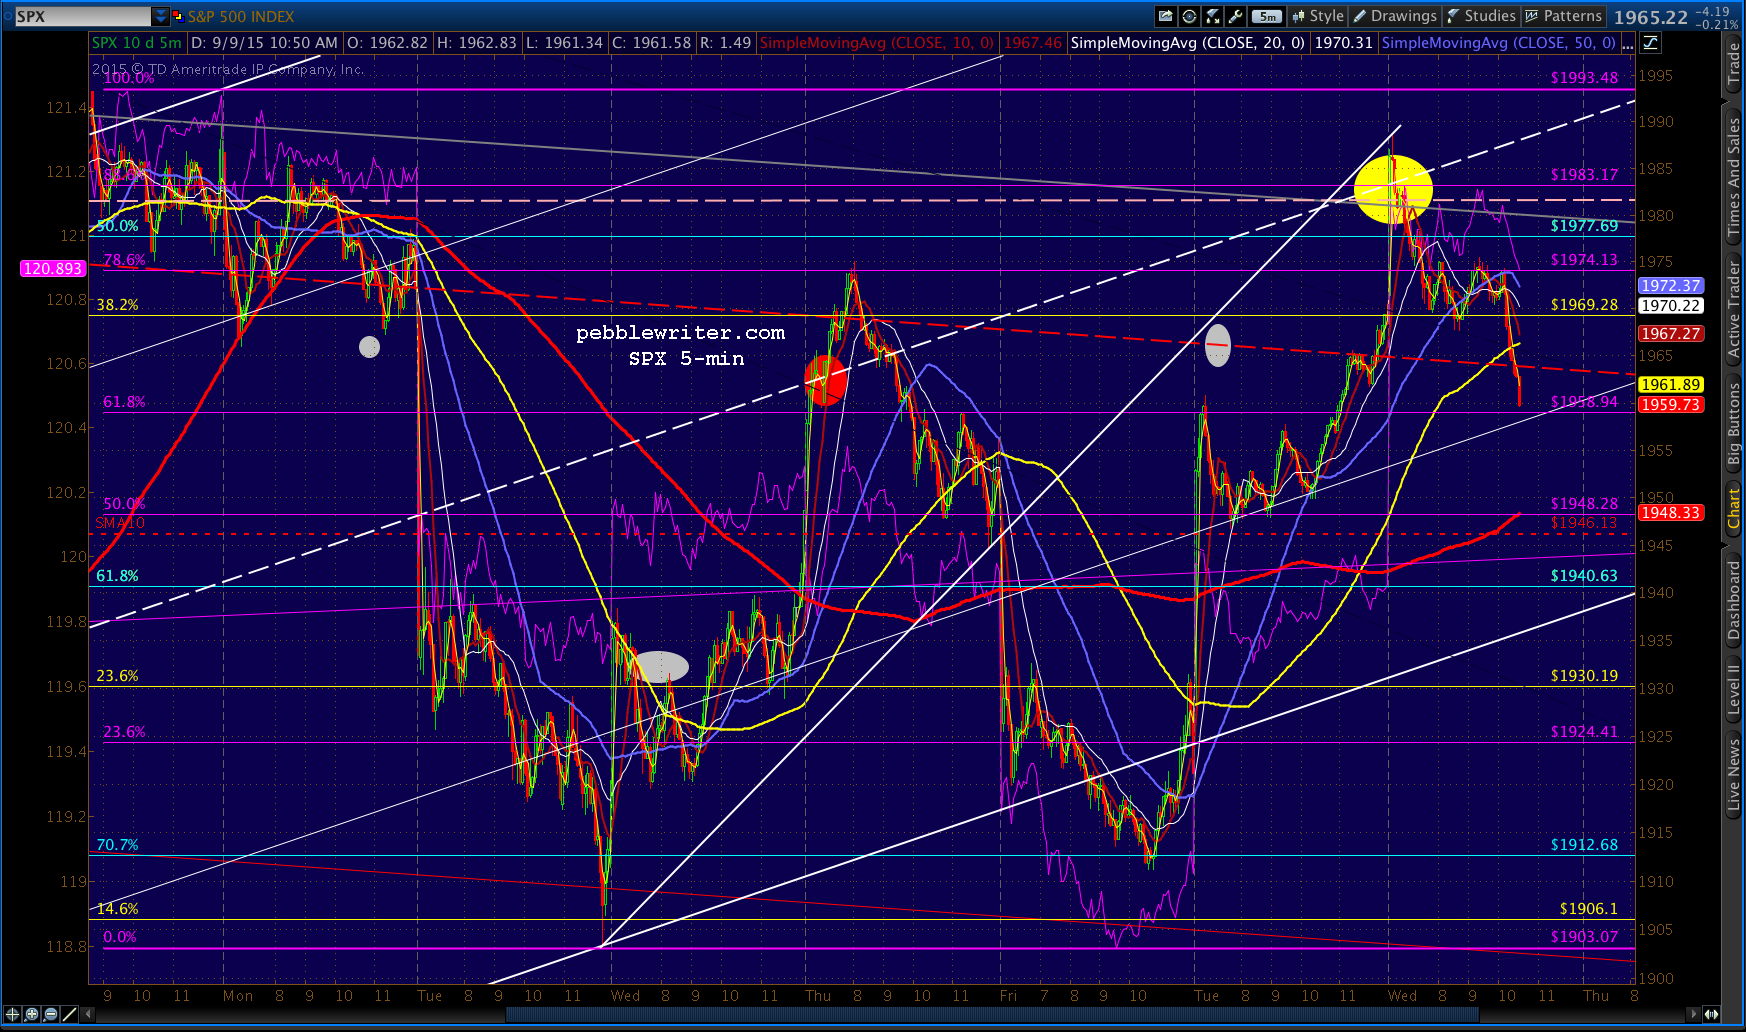 Probably leaving a little on the table, as the channel line is closer to 1958.40. But, USDJPY just tagged its 5-min SMA100, and should get a bounce even if it’s not all the way back to the SMA200 (though it would be smarter to get the SMA200 while it’s here.)
UPDATE: 2:00 PM
Finally! USDJPY’s SMA200, tagged and bagged. 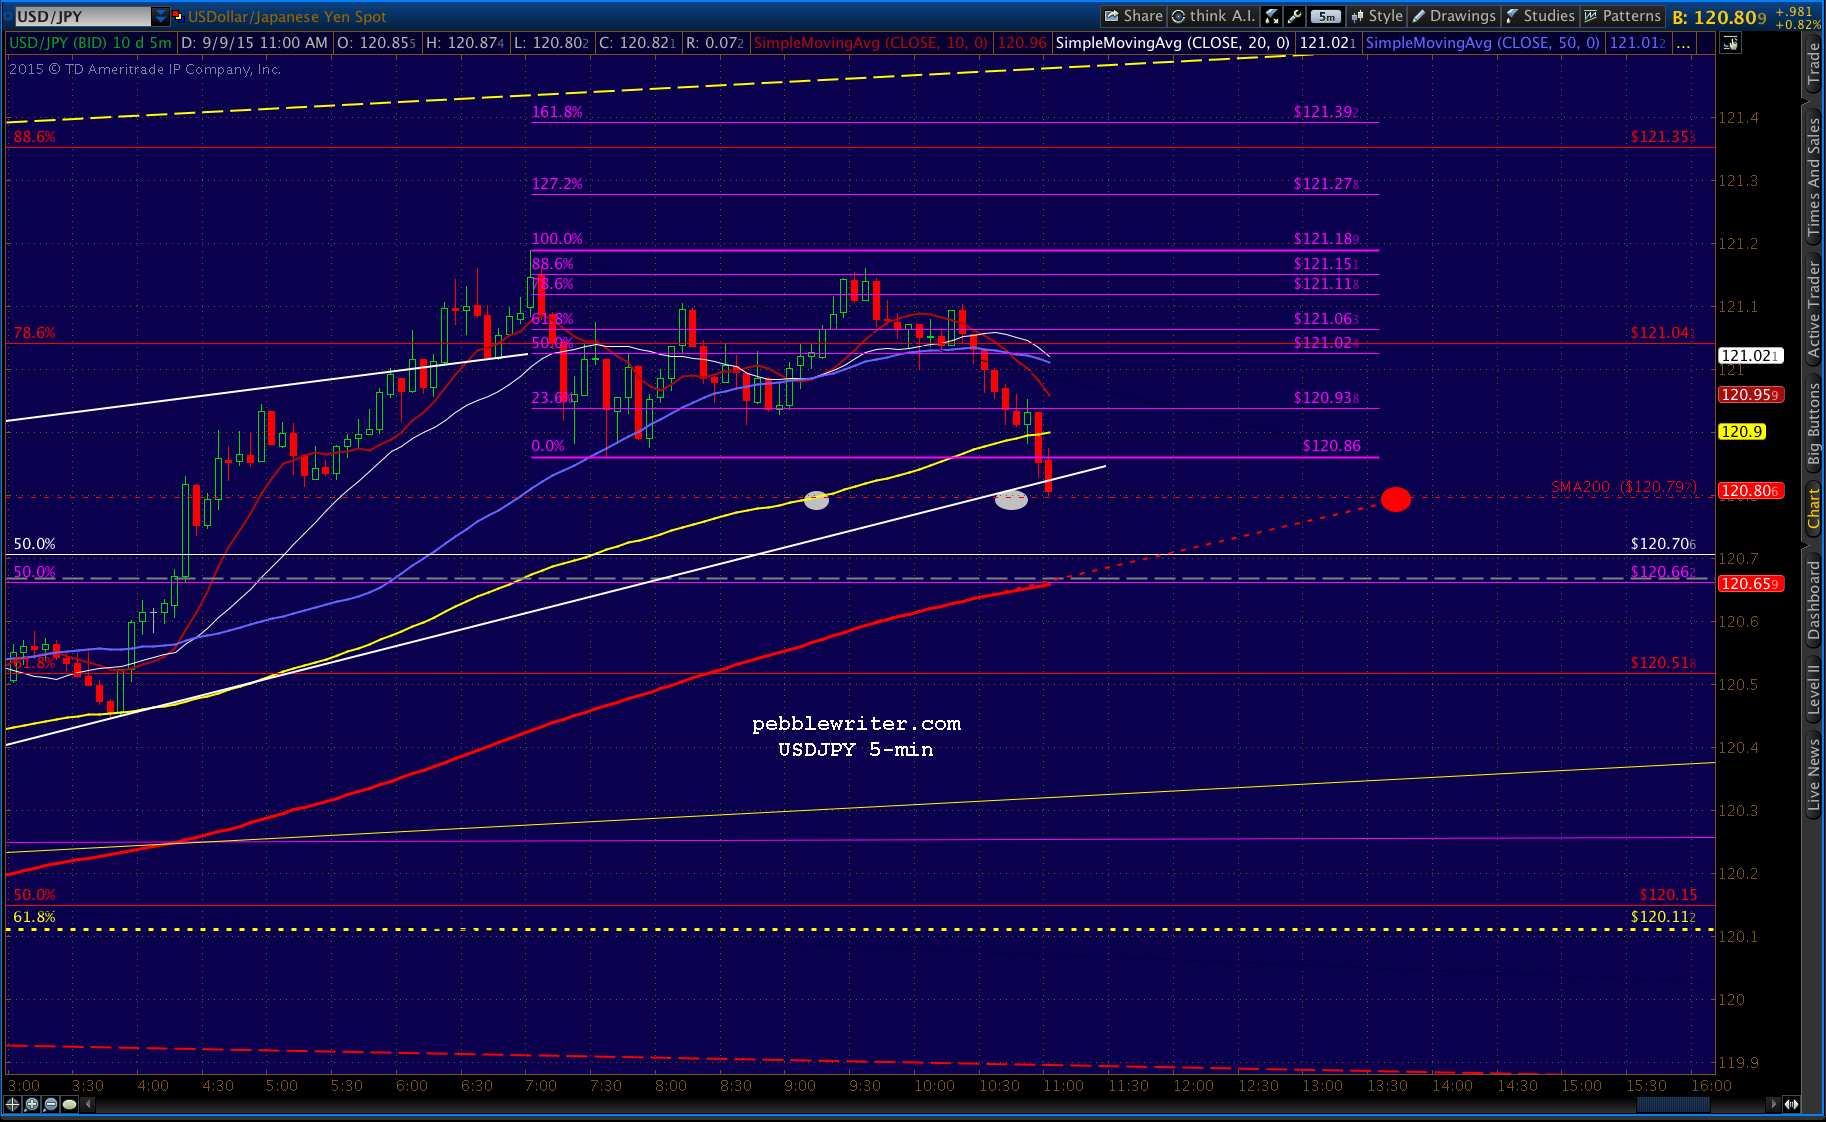 SPX should be free to rebound at this point, with a more solid tag on that channel line.
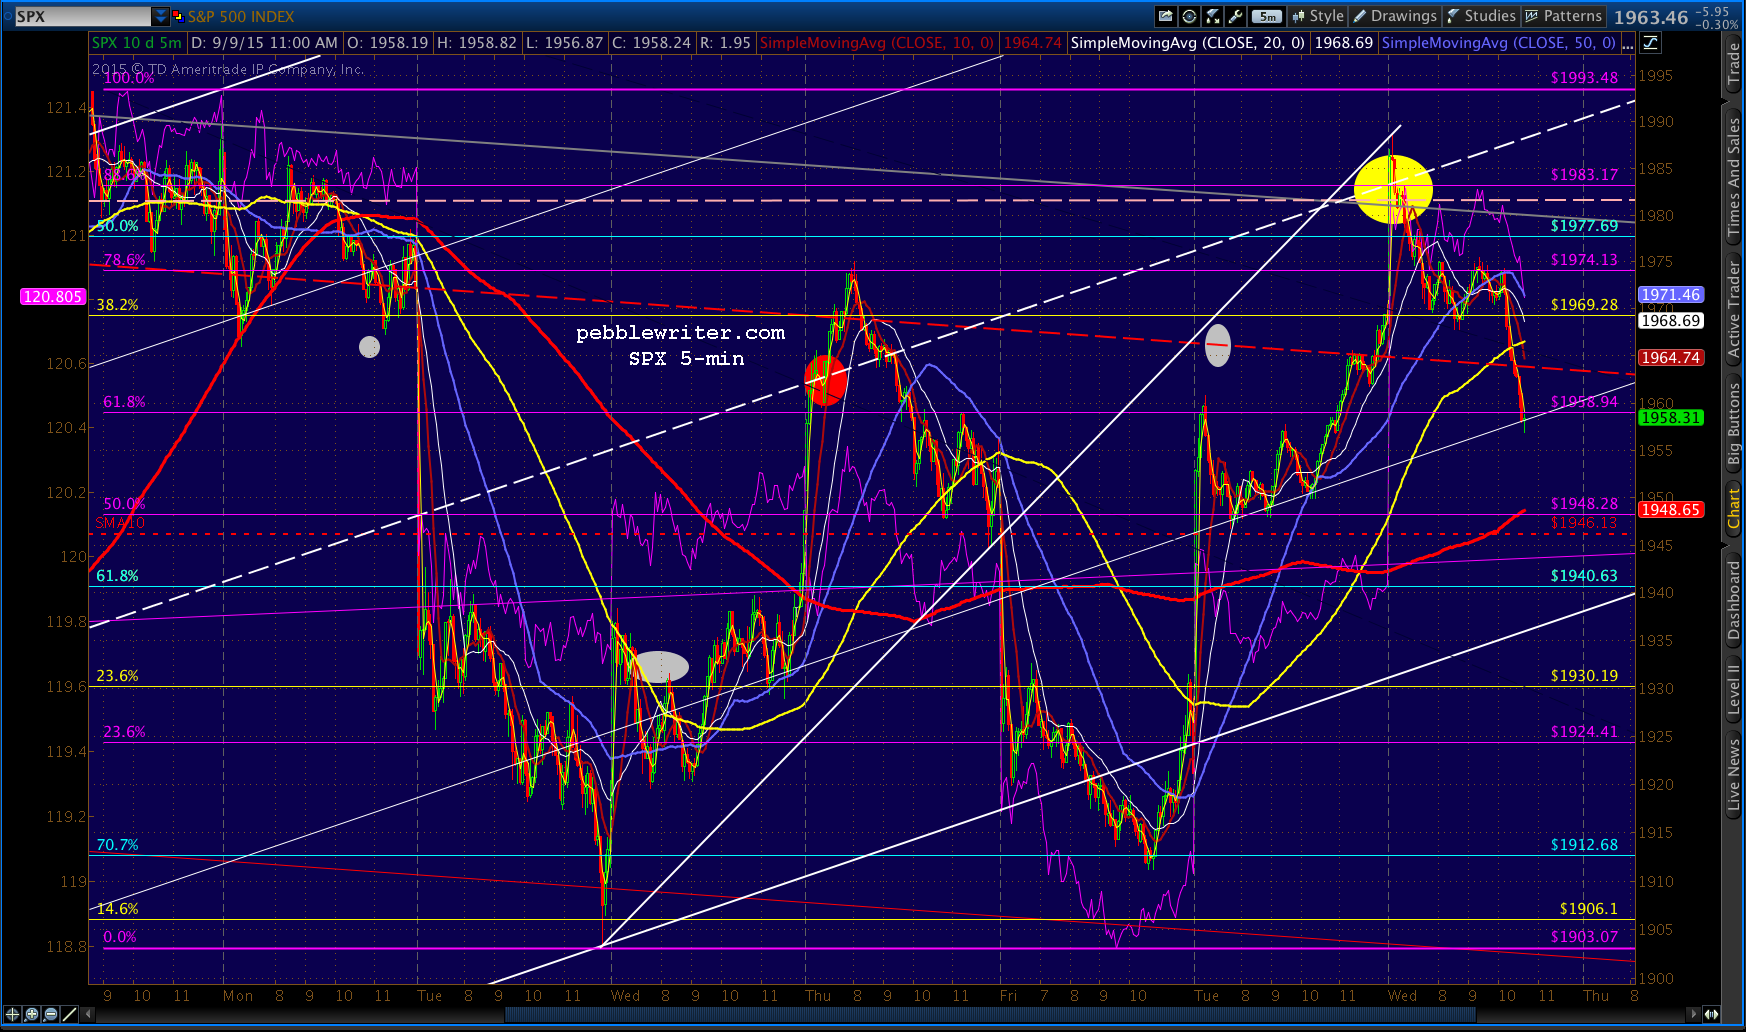 Note that the 5-min SMA200 is below at the purple .500 (1948.28.) Should USDJPY not react here at its SMA200, then that would be our next downside target. Assuming USDJPY bounces here, though, I’d want to be long.
UPDATE: 2:42 PM
Well…the bounce didn’t last. USDJPY continues slumping, and SPX is following right along. So, the next downside targets are on deck: the SMA200 at 1949.87 and the Fib .500 just below at 1948.28. USDJPY might be aiming for the red .618 at 120.51, or the yellow channel line at 120.35. Stay tuned.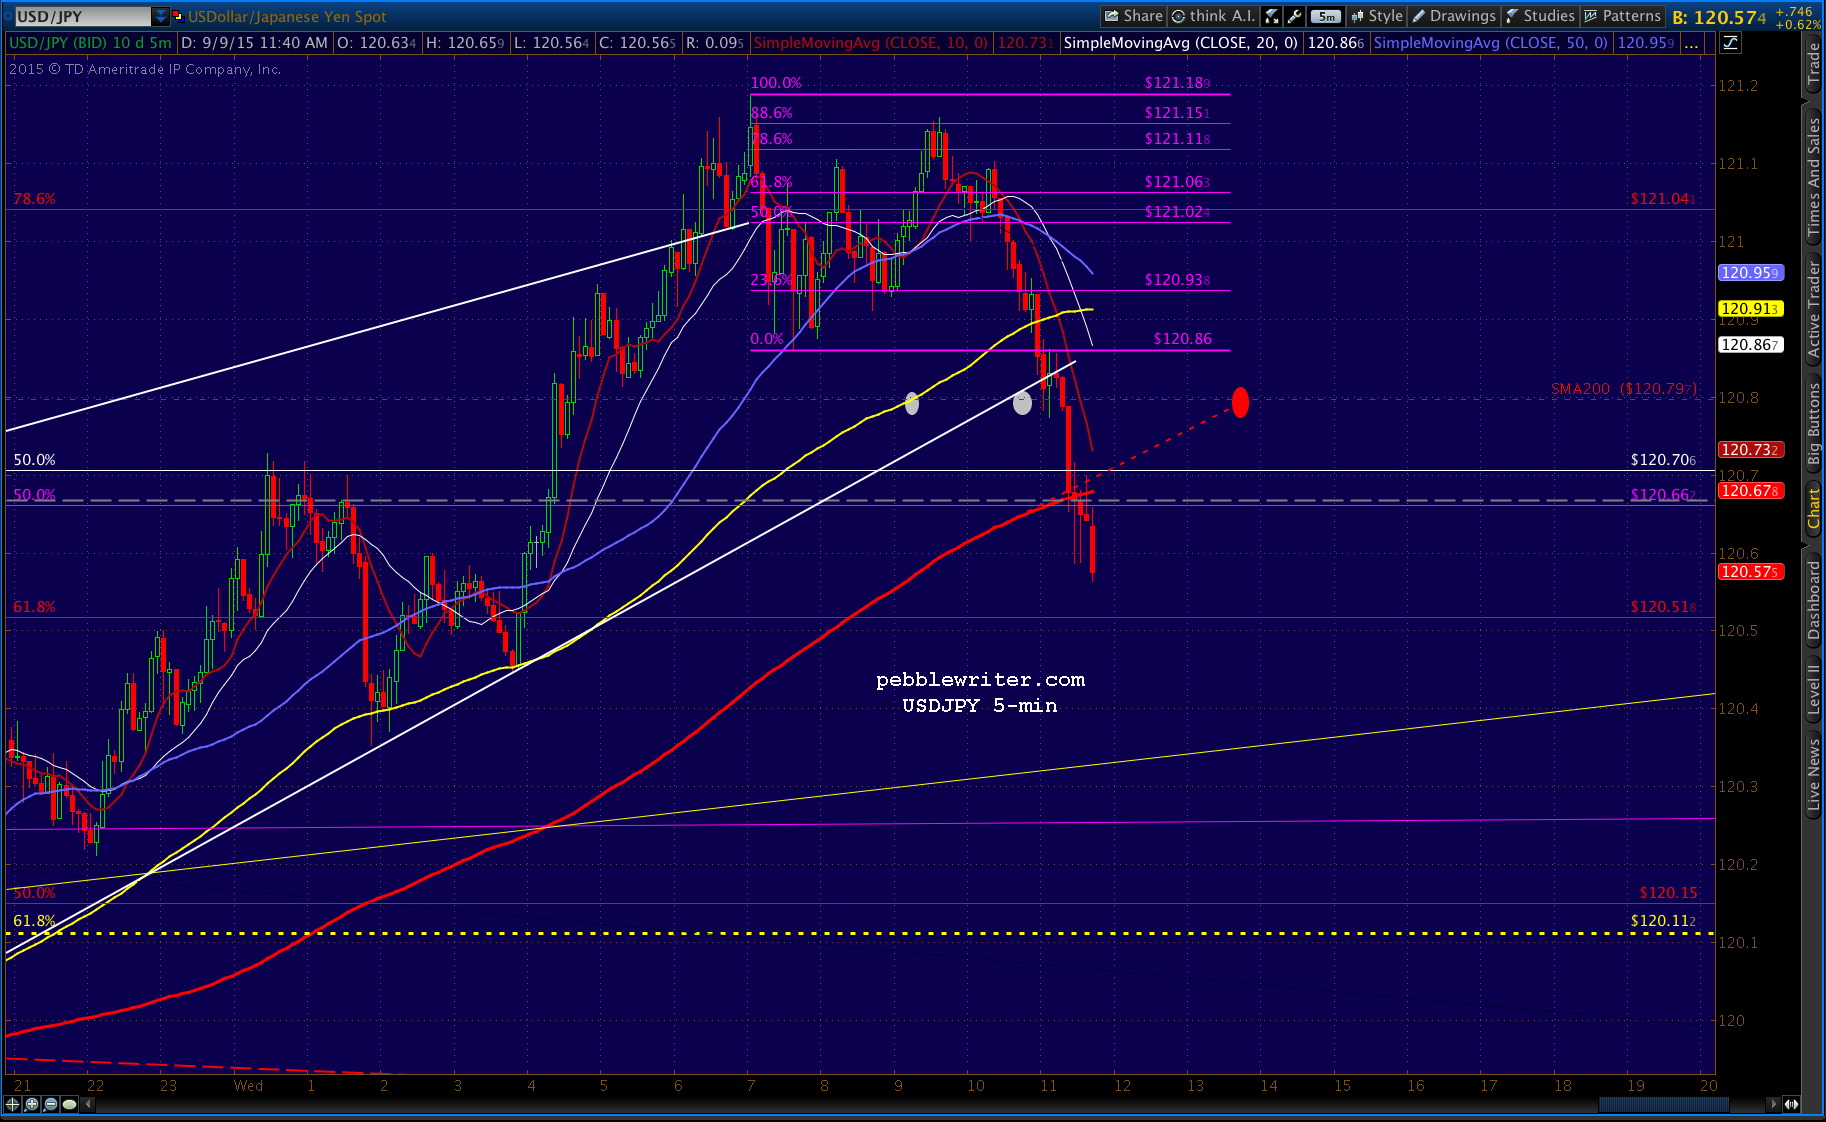 It’s worth pointing out that SPX’s daily SMA10 is currently around 1954.74 – up 8 points from yesterday’s close. SPX could reverse anywhere in here and count it as tagged. But, remember, it won’t reverse at any price until USDJPY stops dropping.
UPDATE: 3:06 PM
Nice reversal up to the broken channel line. If it pushes through, we’ll consider it a recovery and hold long. If not, it’s just a backtest that’s likely to drop further into the close.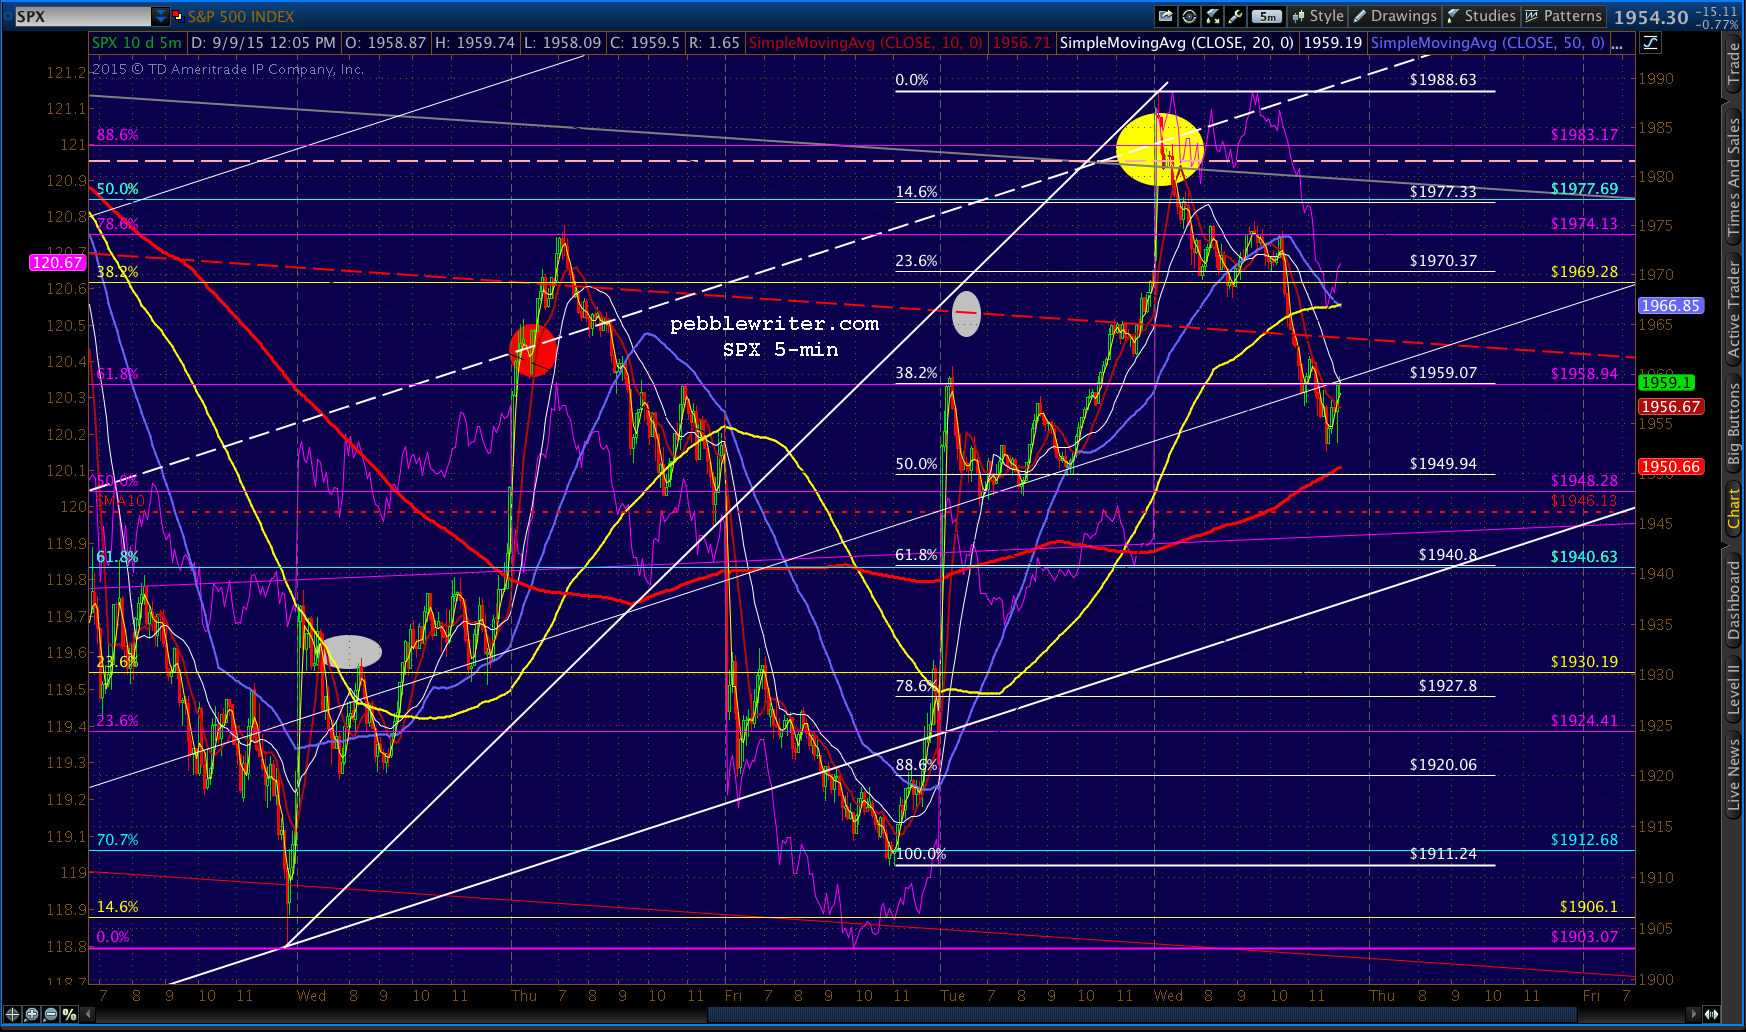 USDJPY has come back to life and is making lots of headway. It’ll run into resistance, though, at the 5-min SMA200 around 120.68. It would typically push through and close at strength, so there’s either more downside coming (SPX 1950?) or this is a pretty convincing headfake.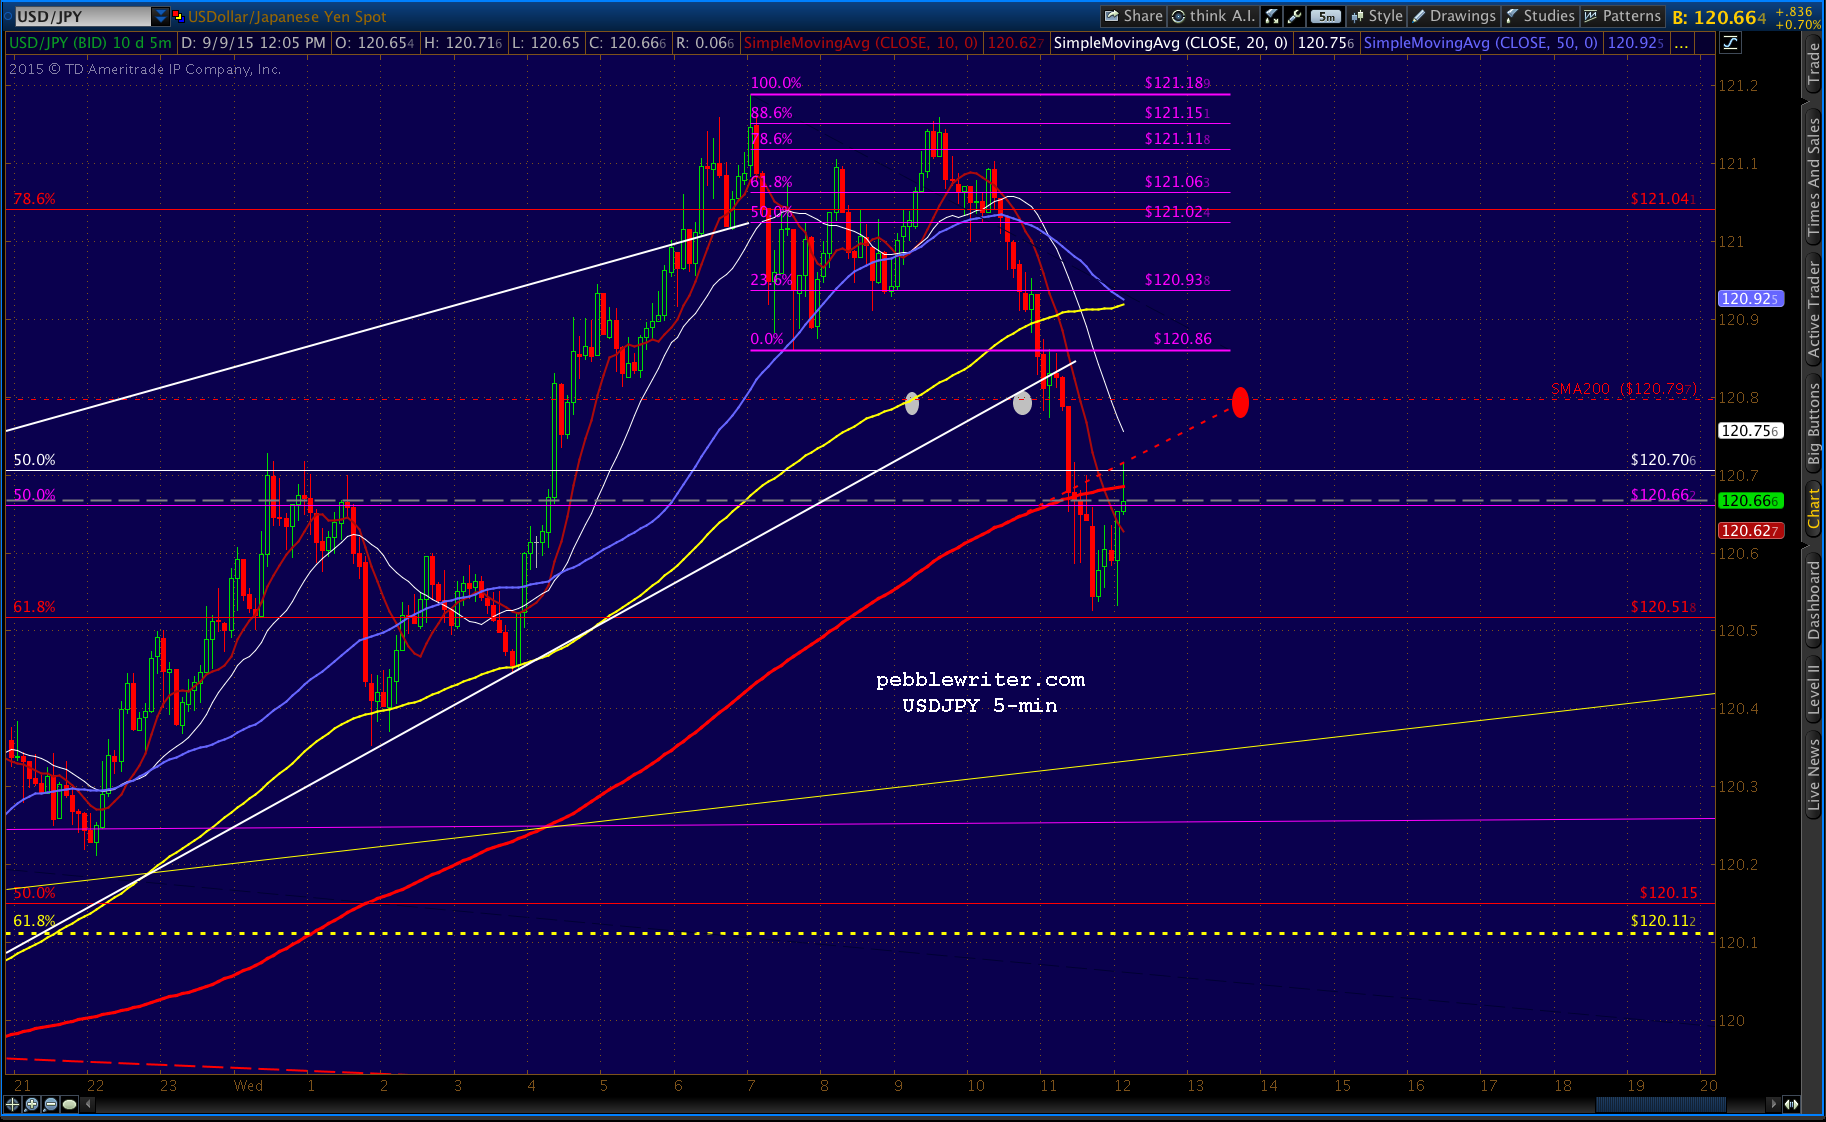
Bigger picture: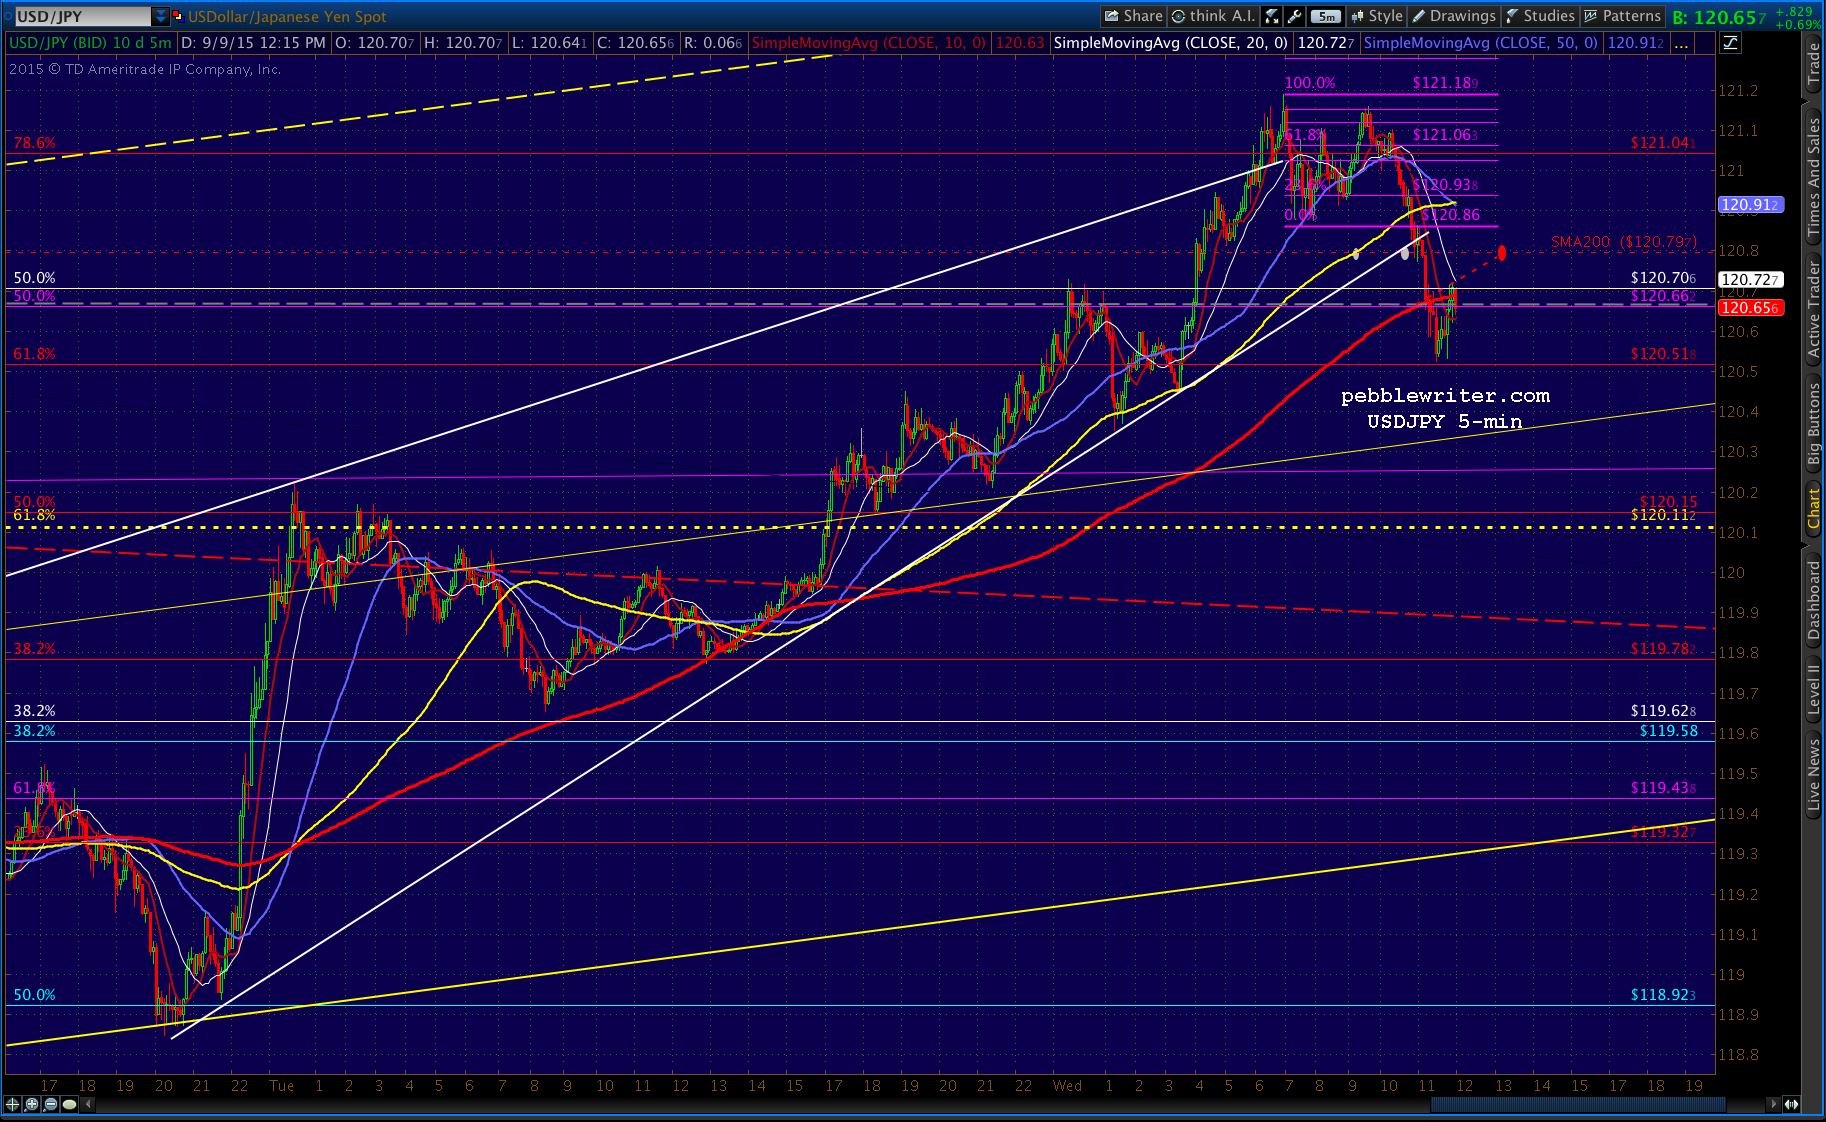 Note that CL has dropped below its recent lows — not a great development for bulls. Remember, we were looking for 42.51. But, to reach it at this point, the rising red channel would need to break down — bearish for stocks. In other words, this is probably as good as we get for the time being.
The SMA200 (which recently dropped below the SMA100) is now below 53 and as discussed yesterday, would make an excellent bounce target if the red channel holds. A close below 44, on the other hand, would be problematic.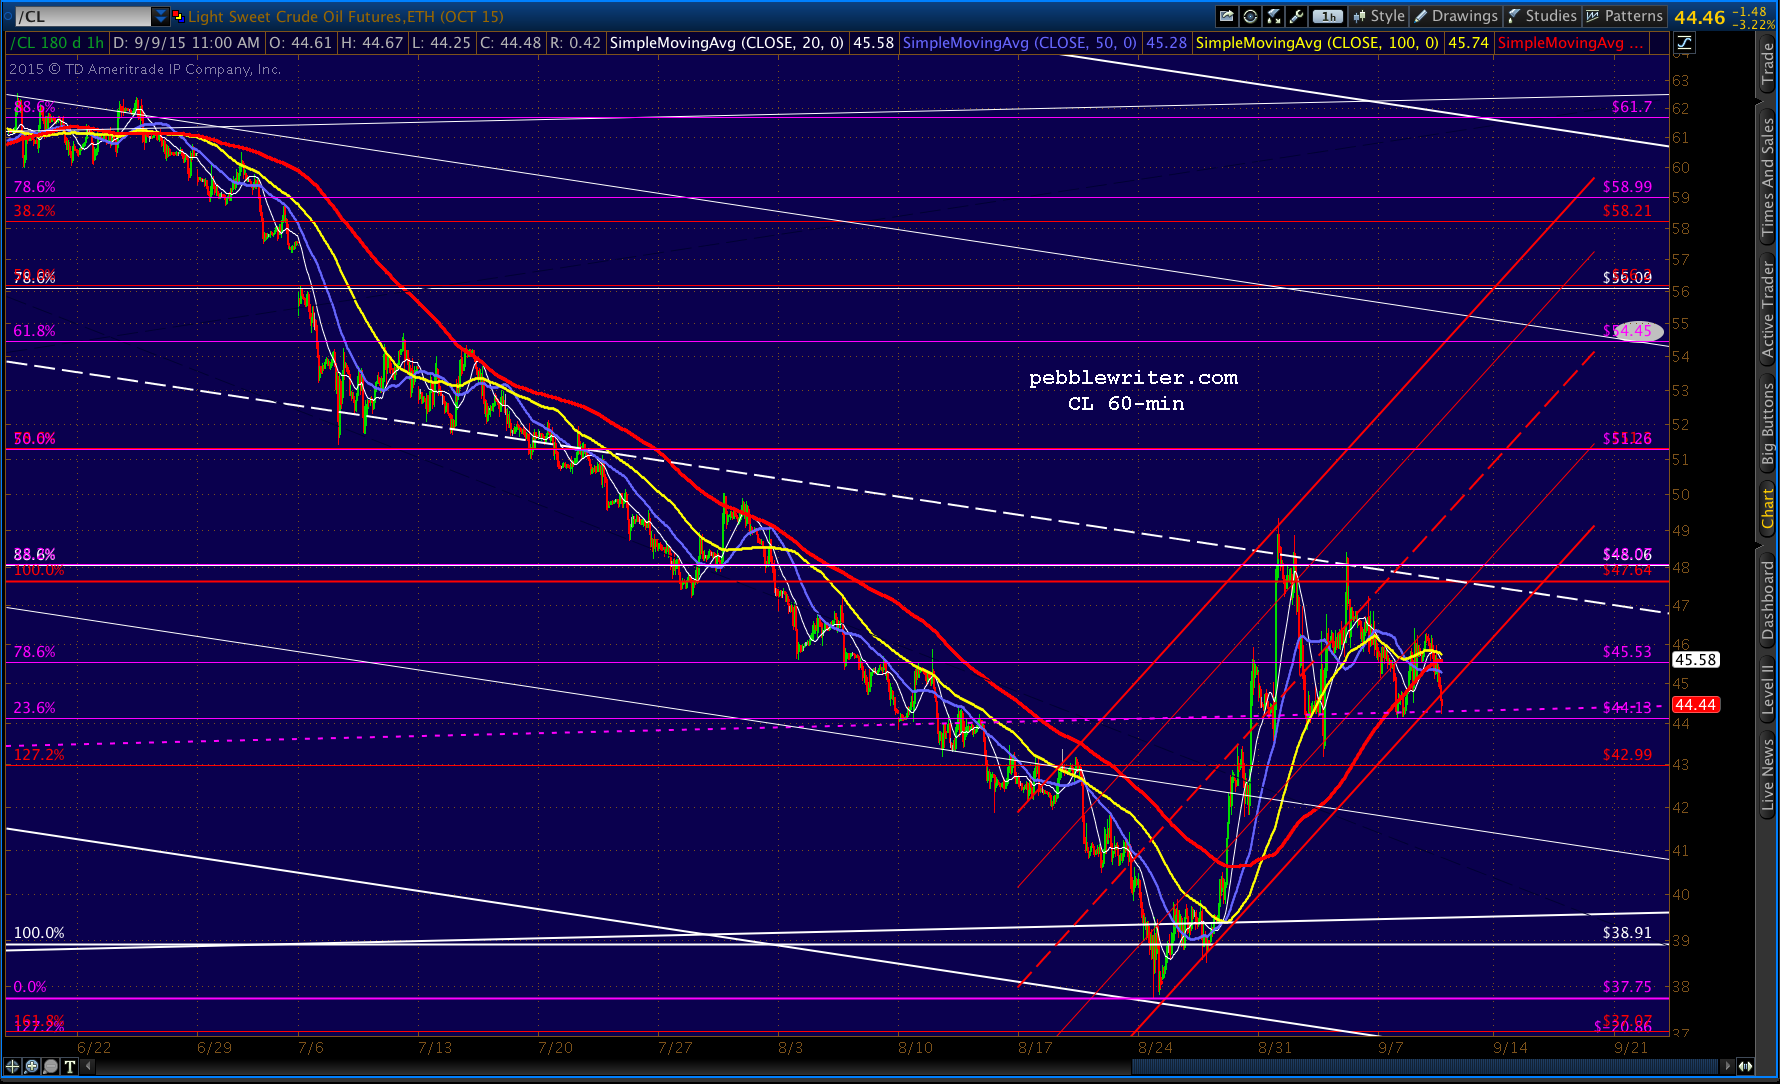 I should also note that ES needs to close above 1959.60 in order to be back above its neckline.
UPDATE: 3:34 PM
Last 30 minutes, and USDJPY just reached its .618 as SPX reached the purple .500 and SMA10. I’d take a stab at a bounce into the close here. Tight stops recommended, as the SMA10 is slightly lower still: 1946.13.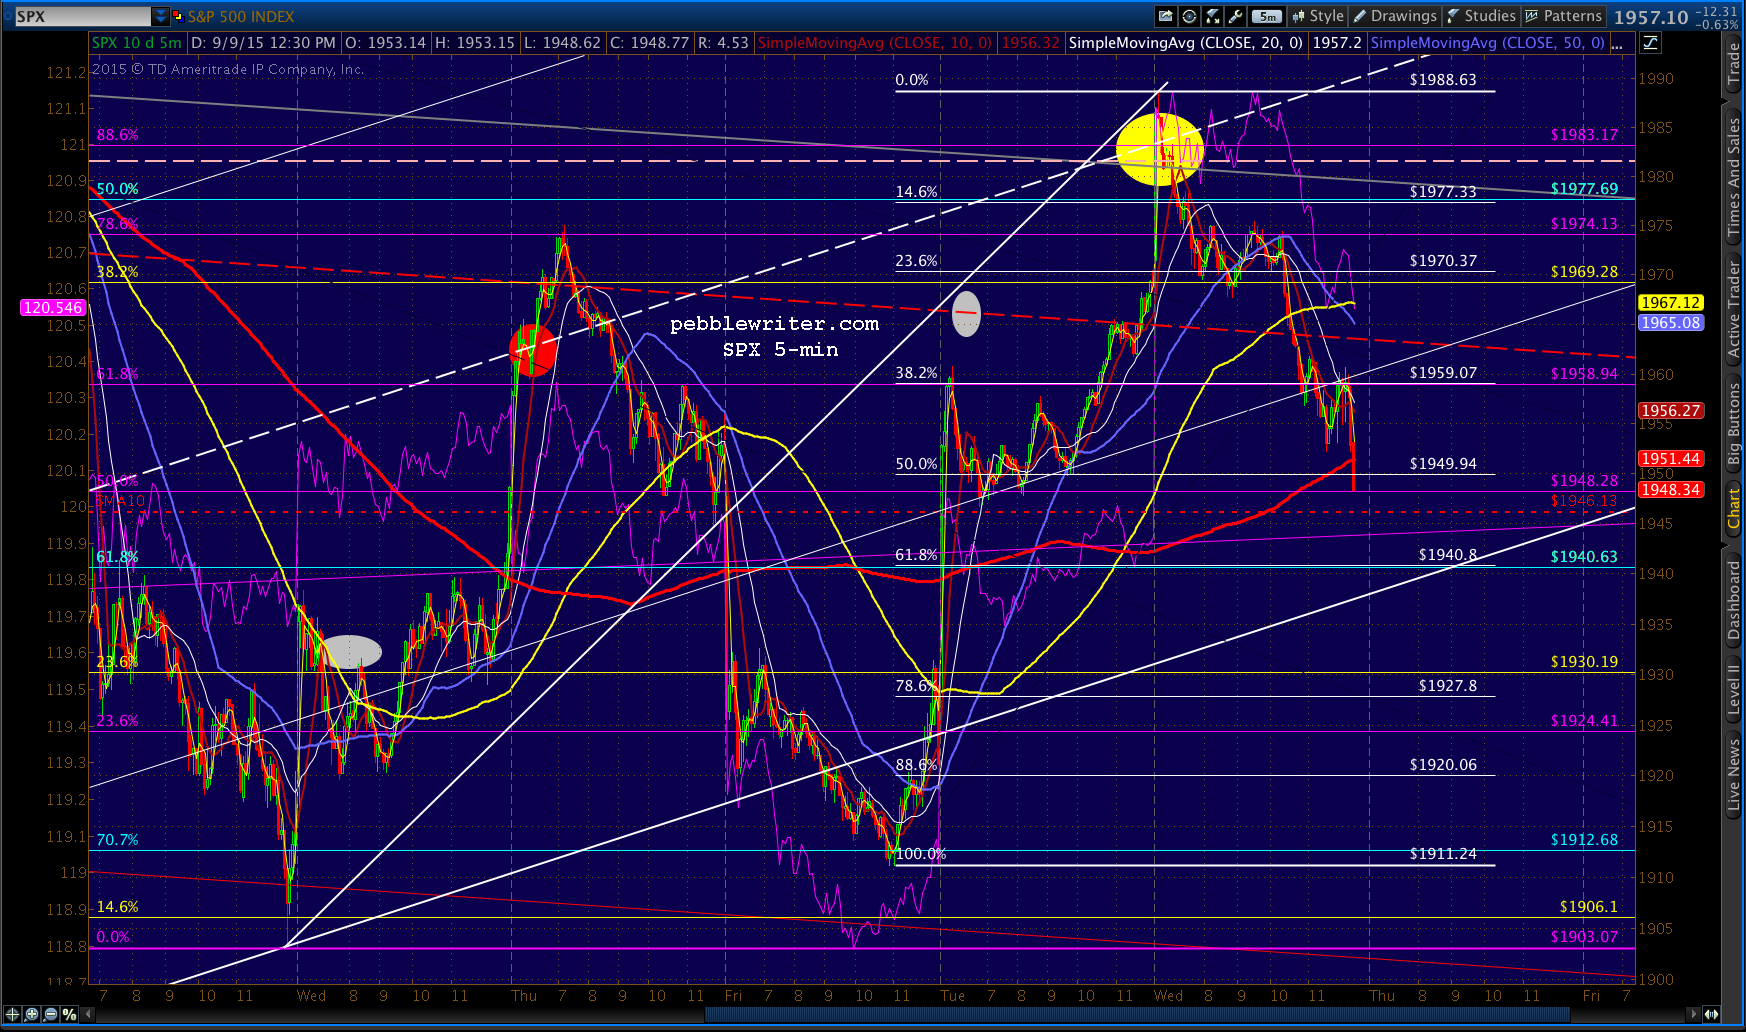 Given how squirrely things were today, I would definitely not hold overnight at these levels.
UPDATE: 3:55 PM
Wow. Stopped out again, and back where we started at the bottom of the rising white channel. A break below would be fairly bearish; but, remember how the algos love to trap traders into the cash close. I’m assuming SPX will rebound tomorrow, but wouldn’t bet on it overnight without hedging.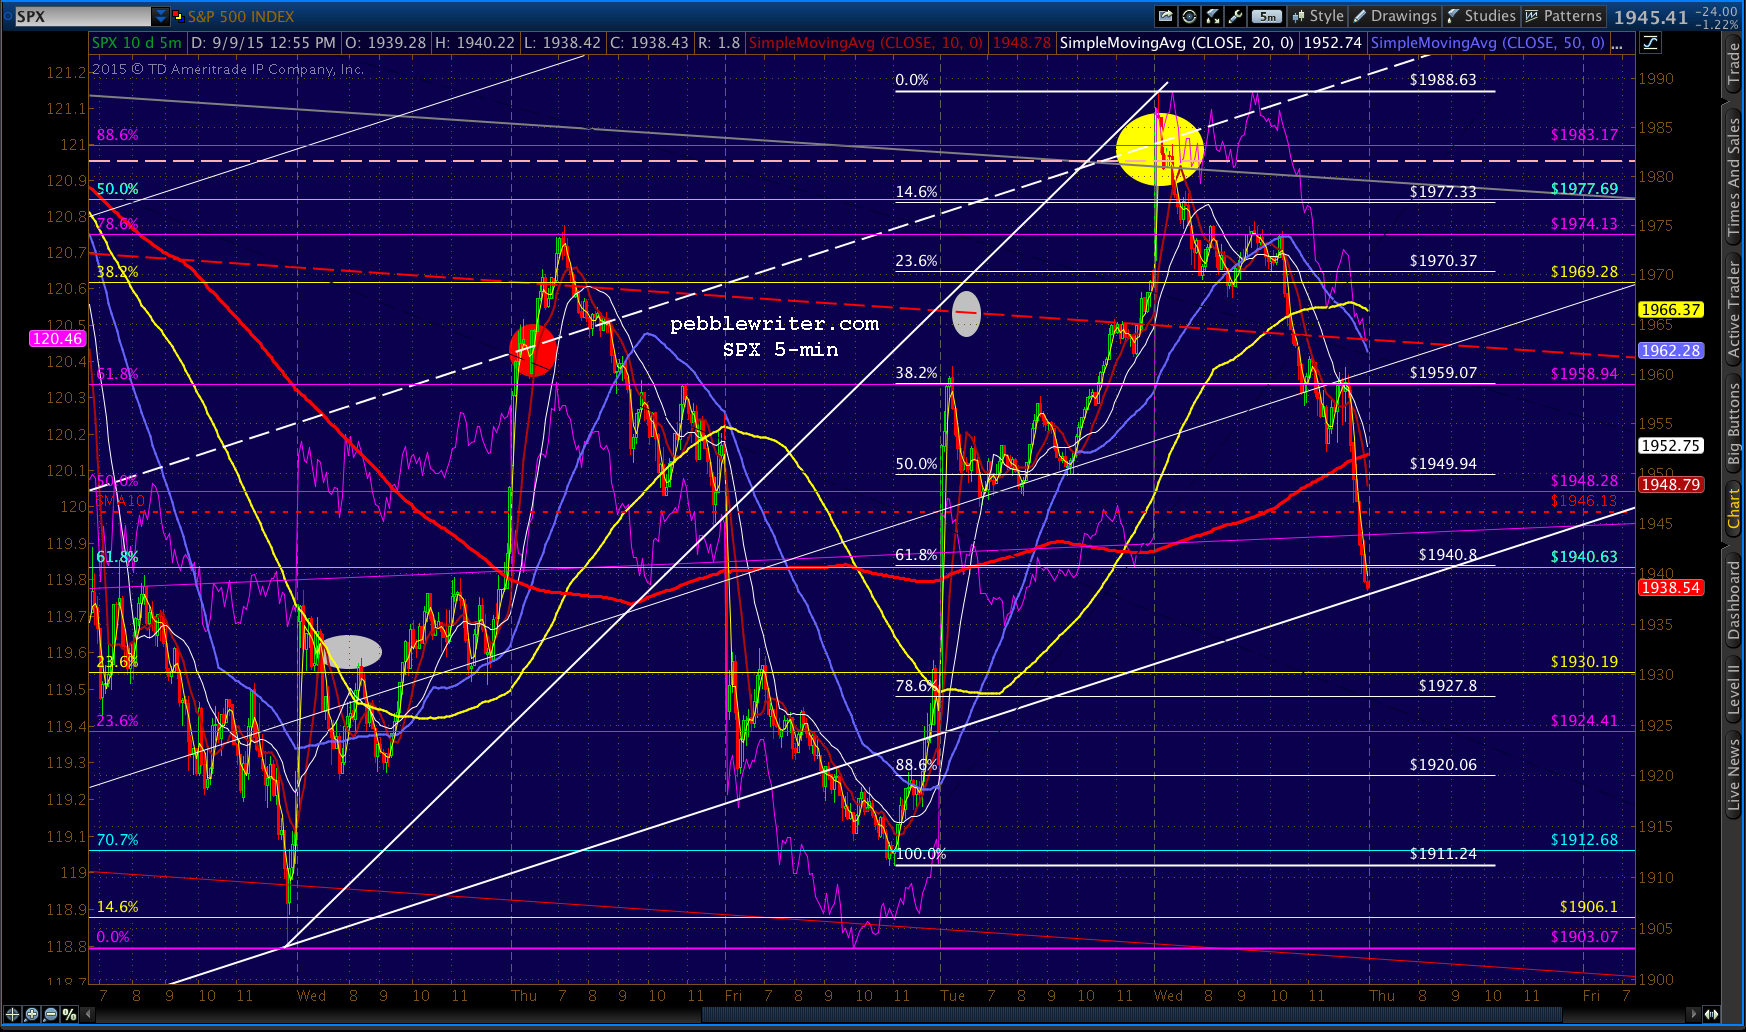 USDJPY isn’t closing at support that I can see, so the rest of story will happen after the close — whatever it is.
Please note: I will be able to chart early tomorrow morning, but will be away from about 11:00am-12:45pm. Should be an interesting day…
Epilogue after the close.
EPILOGUE:
The fact that SPX and ES retreated and tagged their channel bottoms should concern bulls, but we can’t read too much into it just yet. For one thing, today’s retracement was only slightly greater than 61.8% of yesterday’s spike.
Second, it obviously leaves the rising channel in place — with not so much as an overshoot to the downside.
Third, there have been many recent closes below a key moving average that were merely head fakes. The key charts to watch overnight, IMO, are the following:
A very well-formed channel in ES which obviously needs to maintain its momentum to avoid turning into a flag that leads to lower prices: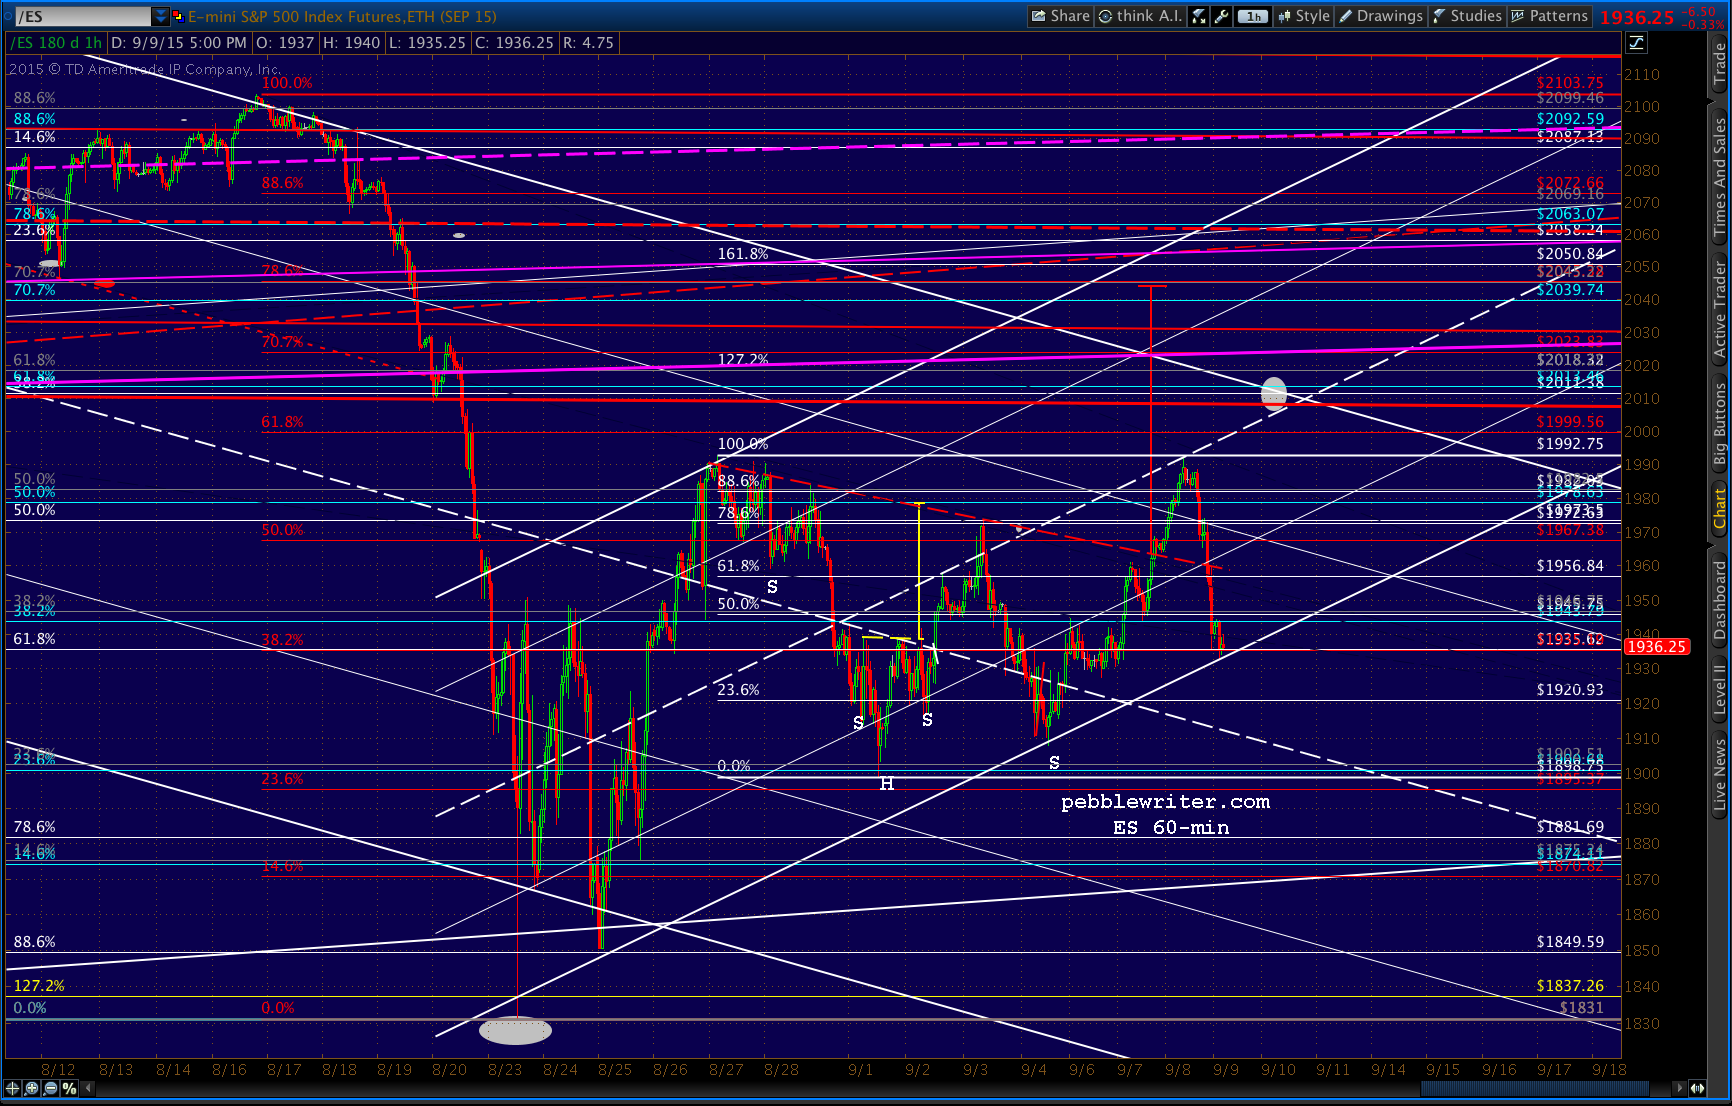 And, USDJPY, which backtested the .618 Fib after being rejected at the SMA200. It can’t go back below 120.11 without damaging stocks uptrend.
 I have some more charts which I will try to post either later this evening or in the morning.
A reminder: I will be out between 11:00am-12:45pm tomorrow, so plan your trading accordingly. It could be a volatile day.
GLTA.


 But, like CL, NG is being artificially suppressed in order to facilitate a cheaper yen. When it comes to Japan, it remains to be seen whether central bankers can handle that kind of inflationary pressure.