

VIX finally broke out of its 8-month old flag pattern, and did it in style. In the process, it did a darn good impersonation of the 1997-2007 cycle.
 continued for members…
Note that the latest breakout only retraced about 50% of its 2008 highs, whereas the 2007 spike retraced over 70% of its former highs. From a Fib standpoint, then, it’s quite possible that the recent highs will be exceeded. 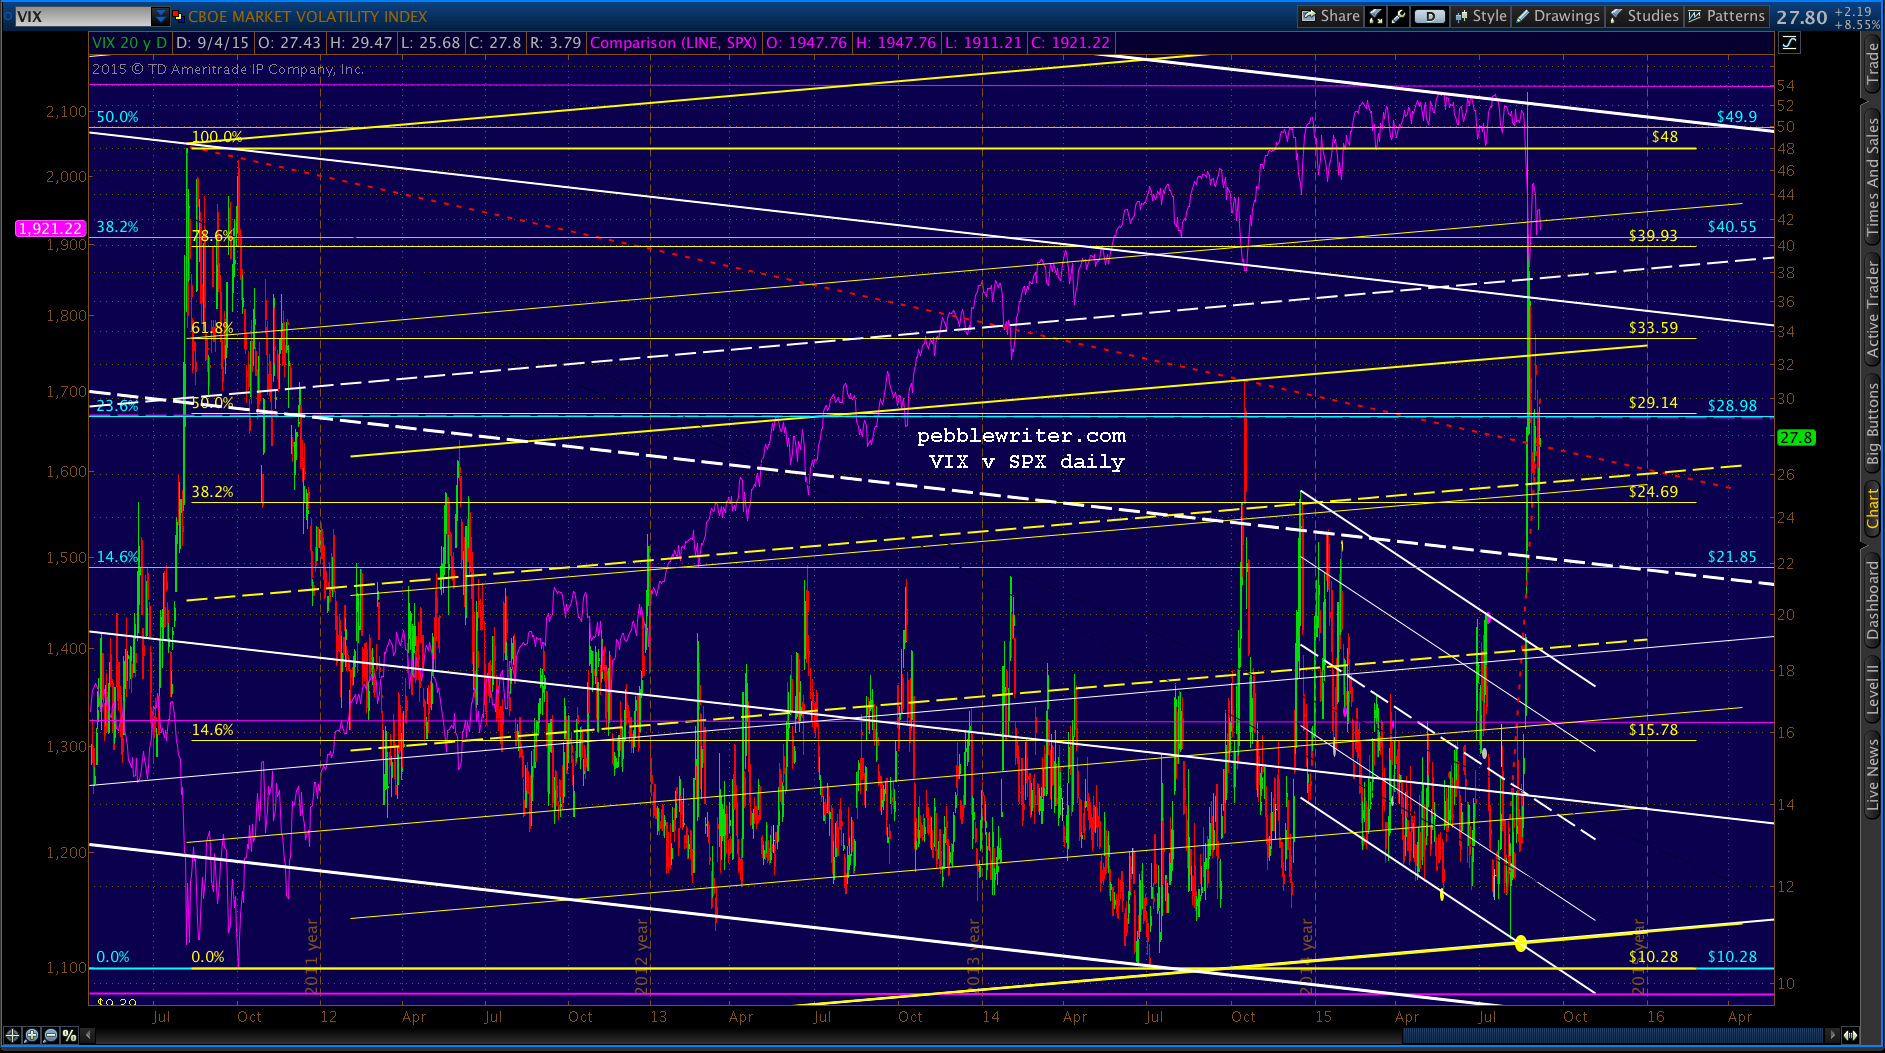
From a channel standpoint, it’s a little tougher call. The falling white channel certainly suggests the upside is over, though the rising yellow and white channels make a good argument for higher highs.
Zeroing in a little tighter, we can see that the TL off the Aug 2011 highs serves as a pretty good sign of indecision. Ditto for the rising red TL that was exceeded, but is now being backtested.
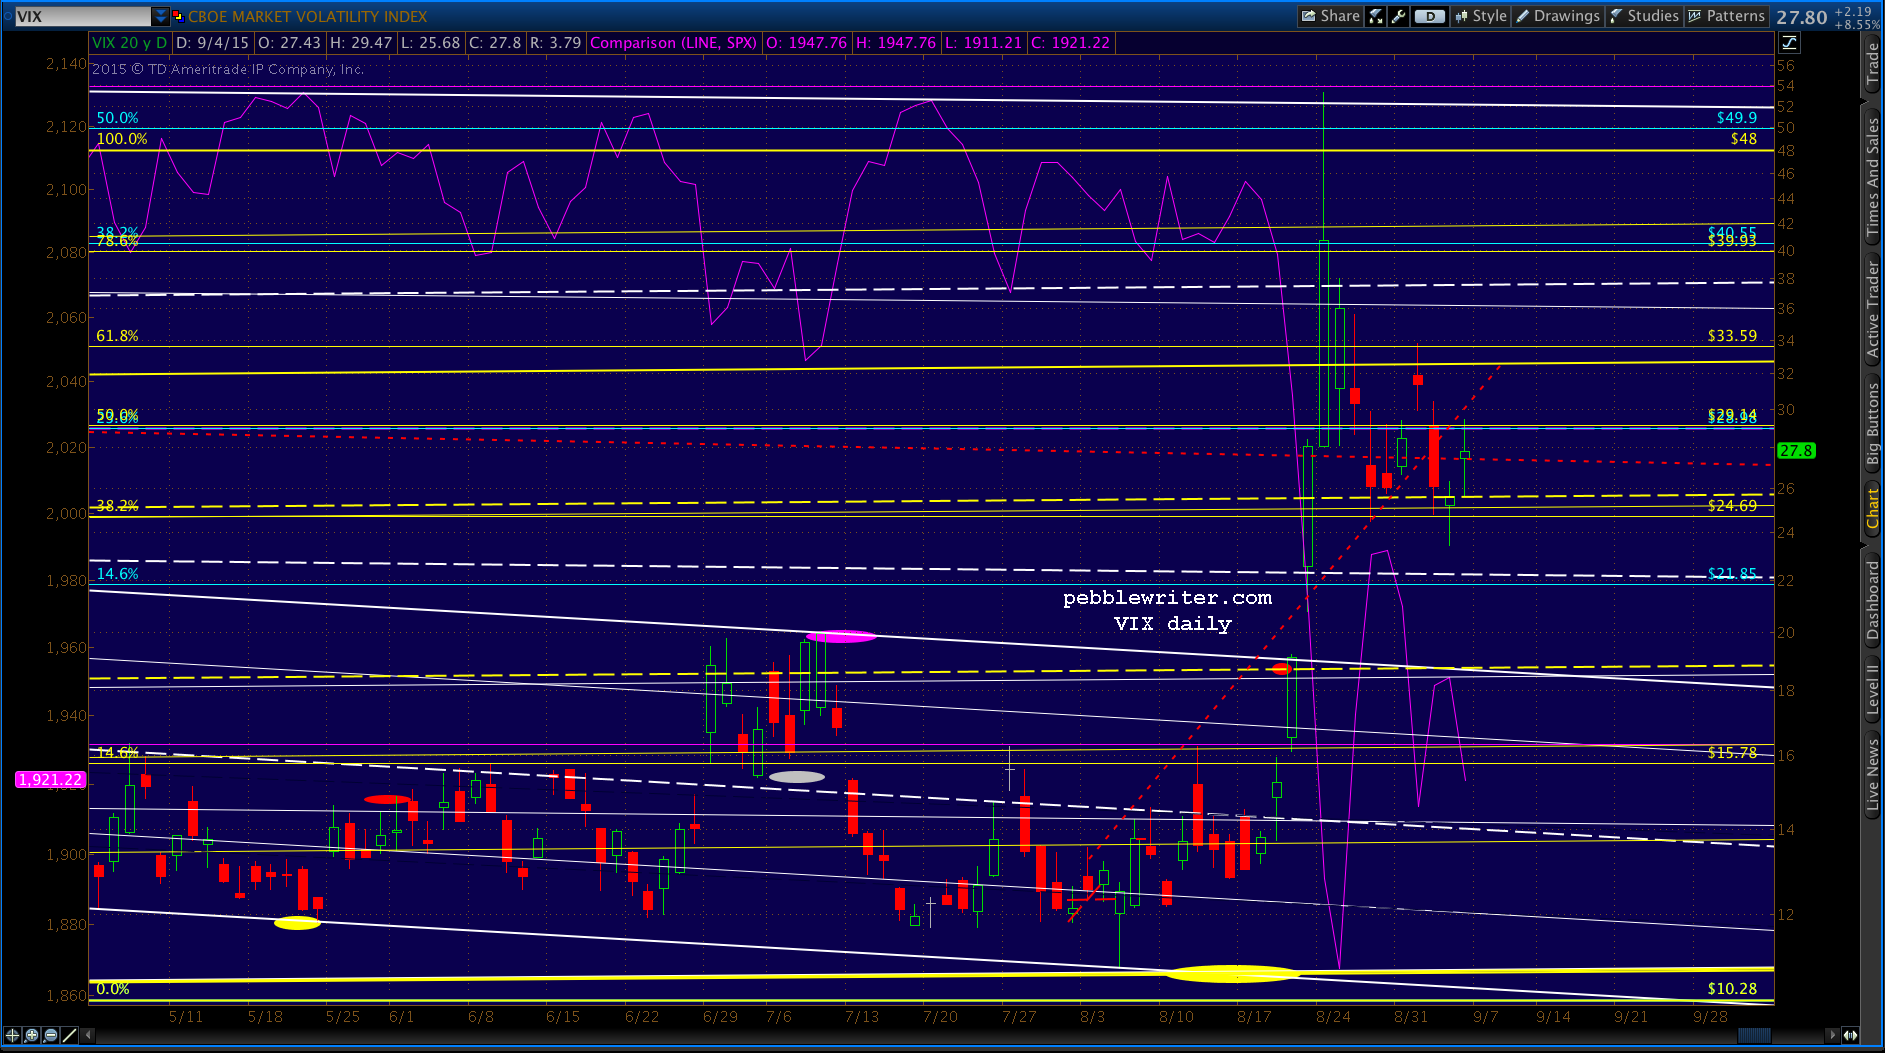 In sum, the charts aren’t very clear at present. But, we’ll keep an eye on these TLs and see if they develop into channels that help clarify things.