

SPX spent all day being forced lower in order to reach the midline of a rapidly rising channel, only to face a 50-pt drop in the overnight session after Chinese economic data and, more importantly, a plunging USDJPY did a number on the gains of the past week. With USDJPY back below the critical .618 at 120.11, the BoJ has a choice to make: watch the past year’s gains vaporize, or devalue the yen further to support the “market.”
While the overnight drop in the futures might be dramatic, it’s important to note where SPX’s channel support lies.
continued for members…
SPX should land at or near the bottom of the rising purple channel — depending on when the USDJPY pops back above that .618 at 120.11. We’ll watch, then, to see whether or not the channel will hold.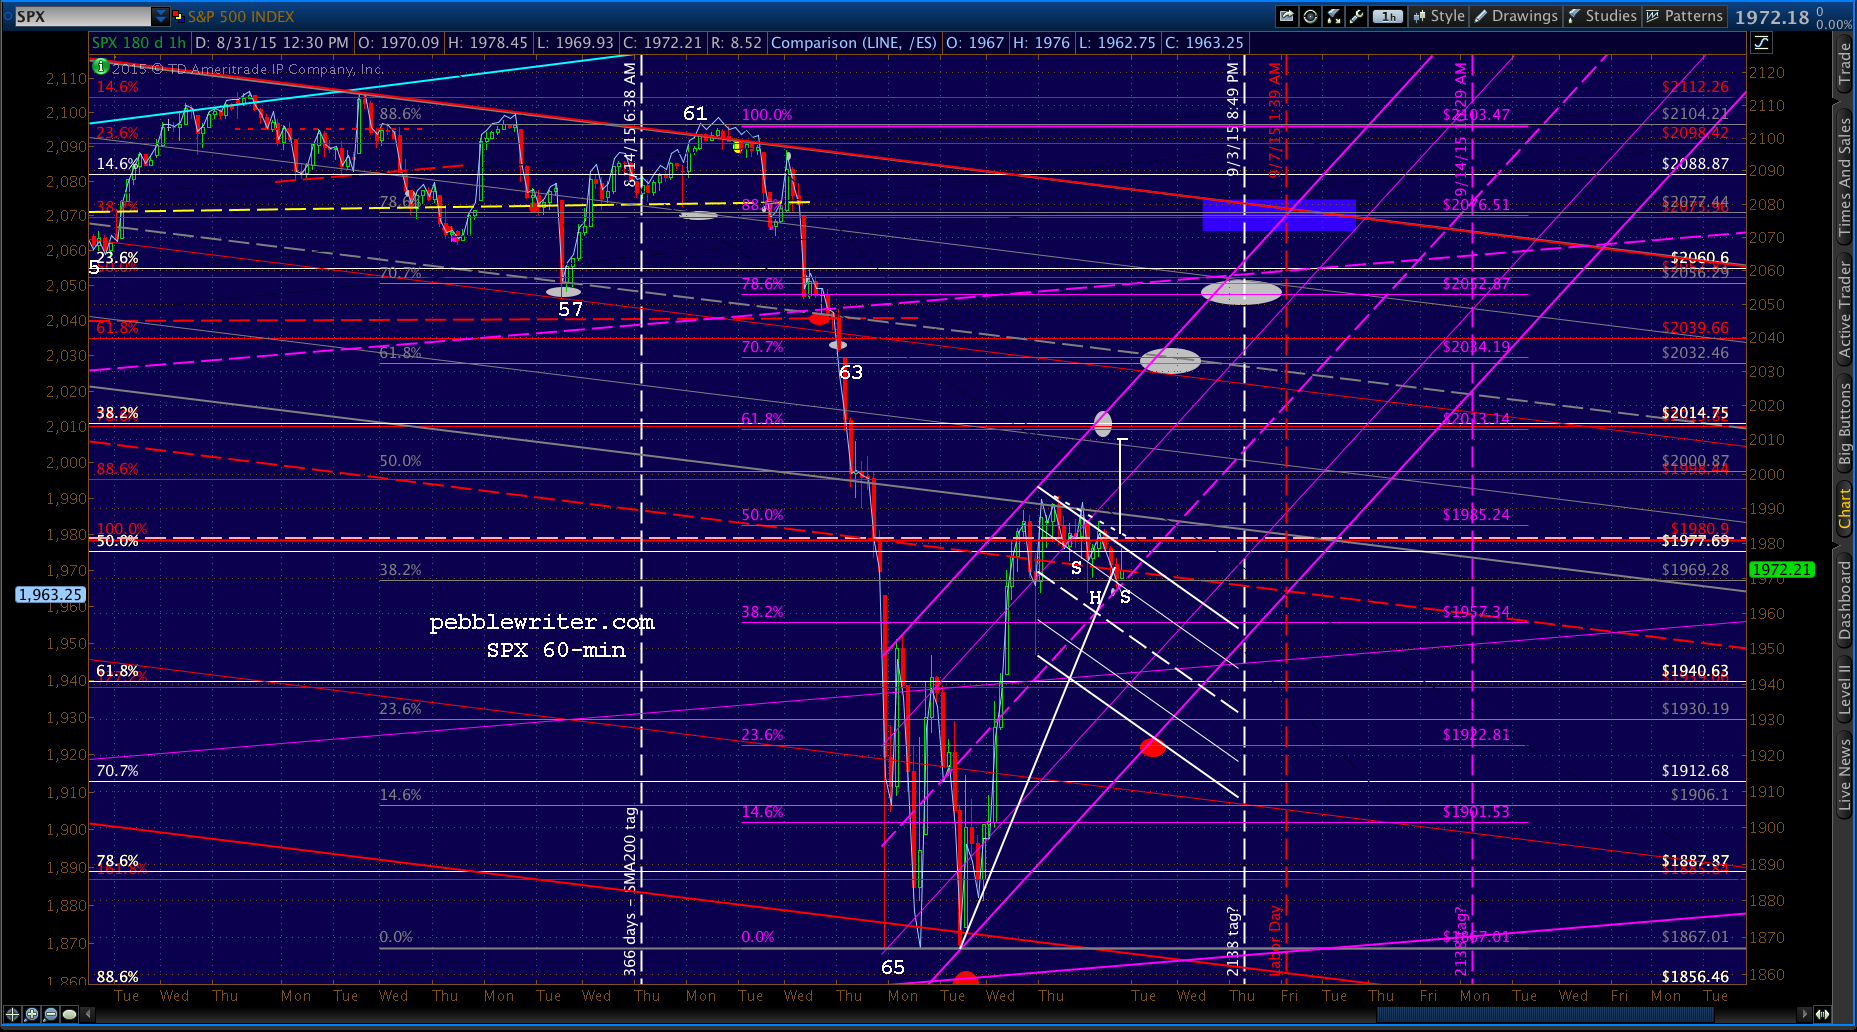 I should point out that the falling white channel intersects the gray .236 Fib in the opening hour, so it’s possible that we’ll see a three wave decline to 1922 later in the day after first bouncing at 1930ish. It’s also possible that the initial decline is all that we get.
We’ll get a sense of when the decline is over when USDJPY rises and stays above 120.11.
NKD is likewise in a precarious position. More shortly…
UPDATE: 9:44 AM
 UPDATE: 9:47 AM
Note that the 1930.19 Fib belongs to the gray set rather than the purple set. The gray set started at the all-time high, whereas the purple set started at the more recent 2103 high. All this to say that the gray set is the one that eventually win out if our analog is to hold and SPX tests the former highs.
From a Fib standpoint, the .618 retrace of the rise from 1867 is at 1915.36 — which could easily be achieved within the purple channel if it happens quickly. The .500 retrace is at 1930.28 — much more in keeping with the gray .236 at 1930.16.
 A quick picture of the 5-min chart on USDJPY. I think it will backtest the white TL very soon, which might produce the additional downside SPX needs.
 UPDATE: 10:10 AM
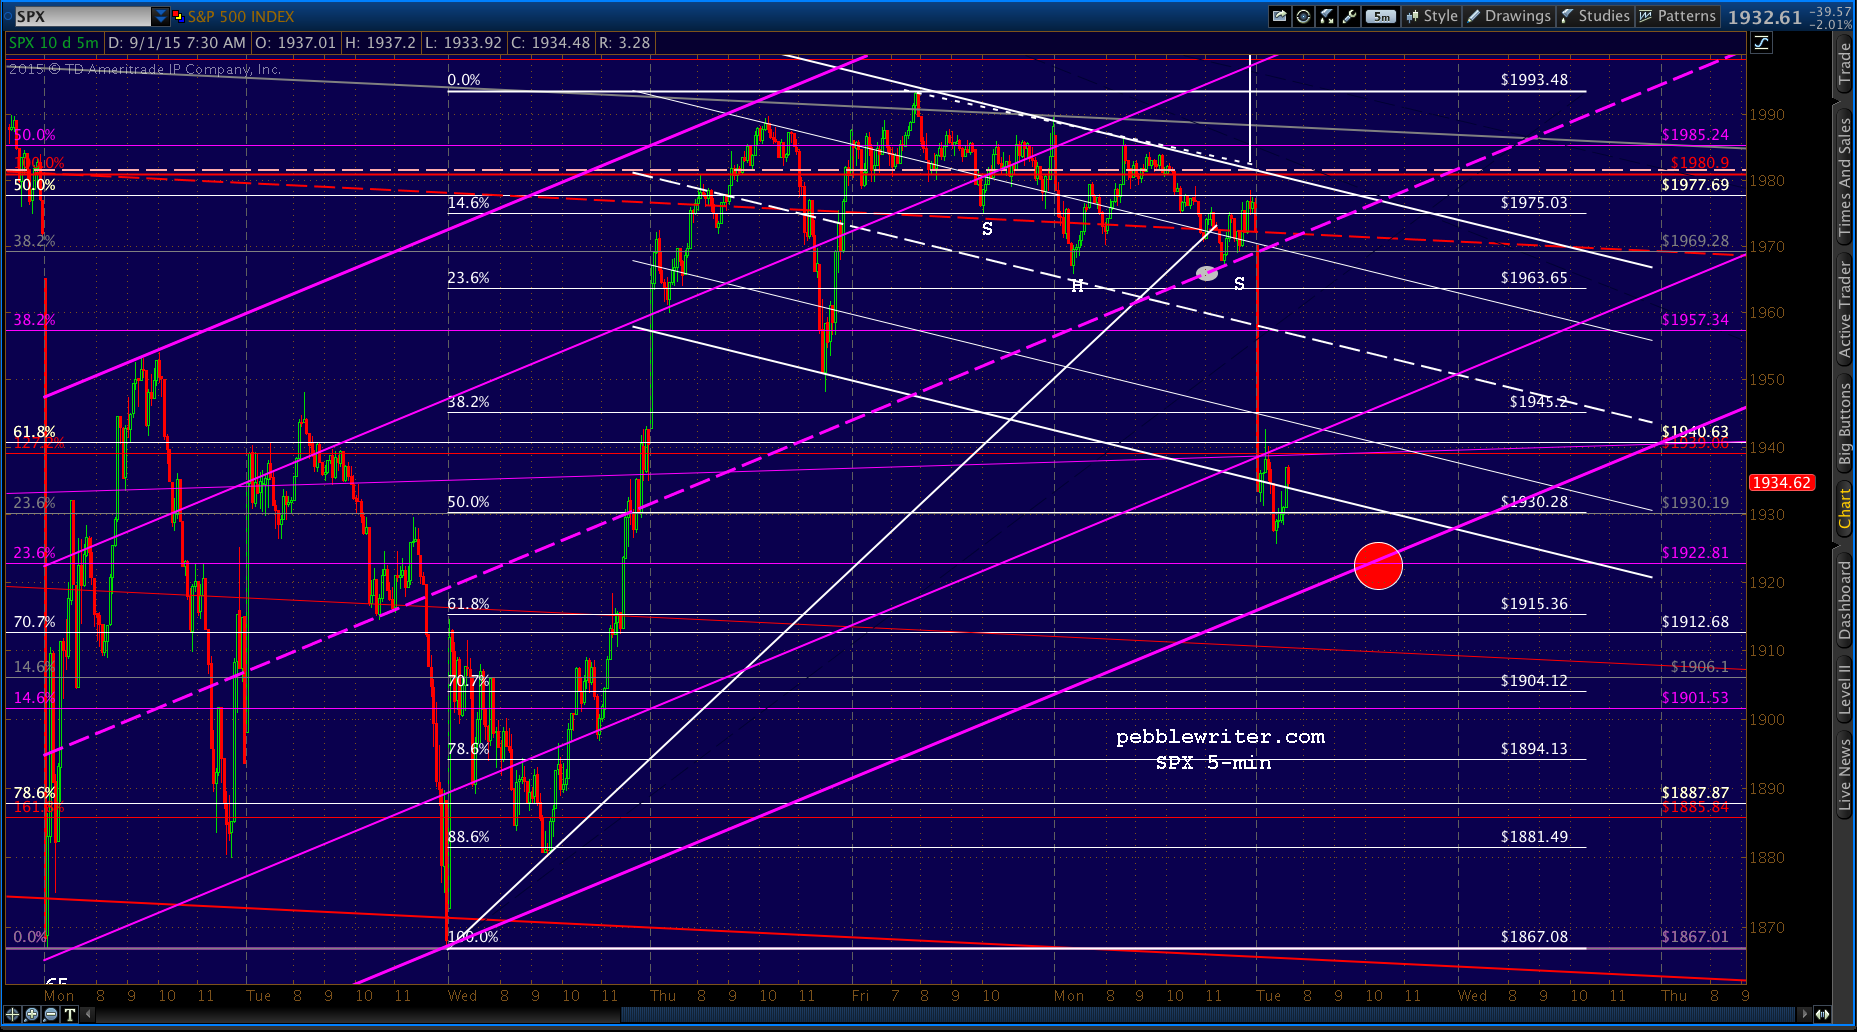
There’s no Fib or channel justification for it, but USDJPY just popped back above the TL, so I’ll assume SPX is going to bounce here. Maybe just a backtest of the falling white channel bottom? Unless USDJPY stays above that TL, I’ll hold short just a little longer. The problem is that SPX really ought to tag the bottom of the purple channel in order to provide a more solid bounce. And, it hasn’t. It could go sideways all day and achieve it — as occurred yesterday — or it could dip to 1915-1918 and get it over with. Or it could bounce hard from right here. Hard to say…
Not to complicate things, but there’s also the red channel .236 line at around 1910.
 UPDATE: 10:33 AM

 UPDATE: 10:38 AM
 Chances are SPX is going to bounce around all morning. From a wave standpoint, anything north of the white .618 makes sense. It is slightly higher than the 1914.56 highs (wave 1) last Wednesday.
To reach 1915.36 now, however, means to poke below the purple channel bottom — which might be what they have in mind — just to trap bears who play the breakdown.
UPDATE: 11:05 AM
The purple .236 (1922.18 intersects with the purple channel bottom around 1:15 PM, so this could go on for a while as has occurred several times in the past week.
Rather than babysit it all day, I’m going to call for a long position if USDJPY breaks back above 120.11 and a short position in the event it stays below the SMA100 (the 5-min chart.) In between, I’m neutral — but, the white TL and SMA100 will likely drive the bounces and slides and the many 5-10 point profit opportunities.
 UPDATE: 12:04 PM
SPX just broke below the triangle it’s been in all morning. Looks like it’s setting up for a possible backtest of the lower bound at 1933ish, followed by a drop to 1922.81 around 1:00 – 1:15. UPDATE: 12:48 PM
 USDJPY hasn’t reacted yet, and appears likely to edge a little lower to tag the white TL.
 The top of ES’s rising channel is 125 points or so above — so there’s a long ways to go to get back on track.
 SPX needs 153 points to reach 2076. If it were to happen by 9/8, that would mean 38 points/day, an 8% rise in four sessions. Seems unlikely. But, that’s what the analog suggests.
Re 2138, if it were to happen by Sep 14, that would imply 216 points in 8 sessions: 27 points/day. A little less outrageous.
If I have the wave count right, it would be the 3rd of a 3rd, which would make sense. But, again, don’t assume that it’ll rebound strongly just because the analog says it will. Every analog fails eventually.
And, as we discussed yesterday, this one is a plan. Maybe it works, and maybe it doesn’t. As we saw last night, there will be all sorts of head fakes and overnight surprises. Use stops, and be especially cautious about open positions overnight. UPDATE: 2:40 PM
SPX bounced nicely from 1922, then reversed and dipped lower — reaching as low as 1917.44 before climbing back into the purple channel once again. As discussed above, I wouldn’t be surprised if it closed at 1915.36 or even lower (down to the red channel .236 at 1909ish) as a bear trap.
Remember, if the very thought of either option makes you queasy, there’s nothing wrong with going to cash. I show us up over 2% on the day, which is not a bad day’s work.
UPDATE: 3:30 PM
SPX just tagged the .618 at 1915.36. This would be the most natural place for a bounce, so I’ll prepare to go long between here and 1908.78. All the above caveats still apply.
UPDATE: 3:45 PM

Comments
3 responses to “Charts I’m Watching: Sep 1, 2015”
I wonder if Draghi might be the one that pulls a rabbit out of his hat. someone is going to do something soon – so lots of sleepless nights
Definitely has that potential. All in all, things look rather bleak. Now, will that impression move the BoJ? I think it’s very much a carrot and stick situation. Devalue the yen, and we’ll take care of you (lower oil, etc.) If you don’t, well…just look how messy things could get.
CB’s definitely came out in force to jack up the Yen but it doesn’t seem to be holding. Also note out on ZH that S. Korea published very poor export results. Should make tonight’s Asia session even more precarious than last night. That in turn should spill over to tomorrow’s Europe and US Sessions. This downdraft has the potential to last a few days.