

In our last update on BTC [see: Dec 5 Update] we noted that BTC had briefly dipped below our 46,000 target and was due for a backtest.
I would expect a bounce up to backtest at least the black dashed line (51,766ish) or even the cloud bottom (54,850.) If those (now) resistance levels hold, then the next targets remain to the downside…
As it turned out, BTC’s bounce took it to 51,991, whereupon it obliged us with a backtest of the black line and began sliding to new lows. It is now off over 40% since our short call on Nov 8 [see: Out of Sync.]
While bitcoin bulls are as buoyant as ever, our charts now suggest even more downside than before.
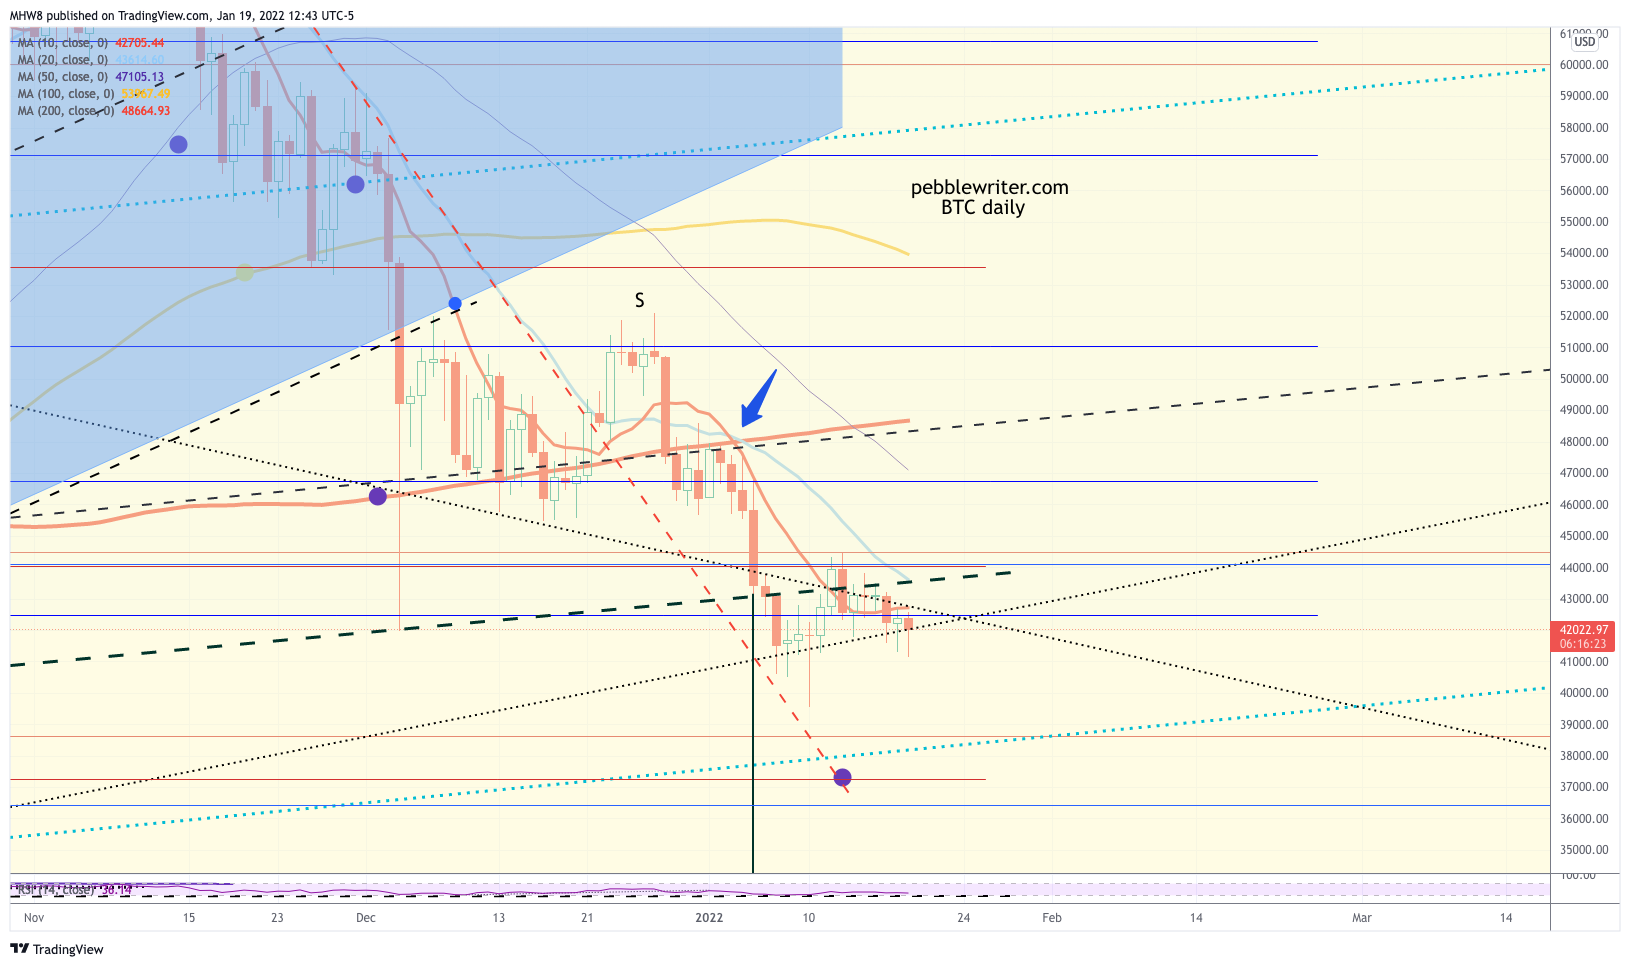
 continued for members…First, note the Jan 3 death cross where the SMA50 dropped through the SMA200 (the blue arrow.) If the bulls were truly in charge, this would have been cause for a prompt reversal.
Note also that BTC completed a large H&S Pattern on Jan 5. BTC briefly ticked above the dashed black neckline on Jan 12, but fell back below it the very next day and has failed every subsequent attempt – remaining below its SMA10 as well.
BTC will have two opportunities to rebound at the red .786 Fib (37,245) and the .886 (33,205.) Should these fail, then only one last level of support remains in the way of a complete breakdown.
Unless someone comes to the rescue, the implication is that BTC will follow its test of the blue .618 Fib on July 21, 2021 with a test of the blue .786 at 17,792 or even the .886 at 11,277. Note that the H&S Pattern targets 15,277, not far from the .786. 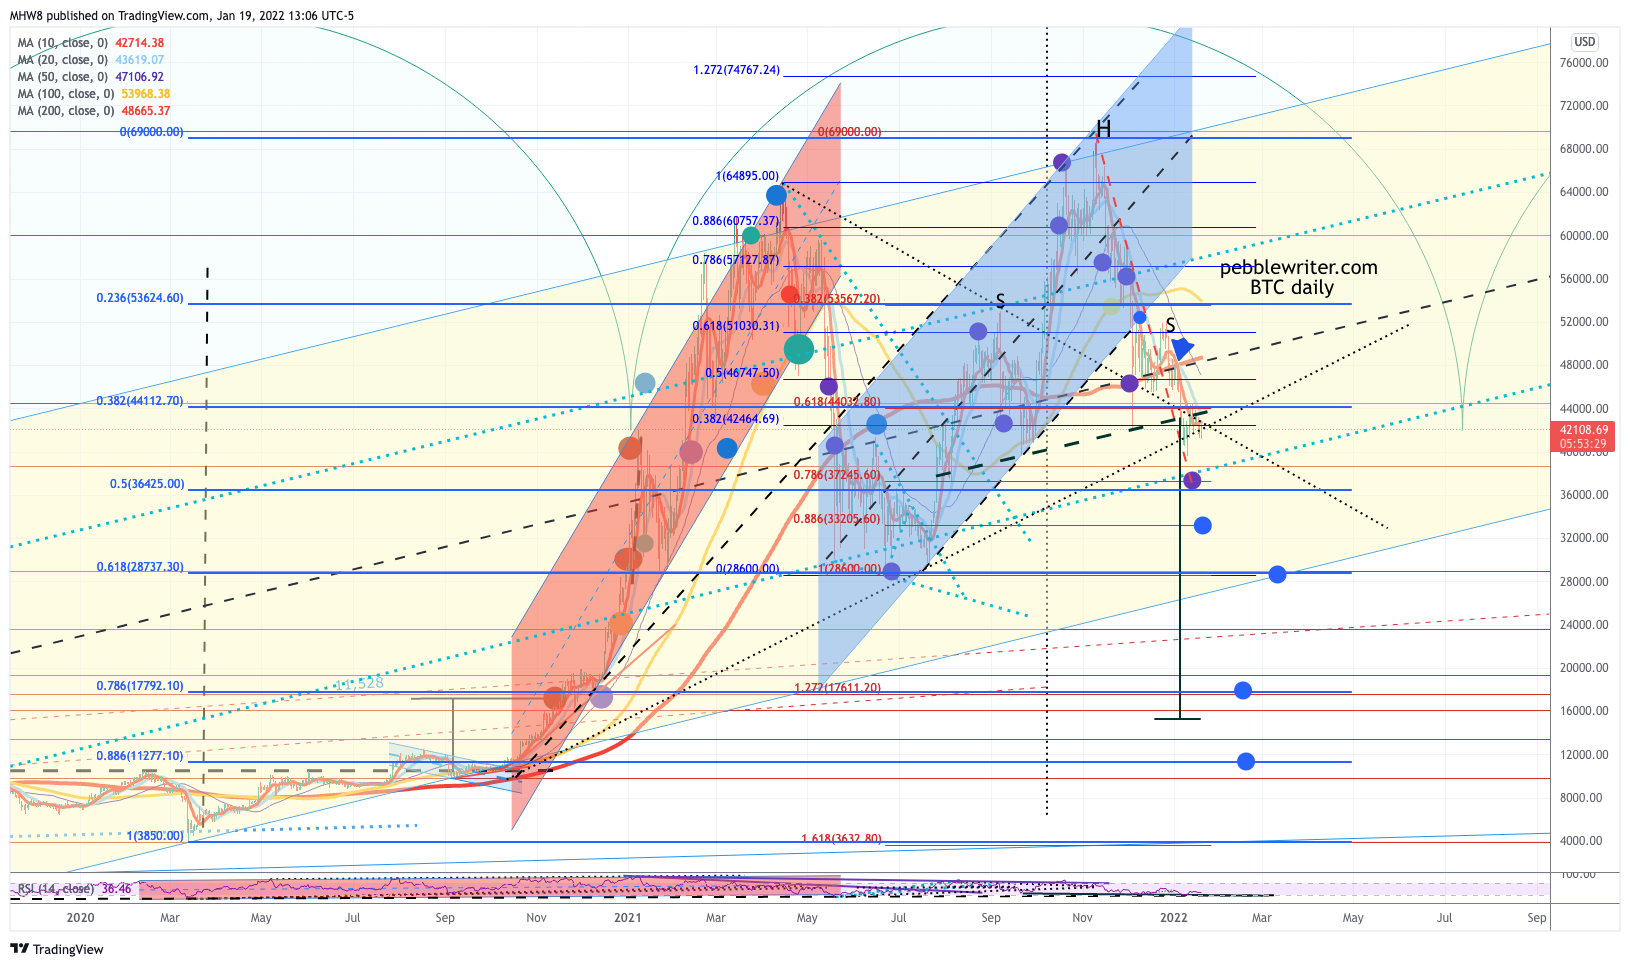 The RSI chart continues to support this view.
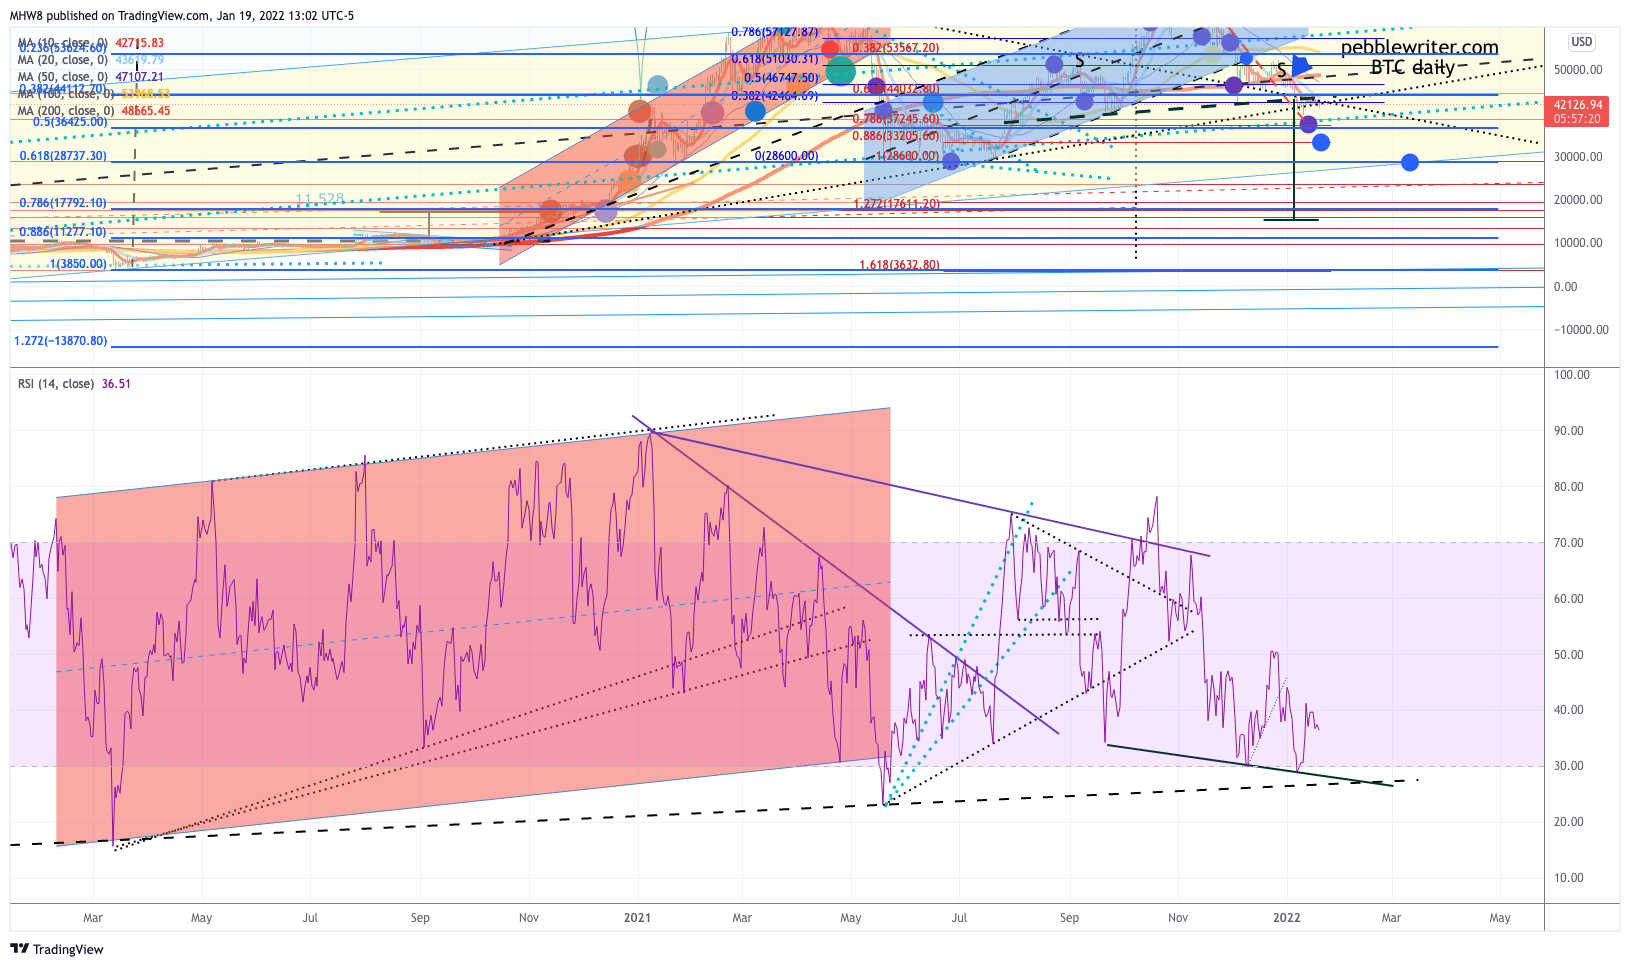 This would obviously mean a breakdown of the rising yellow channel and a drop of roughly 53,700 from the 69,000 highs in November 2021.
If BTC can push back above its neckline and SMA10, then all is well. But, if it can’t, look out below.