

I’ve made no secret of the fact that I expect a rate hike in September. Investors are weary of the drip, drip, drip of slightly higher indices, and SPX is very much in need of a backtest of the critical Fib at 2138. In fact, I’ve had a 2138 target on Sep 12 ever since August 19 [see: The Big Picture.]
We’ve talked about the importance to the Fed of maintaining a high US dollar. It’s been painfully obvious from all DX’s stick saves over the past two weeks.  Without a high dollar, we’d have more noticeable inflation. More noticeable inflation would raise too many inconvenient questions about the Fed’s easy money policy — which has been sold as the very solution to low inflation (as readers have known for years, its real purpose is to re-inflate asset prices.)
That’s why a September rate increase which prompts a temporary decline to backtest 2138 — the biggest decline since Brexit at a whopping (sarc) 2.5% — makes so much sense.
Or…is that simply what the Fed is trying to have investors believe? We all know about open market operations; what about psychological operations? With the US dollar back above its resistance zone through jawboning alone, is an increase still necessary? What if SPX reaches 2138 today?

We remain short from Wednesday afternoon.
continued for members…
I’ll post a few charts, then come back to discuss them.
Futures are off about 12 points — about halfway to the 2136 (SPX 2138) target.
 The Nikkei has is still trending sideways after breaking down from the rising white TL. Looks like it could use a backtest of the red TL.
CL has inexplicably fallen after a modest bump following the huge inventory beats from API and EIA.

EURUSD is still struggling to not break out.
VIX has held the white TL/fan line fairly consistently. It has TL resistance at 14.14.
 SPX should start around the purple channel bottom and work its way down from there. The purple SMA50 (2162.69), purple .786 at 2157.47 and purple .886 at 2152.85 are all potential bounce spots.
The wild card in all this is USDJPY. Its bounce at the white .618 at 101.36 was to be expected. It was also the SMA20. The reason it’s still going up, though, is to support DX which got creamed yesterday by the euro’s strength. EURUSD reached important overhead resistance.
Had it broken out (which it should have, given the ECB failed to expand QE) DX would surely have broken down below its rising white channel, which would be counter to the Fed’s goals.
 Having DX break out above its falling white channel and resistance zone meant USDJPY had to pick up the slack for EURUSD. USDJPY broke out of the falling white channel and through the SMA10 and SMA50.
 So, the closest overhead resistance, now, is at 103.18, followed by the red channel top at 103.62. Remember, the red channel top has a long history of limiting breakouts. I firmly believe the BoJ doesn’t want the yen to weaken any further — especially with oil at these lofty levels.
What they do want, desperately, is for the Nikkei not to decline any further. It’s clinging to the recently acquired SMA200, and they’d probably like it to stay right there or higher. Consider that NKD is currently off 0.17% on this, the single worst opening since Brexit.
With all that charting out of the way, let’s talk about psyops. If SPX can backtest 2138 on threats of a hike and get a nice bounce on whatever good news comes along (CL rebound off its white channel?), then the Fed might take a chance in September. But, they won’t do it if SPX is hanging around 2138. It’s too risky.
If this morning’s dump is reversed in one of those V-shaped recoveries we’ve all come to know and love, and SPX runs up to 2200 by Sep 21, then the Fed will almost certainly raise rates. That will prompt the 2138 dump. And, given how well TPTB contained the fallout from Brexit (so far), holding 2138 shouldn’t be that difficult.
UPDATE: 9:40 AM
There’s the SMA50 at 2162.69. We could get a bounce here to backtest the rising purple channel.
UPDATE: 10:10 AM
SPX dropped through the SMA50, so the next potential support is its .786 here at 2157.47. I think it’ll probably overshoot it, as ES has an .886 a little lower at 2147.20.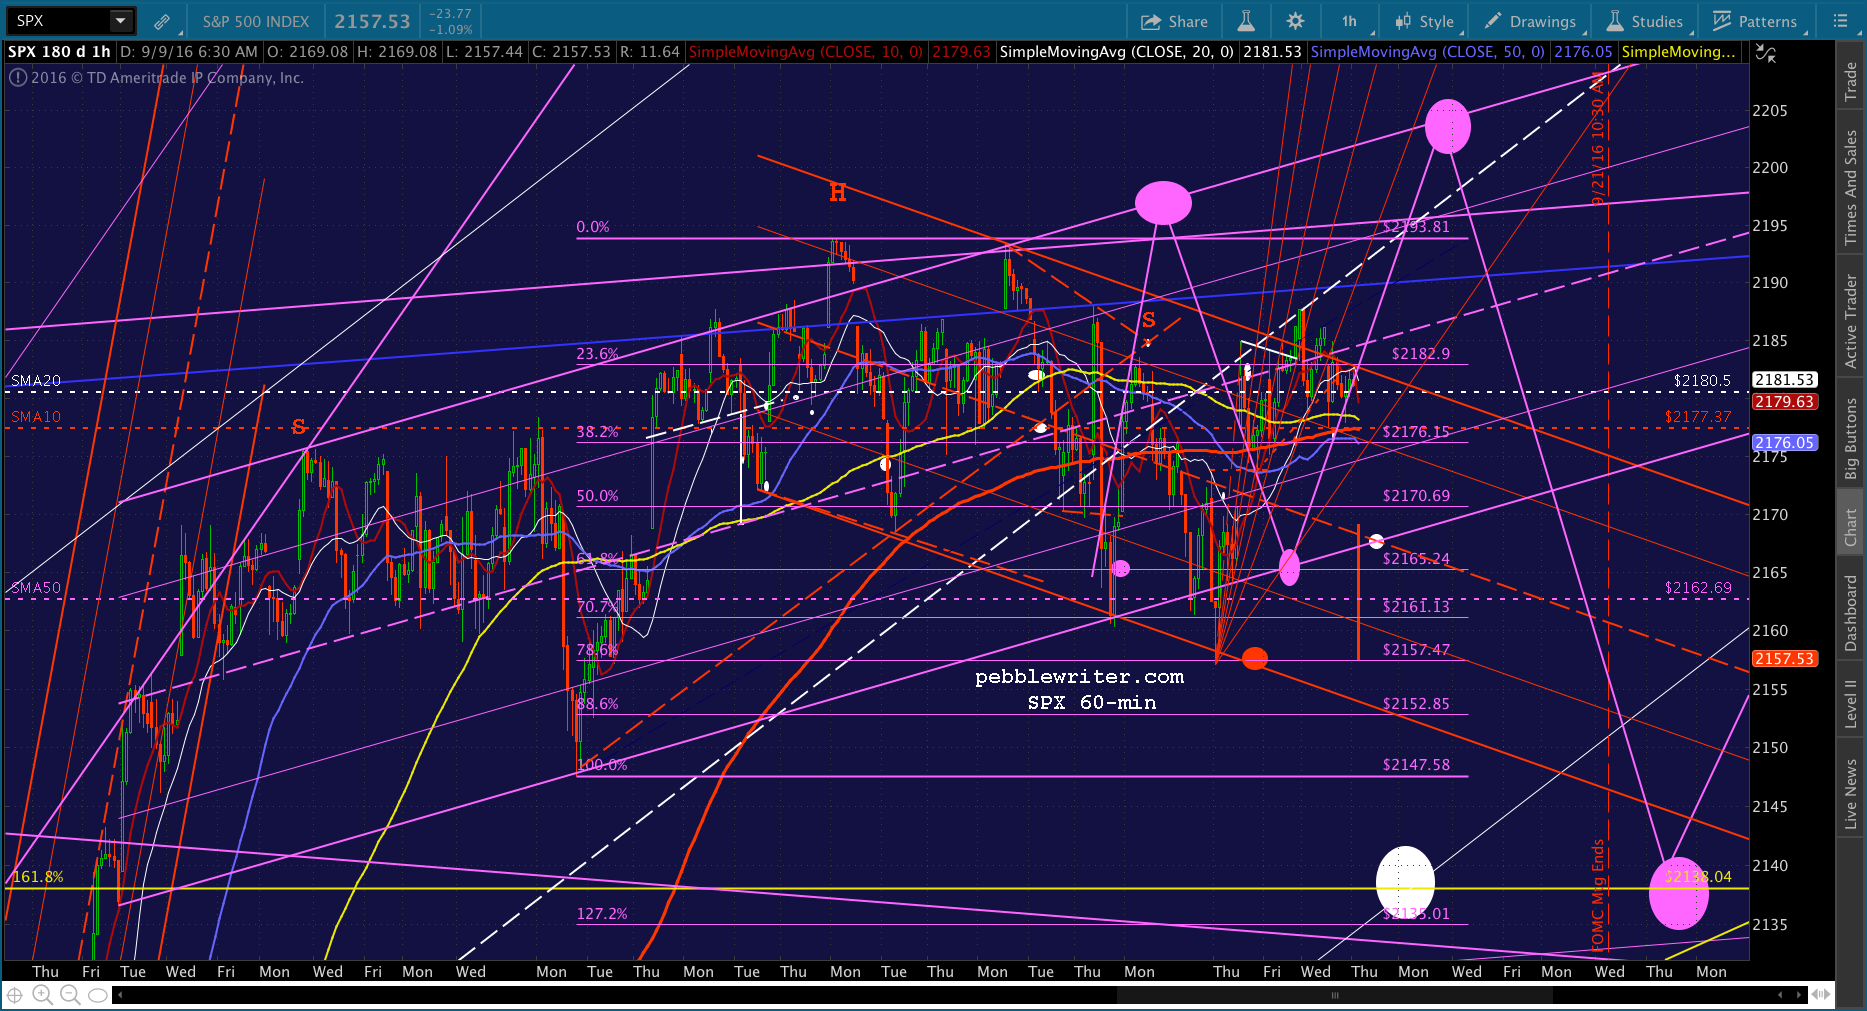

Note that DX has reached the midline of the huge white channel it’s been in since Jan 2015. It should back off, here, meaning that USDJPY should too.
This is how BoJ signals that it’s okay for USDJPY to drop a little.
UPDATE: 10:39 AM
SPX just reached our falling red channel bottom at 2154.05. I’d take profits here on our short. ES slightly overshot its .886, and is rebounding back above it. Obviously, SPX could dribble on down to tag its own .886.
I suspect it’ll bounce around, first, and maybe do it at the close — giving ES a chance to close above 2147.20. But, who knows? Nothing wrong with playing the bounce. But, there are likely to be a lot of head fakes over the next five hours. And, obviously, reshort on any sustained drop below 2142.85 — and, for sure, below 2147.58.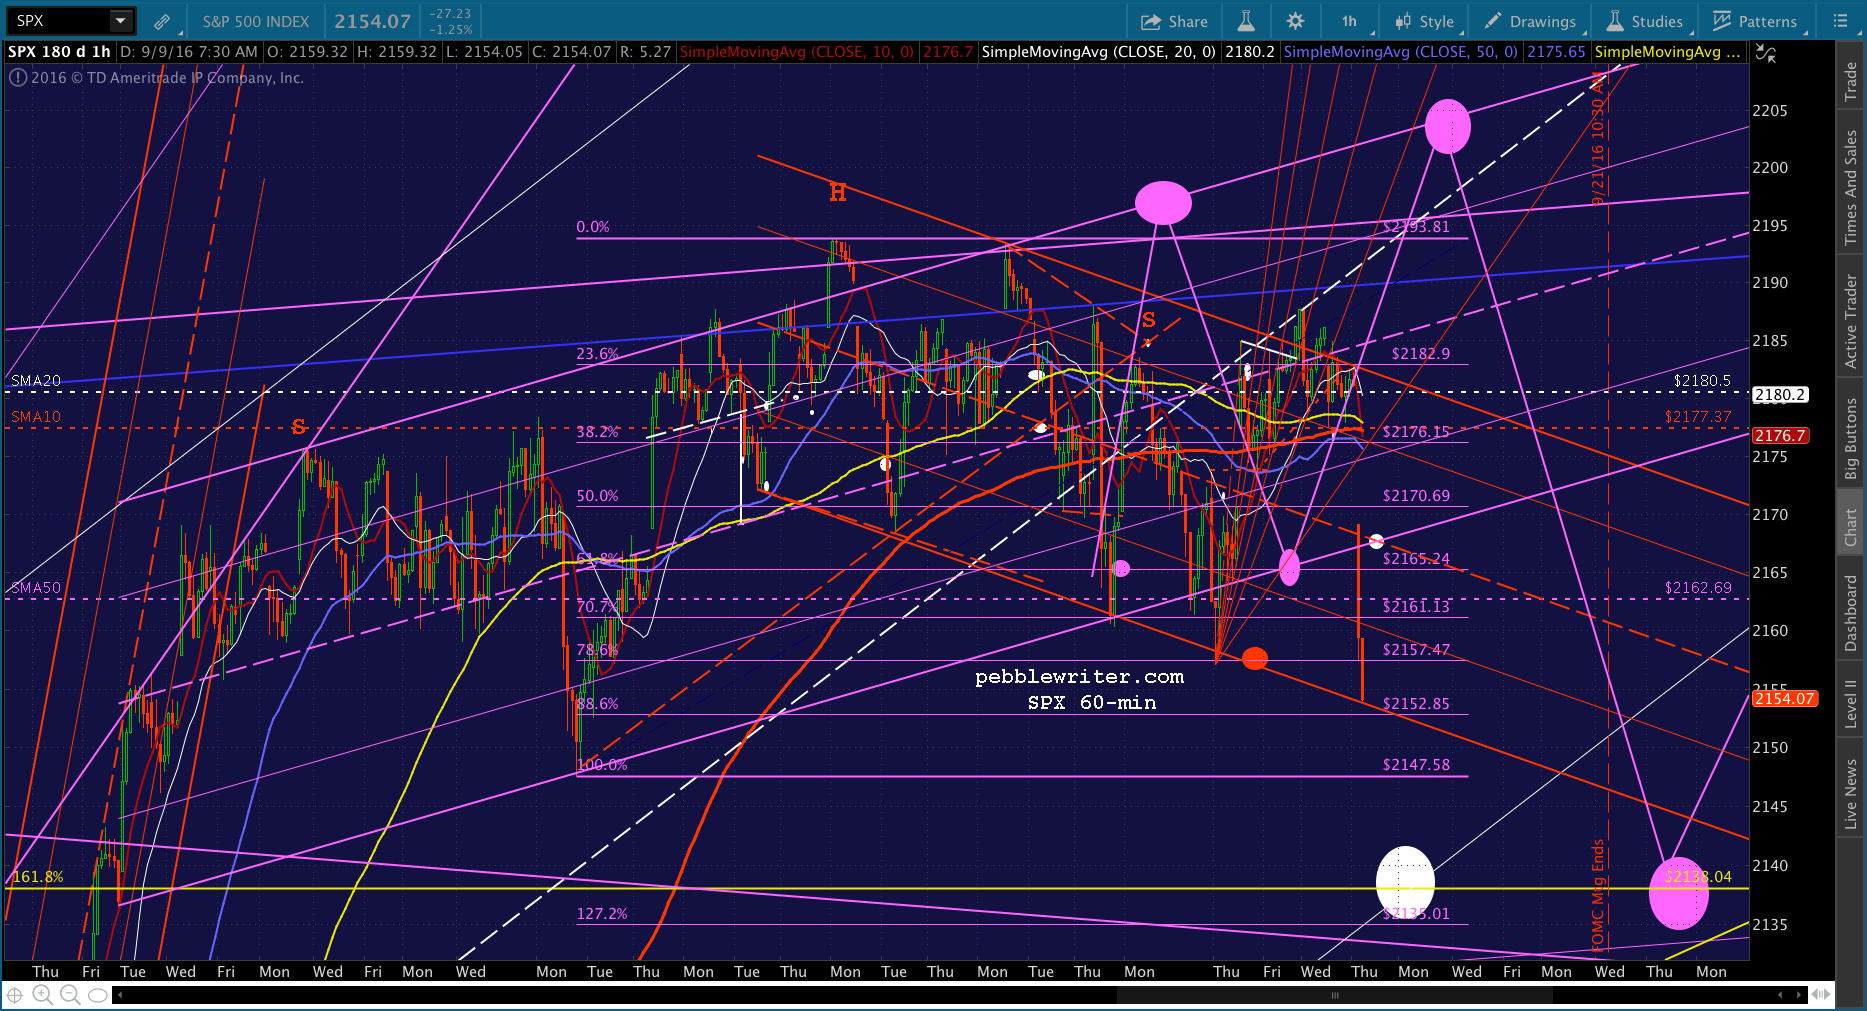

VIX has retraced .886 ofits latest drop… …and, USDJPY is making noises about holding a backtest of the falling white channel.
UPDATE: 11:50 AM
SPX just tagged its .886. Could get a bigger bounce here. Again, a sustained drop through 2152.85 is reason to go short.

UPDATE: 11:53 AM
Dropping through the .886. Back to short with tight stops. It still makes more sense to wait until the close or Monday to tag 2138. We have a dovish Fed Prez Lael Brainard speaking Monday morning, and it could be the boost that’s needed to turn things around.

UPDATE: 12:18 PM
VIX just topped August’s highs, meaning it’s probably heading to the white channel midline up around 16. There’s a yellow 1.272 at 15.79, a red 1.618 at 16.23 and a purple .382 at 16.89 all in the vicinity. The daily SMA200 is slightly higher at 16.69.
Odds are well get a push up to the white channel midline at 16ish, and then an overshoot to 16.69 if necessary to complete the backtest of 2138.


This enabled ES to break below its Aug 2 lows. SPX is still slightly above its — for now. The other catalyst: CL, which is about to break below its SMA100.
I meant to mention this earlier, but the price differential between ES and SPX has shifted since I first posted the SPX 2138 equivalent on ES’ chart last week. It’s now about 2130. In the interest of fine tuning, note that SPX’s May 2015 high came in just shy of 2138 at 2134.72.
It turns out that 2134.72 is awfully darned close to SPX’s purple 1.272 at 2135.01. As everyone knows, the 1.272 extension is the most common target for Butterfly Patterns, which initially reverse at their .786 Fib. In this case, SPX did reverse at the .786 last Thursday.
This adds weight to the argument for a drop to SPX 2135ish rather than 2138. This would be about 2127 on ES, very close to its purple 1.272 at 2127.90.


UPDATE: 1:11 PM
Since it appears we’re likely to reach 2134-2138 today, this does alter the rate hike picture. If SPX does reverse mildly off 2134-2138, or close at those levels, then I think it’s fairly likely that Brainard would come out and crap all over the idea of a rate hike on Monday.
With seven sessions before the FOMC rate decision on Sep 21 and lots of economic data coming out in the interim (not to mention the usual oil, VIX and USDJPY manipulation), there are plenty of opportunities to manufacture a bounce.

How vigorous that bounce is will determine whether the Fed raises rates. They limited the Brexit fallout (arguably a much bigger deal) to 120 points. If they could get SPX back up to 2208, then limit the fallout to, say 2143-2162, I think they’ve give it a shot. If they can only get SPX back up to 2171 (a backtest of the broken purple channel) or 2181 (gap close and top of the falling red channel) then they’re much less likely to take the chance.
We’ve heard Feds say it a million times. They are data dependent. It’s just that the data they depend on… is the price of the SPX.
Putting the above on a chart, it might look something like this:

The fact that this drop is happening midday, with several hours to go before the close, gives me a little more confidence.
BTW, VIX just popped above the white midline to tag the red 1.618 at 16.23, and SPX is noticing. Looks like VIX might very well reach its SMA200 at 16.69.
UPDATE: 2:04 PM
Just tagged 2138. Watching to see if 2135 is on tap. I believe it is. ES hasn’t reached its 1.272 either, and VIX can still strengthen up to 16.69 or 16.89.


UPDATE: 2:15 PM
SPX just dropped through 2138 and is just above the 1.272 target at 2135.01. ES has already tagged its 1.272, and VIX just tagged its SMA200, so this is probably close enough. I’d take profits on the short and revert to long. There’s still almost 2 hours before the close, so there’s plenty of time for a rebound. I’d keep stops relatively loose, as we could lose a few more points first just to screw over all the Elliott Wavers out there.


Here’s a look at the 60-min version, a close-up…
…and, with some perspective. Note SPX has tagged the rising white channel’s .236 line as well as backtested both the falling purple channel top and, most importantly, the May 2015 high (aka the 1.618 extension of the 2007 – 2009 drop.) I can’t emphasize enough: this is critically important support.

There could be plenty of games played with traders in this range. For instance, the SMA100 is down at 2120. But, it is essential for bulls to hold this price level.
For those watching VIX, note that the Sep 21 puts with a strike price of 15 are now trading at 1.00.
UPDATE: 3:43 PM
With 15 minutes to go, SPX just dipped to 2134. Obviously, the Fed could fumble the ball next week, and the week after. If these prices don’t hold, then things would get very ugly very fast. As always, only hold long over the weekend if you can handle a gap lower or can hedge your position.

Comments
8 responses to “Psyops and the FOMC”
Amazing work!
Thanks, Tim!
PW, is it just me? The content from your post earlier disappeared.
Thanks for the heads up, Tommy. It should be back, now.
You are welcome. Btw, utilities stocks and high dividend stocks get hammered today. Perhaps TPTB are readers of yours and pricing in for a rate increase.
Ha-ha! I have my own thoughts about that!
Which rising purple channel?
It’s the one rising up through the 60-min SPX chart above. It’s been the central feature of SPX’s movements since Jul 11.