Tag: DXY

  • PPI Disappoints

    The producer price index missed this morning, coming in at -0.2% versus consensus and prior read of +0.4%. Core also missed at -0.3% versus consensus of +0.1%. Although the market has certainly staged a V-shaped recovery, someone forgot to check with the economy.

    Not to worry, because Gilead was quickly out with a press release reiterating the virtues of Remdesivir. The algos like this kind of stuff, especially when faced with otherwise depressing headlines.

    More importantly, VIX took a well-timed dive to just below its 10-DMA. The algos love this kind of stuff, and suddenly futures are back in the green.

    Don’t get too excited. It won’t last.

    continued for members(more…)

  • Nothing New

    Another VIX-inspired, holiday weekend ramp in the futures in the face of dismal headlines… What a shock. Not.

    continued for members(more…)

  • VIX’s Important Test

    Futures are up sharply on a better than expected jobs report: up 4.8 million, and the unemployment rate dropping to 11.1%. Initial claims came in at 1.43 million, with continuing claims rising slightly to 19.3 million.

    The direction didn’t surprise anyone, but the numbers surprised most. The reopening of most of the country over the past month has produced the desired results. It remains to be seen whether the spike in coronavirus cases in half the country will put a dent in the trend.

    Back on June 12 [see: Is it Safe?], we alerted members to a development in VIX, which had recently broken out of a falling channel from March and was nearing a 10/20 cross.

    It’s tough to see on the chart above, but VIX’s SMA10 was just about to cross above its SMA20 – a bullish sign for VIX and bearish one for stocks. If VIX is hammered today, the bullish cross can be avoided. If stocks’ meltup is to resume, we could still see VIX backtest its broken white channel or the yellow trend line off the 2018 lows which is nearing the SMA200 currently at 24.89.

    As it turned out, that’s exactly what happened. After the jobs numbers this morning, VIX tumbled to tag its SMA200 and the yellow trend line from the 2018 lows. This completes a 42% drop which produced a 200-pt (6.7%) rise in SPX.The big question, of course, is whether this important support will hold.

    continued for members(more…)

  • Charts I’m Watching: Jun 29, 2020

    Futures are up modestly this morning as we glide into the quarter end on a holiday-shortened, low-volume week.  VIX’s triangle perfectly illustrates the technical picture: attempts to break out have been beaten back, while threats to break down have routinely been rebuffed.

    It’s exactly what one would expect when the goal is to maintain positive numbers for the quarter – in the midst of a horrid fundamental backdrop. It’s hard not to look ahead to July, when the calendar offers less support.

    continued for members(more…)

  • Danger Ahead

    Today is a very important day in the markets. The signals that prompted us to short on several days ago are still intact, and more have joined their ranks – the most notable being the breakdown in the 10Y flag pattern.

    ES snuck down and tagged our SMA200 target overnight. To put things simply: If it doesn’t hold, all hell will break loose.There are any number of fundamental reasons for the market to tank, including the spikes in coronavirus cases in many states. Some governors, such as Texas’ Abbott, are even copping to how disastrous the situation has become.Working to prevent a meltdown, of course, are the algo strategies which have been so effective since Mar 23. It should be an interesting next few days.

    continued for members(more…)

  • Another Day, Another Test

    As we slowly make our way toward the end of Q2, we continue to see tests of important support. They are usually followed by sharp bounces despite the growing evidence that a selloff is right around the corner.Will today be the day the market finally takes the plunge?

    continued for members(more…)

  • Charts I’m Watching: Jun 22, 2020

    Futures are off slightly this morning as ES has backtested the channel it meant to break out of on OPEX Friday.  Today marks the beginning of the last seven sessions until the end of Q2 – traditionally a period of flat or rising prices.

    Can the seasonal trend offset the growing list of bearish fundamental and technical factors?

    continued for members(more…)

  • The Holding Pattern

    Futures are heading for another test of the 2.618 Fib extension at 3076.93, the fourth since last pushing above it on Monday.

    There are numerous targets below, but that would mean cooperation from the algos – a rare commodity these days. The bearish case, however, is growing stronger every day.

    continued for members(more…)

  • Powell: What Did I Say!?

    I saw an interesting interview on CNBC this morning where the guest observed how important overnight trading was to the market’s overall performance. Andrew Ross Sorkin offered data that if one bought the S&P 500 at the close of each day of trading and sold at the next morning’s open, they would be up 650% since 1993.  If, instead, they bought at the open and sold at the close, they would be down 3%.

    This observation won’t surprise any of our members, who are well-versed in the market’s increasingly endemic ramp jobs over the past 12 years. So far so good. The problem with the interview came when a rationale for the effect was offered: one should be compensated for taking overnight risk.  Mike Santoli then chipped in, adding another explanation: more news happens outside of market hours than during.  Ugh. And, it was going so well…

    Let’s be clear about one thing: markets are manipulated, and it’s almost always intentional. Sometimes it’s quite obvious and effective, such as the announcement of a enormous new round of QE on March 23. This particular one was ridiculously obvious, as it came at 8am on the day the Dow would complete a 38% crash to test its Nov 9, 2016 lows (the day after the presidential election.)

    The rest of the time, it’s done so discretely that most observers are unaware of the actual machinations. We discuss the whys and wherefores every single day, as understanding the motives and means provides an excellent road map for our forecasts.

    A great example is our VIX chart, which has exhibited an orderly collapse since it reached our Fibonacci .886 target at 80.3 on March 16.The declines most often come in the after-hours, before the cash market opens. This prompts the algos to buy futures, which results in a gap higher on the open as the rest of the machines kick into gear (index funds, ETFs, quants, etc.) The fundamental crowd, which accounts for only 10% of volume, brings up the rear.

    It’s notable then that after bouncing at its 200-DMA and a trend line off its 2018 lows, VIX finally departed from this channel (the yellow arrow above) last night.

    This allowed our favored scenario to play out as described yesterday.

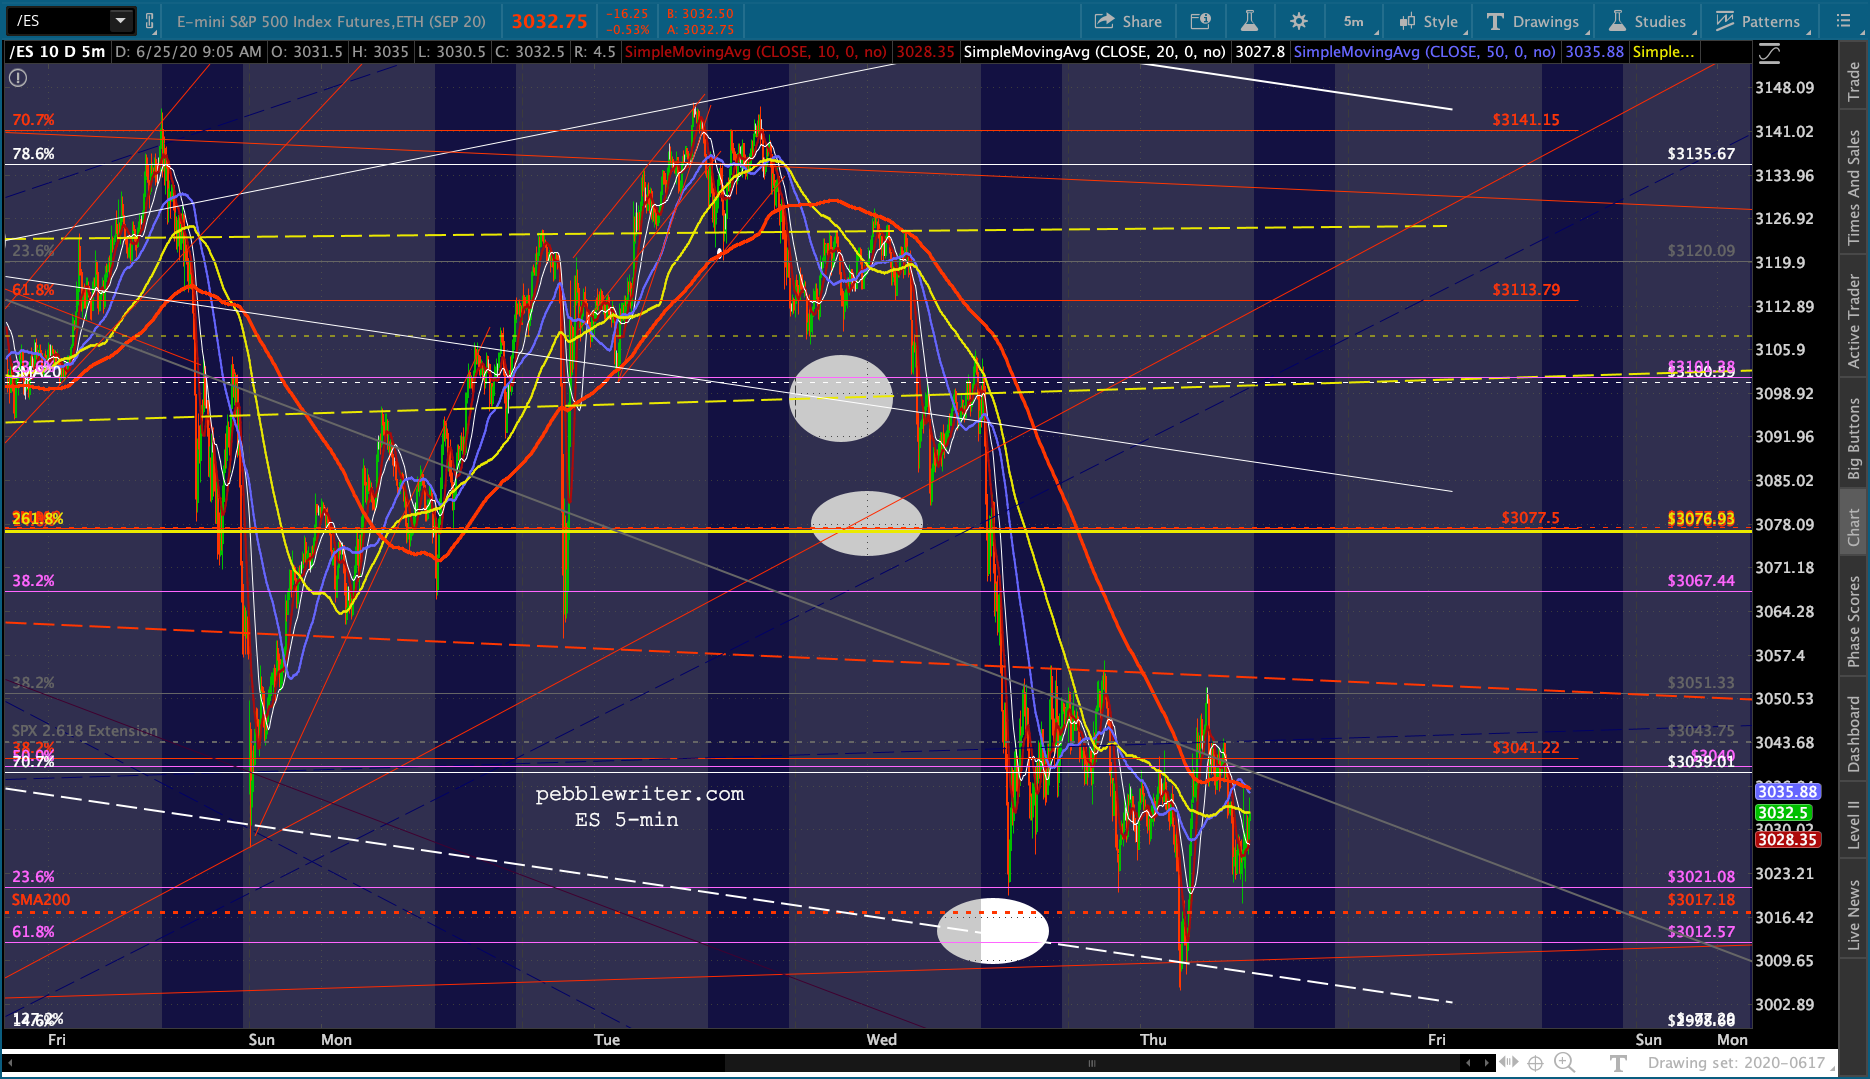
    I’m leaning toward a correction beginning today, but am unsure whether the channel bottoms at ES 3076 and 3122-3135 will hold or not.  It depends a great deal on what Powell says later today.

    Bottom line, Powell’s comments weren’t terribly uplifting as he essentially confirmed that a rebound is not just around the corner. The problem is the fallout from the coronavirus – which the rest of the world is beginning to understand has not gone away — not even with the Fed’s best efforts.

    As to the markets… so far, so good. The key, of course, will be what happens if/when it reaches the 2.618 Fib extension at 3076.93.

    continued for members(more…)

  • Another Yield Curve Warning for Stocks

    Two steps forward…in order to accommodate a big step back.

    We’ve seen it countless times in the lead-up to Fed meetings, GDP reports and, lately, jobs data. With May unemployment expected to top 20% (it’s unofficially already there) after another 7.5 million joined the jobless ranks……the market’s caretakers put a 58-pt cushion into the market.  ES’ 10-day moving average, for instance, is about 87 points below last night’s highs. Had ES instead fallen 87 points from yesterday’s lows, it would mean a risky test of its 200-DMA.

    It’s gratifying to see scores of analysts come to the realization that the markets are being heavily influenced (a more accurate word is manipulated) by massive Fed stimulus. But, as members know, this has been going on for years – particularly as stocks reach key levels of overhead resistance.

    With the Dow finally joining SPX in reaching its 200-DMA on Wednesday and several key components (e.g. AAPL) taking great pains not to break out to new highs, it seemed as though we might get at least a pause in the meltup, maybe even a correction.

    Our yield curve model confirmed it yesterday with the 2s10s breaking out above all recent highs except that seen in late March.Now, we’ll have to wait and see whether the algos, being directed this morning by USDJPY, VIX and CL, are intent on notching new highs or will, temporarily at least, reconcile with the real world.

    continued for members(more…)