UPDATE: 1:50 PM
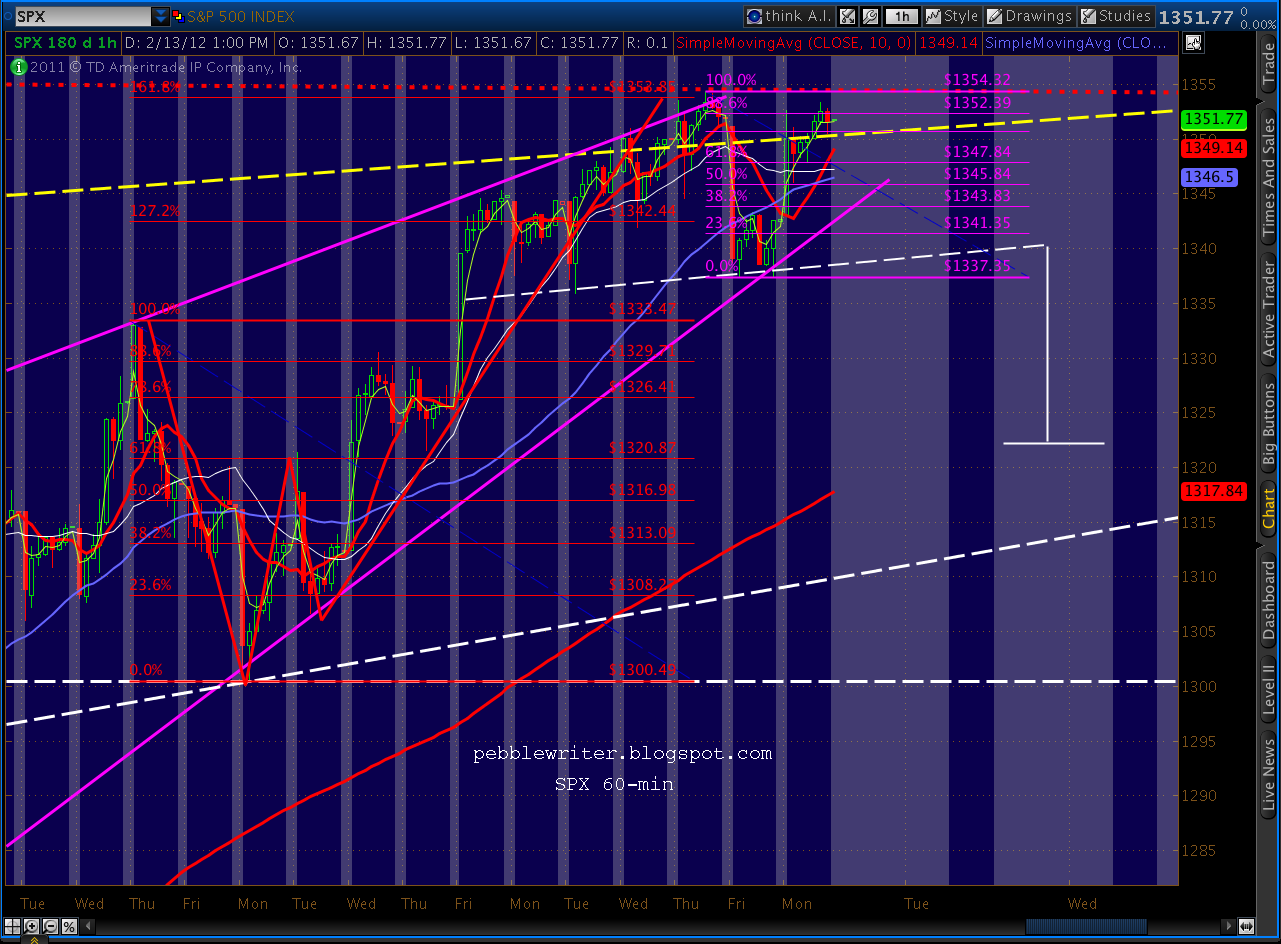
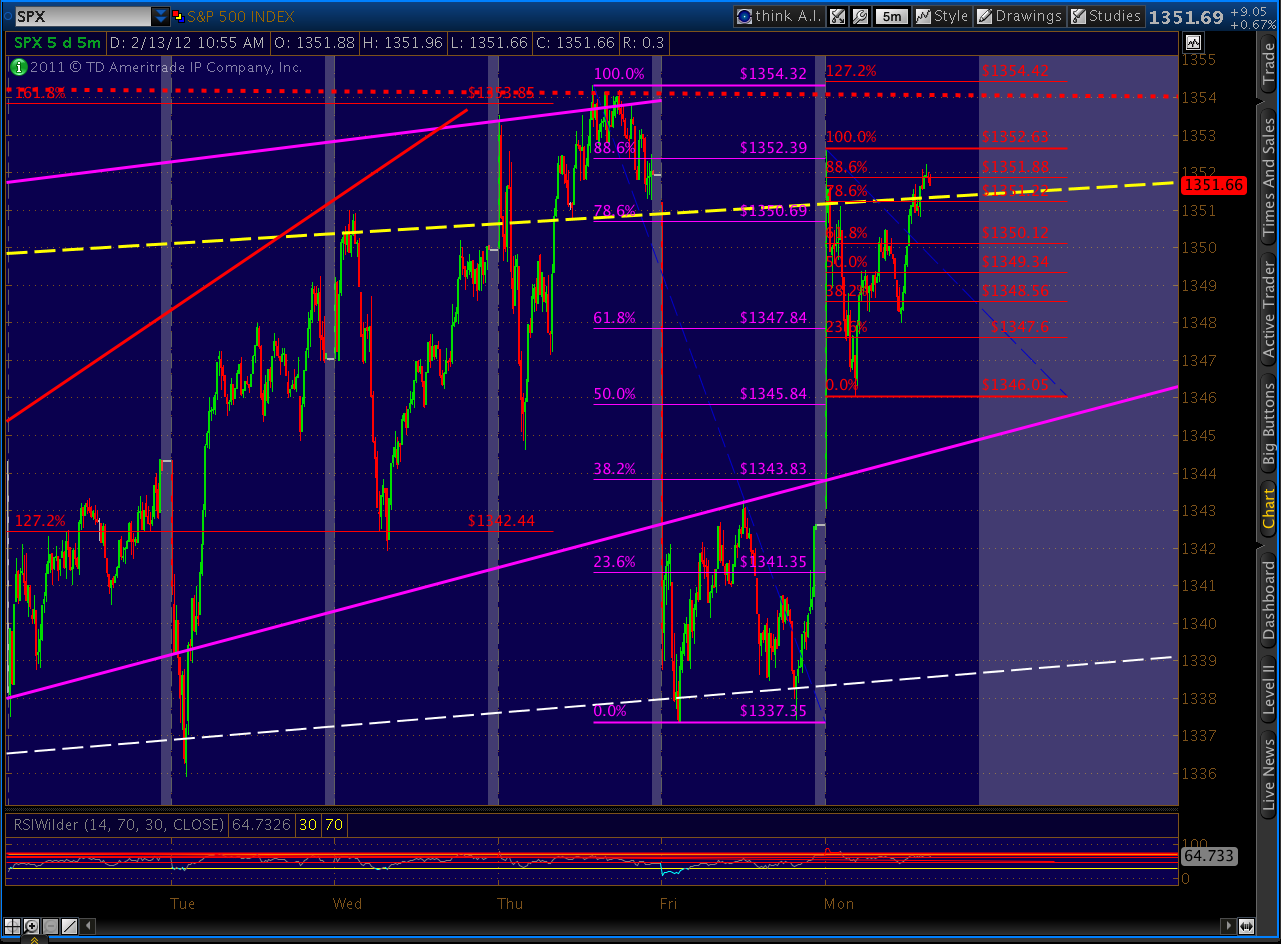
SPX faces a gauntlet of overhead challenges, seen here on the 60-min chart:
Previous High: 1370.58
Inverse H&S;: 1372.00
Butterfly 1.618: 1375.47
Gartley (2007) .786: 1381.50
Rising Wedge Apex: 1392.23

RUT Bat and Crab pattern highs continue to hold.
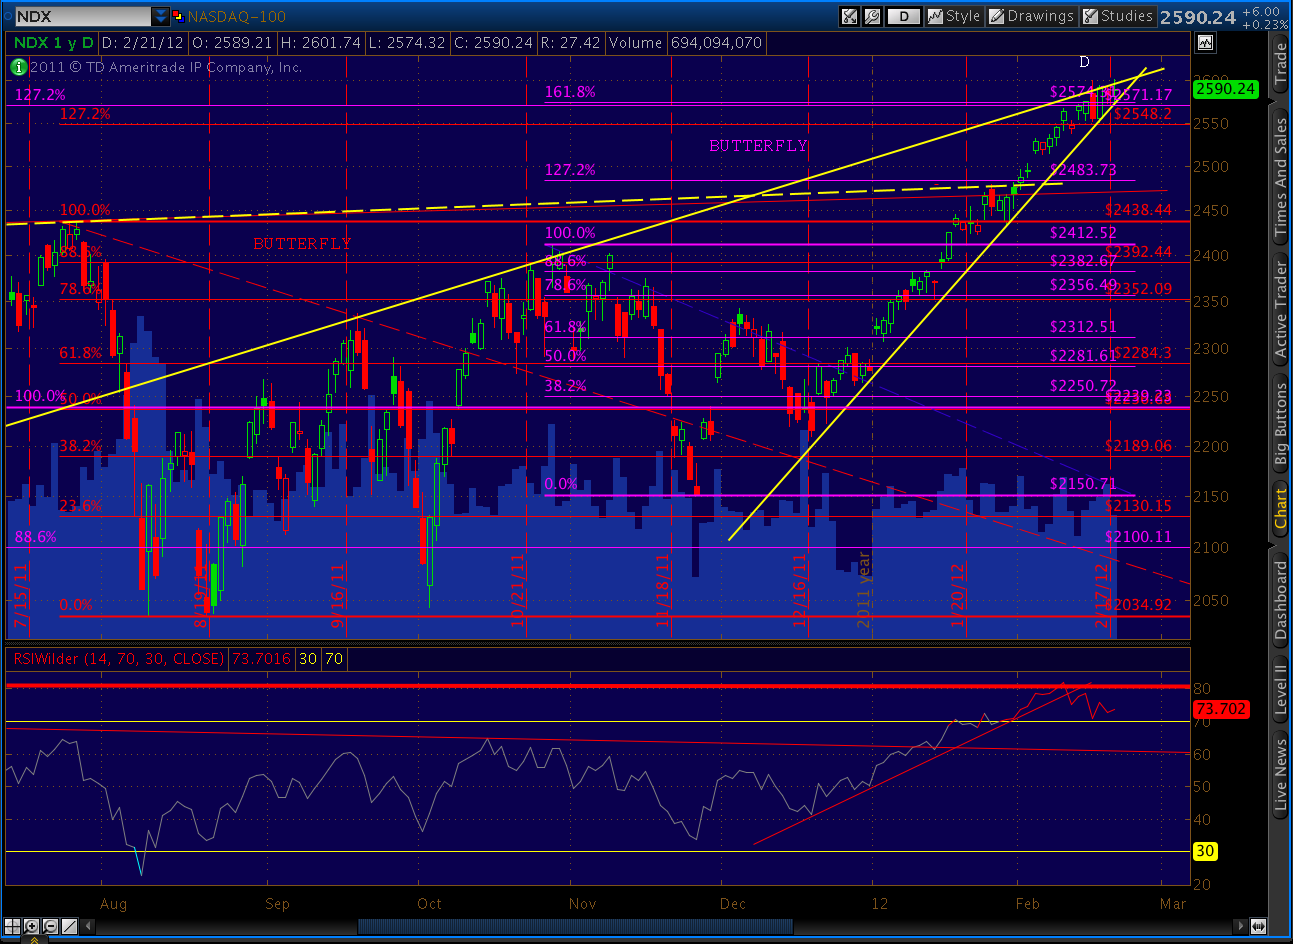
NDX, like just about every other index, spent the past few days churning. Its RSI, also like just about everything else I’m watching, is back testing a broken trend line and is beginning to show negative divergence on the daily chart.
ORIGINAL POST:
At long last, the Greek deal is done. But, there’s lots of hair on the deal, and the market is rightly unimpressed with the futures up a mere 3 points at this writing.
The melt up has the potential to tack on another 12 points in the eminis — with a 1376.85 Butterfly pattern completion up ahead. This is a smidge higher than the May 1373.50 high, so it has the ability to rewrite a lot of Elliott Wave history.
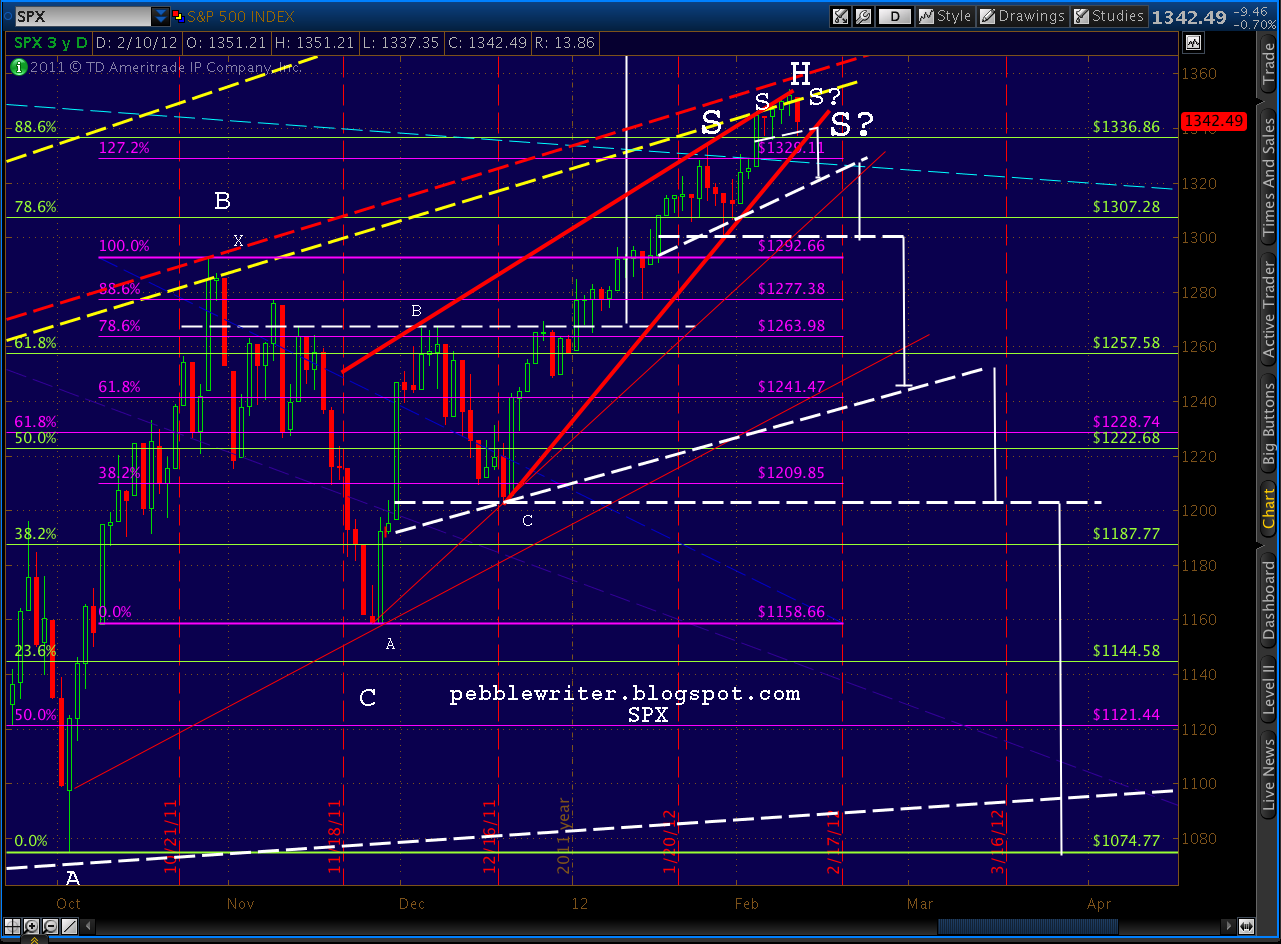
It also roughly coincides with the most generous rising wedge I can draw — not to mention the inverse H&S; pattern. First, the big picture:

And, a little closer look:

The rising wedge formed with the fan line from Mar 09 is obvious (though I never thought it would grow to include the Oct 27 aberration.) It also has a lot of open space near its upper bound, making it look a bit hinky.
Drawing a tighter upper bound (purple line) looks a little better, but it also looks a little less ominous. So, pick your poison. I think the Butterfly will spell a reversal, especially given that it’s in such close proximity to the previous high.

Just like SPX, the eminis didn’t quite reach their Gartley target at the .786 Fib level of 1389.66 back in May. If, for whatever reason, we should overshoot the double top at 1373.5 or the Butterfly at 1376.85, then the original Gartley level should produce a strong reversal.

The corresponding values for SPX are shown in the chart below:
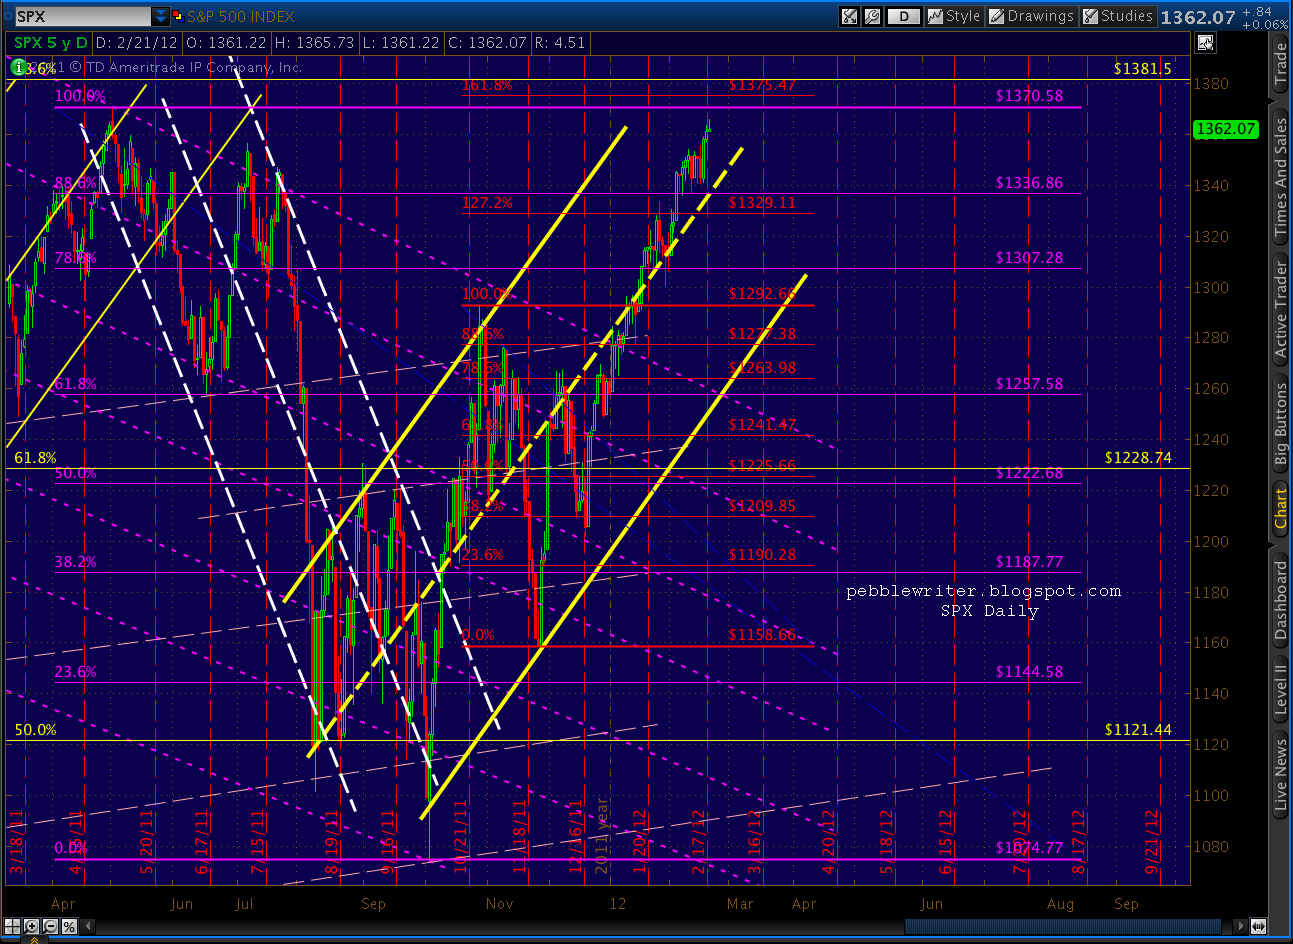
Note that they’re a little more compressed in SPX, and that we’re already within striking distance of any of the three — close enough, in fact, that this rally could fizzle at any time.
Go back and study 2007. Remember the 90’s bull market finally topped out at 1552.87 in March of 2000. And, though there were plenty of reasons for the market not to make it back there after plunging to 768, by October 2007 it came back to 1576.09 — 23 points higher than in 2000.
Then, as now, the majority of analysts saw besting the old high as a clear sign of higher prices to come. Of course, we ended up with a lower low, shedding 58% in the next 17 months.
What I’m trying to say is, the bear case is not dashed if we exceed 1370. We have two other very strong causes for a reversal waiting in the wings. And, the commonly accepted EW count can be dead wrong without it meaning we should ignore the crumbling global economic picture, not to mention all these bearish chart patterns, and suddenly turn bullish.
More later.