Strange things have happened around holidays this past year. Though this is a short day (equity markets close at 1pm EST) it’s best to remain vigilant. Equity futures have recovered most of their overnight losses, and TPTB would love nothing more than to undo the gains we’ve racked up (since shorting on the 18th) while no one’s looking.
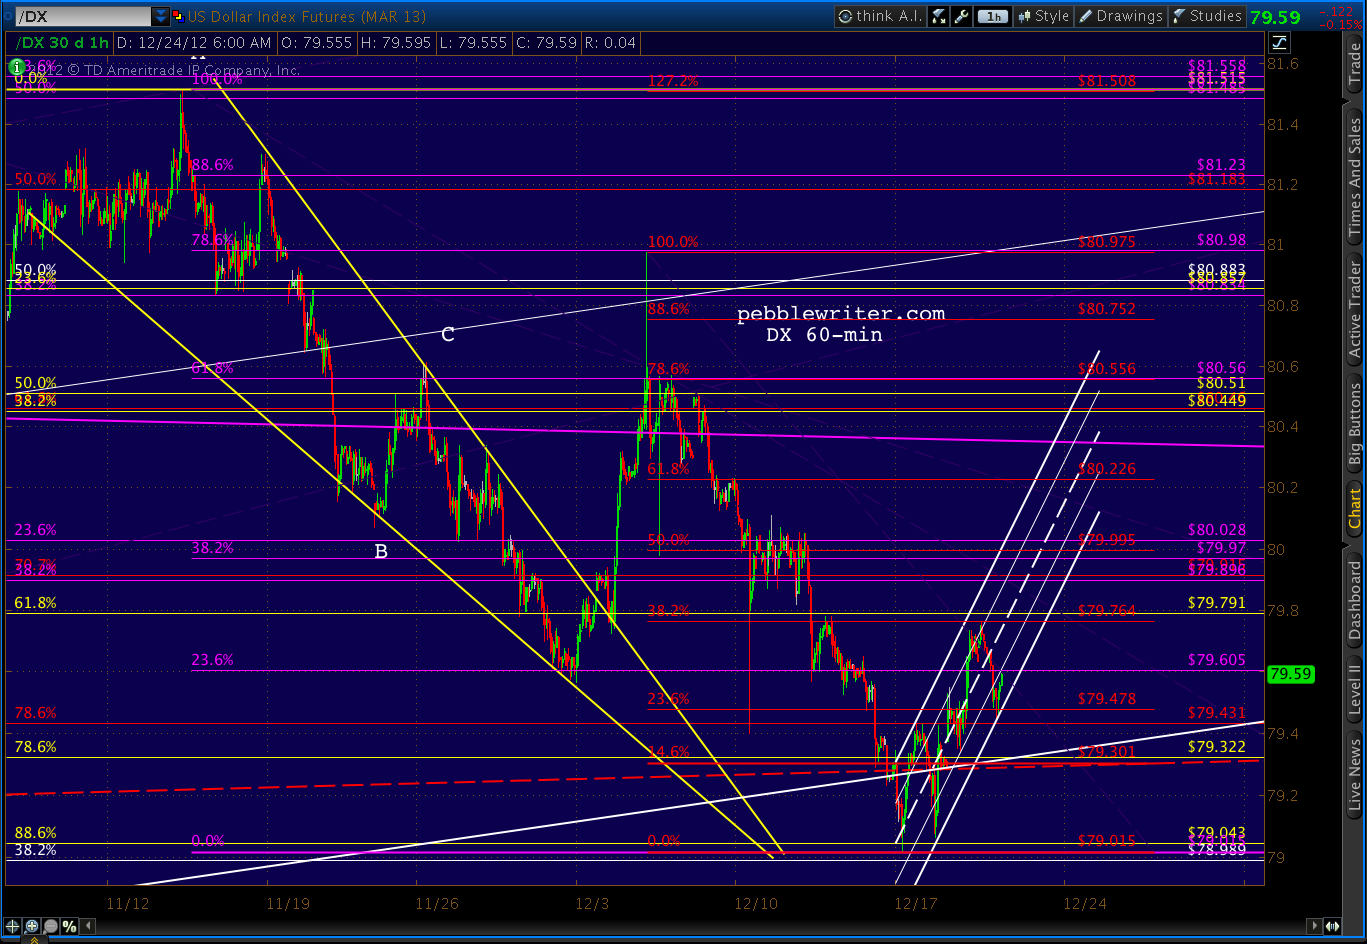
Keep an eye on the proposed channel for the dollar for any signs of weakness…
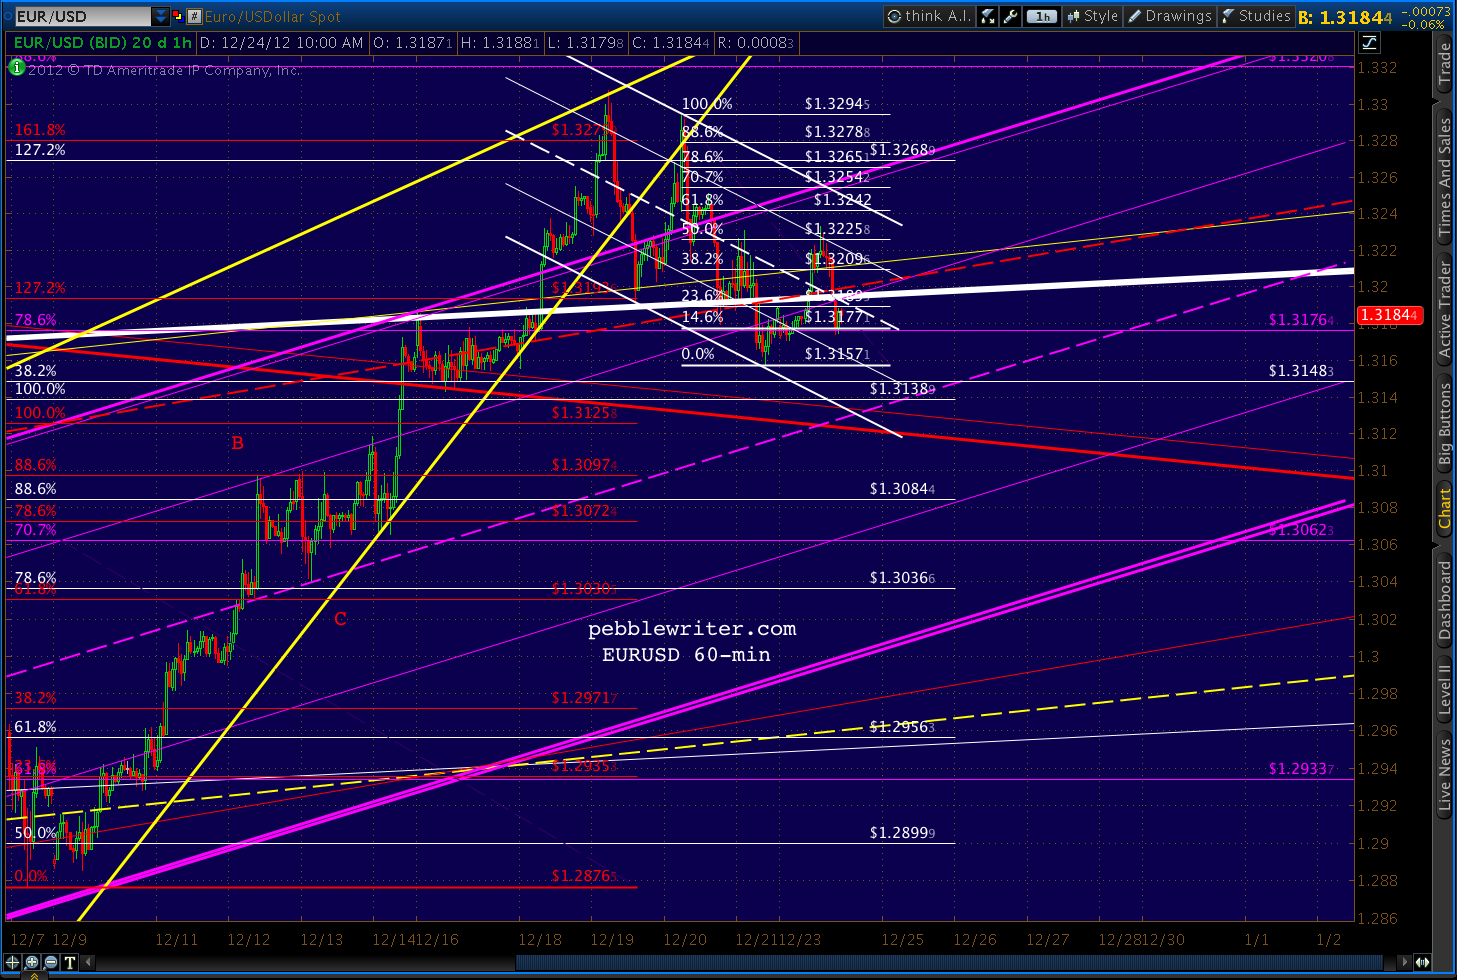
 …as well as the EURUSD, which is trying to stage a comeback. A move through 1.3232 would signal 1.3265 — 1.3238.
 UPDATE: 10:15 AM
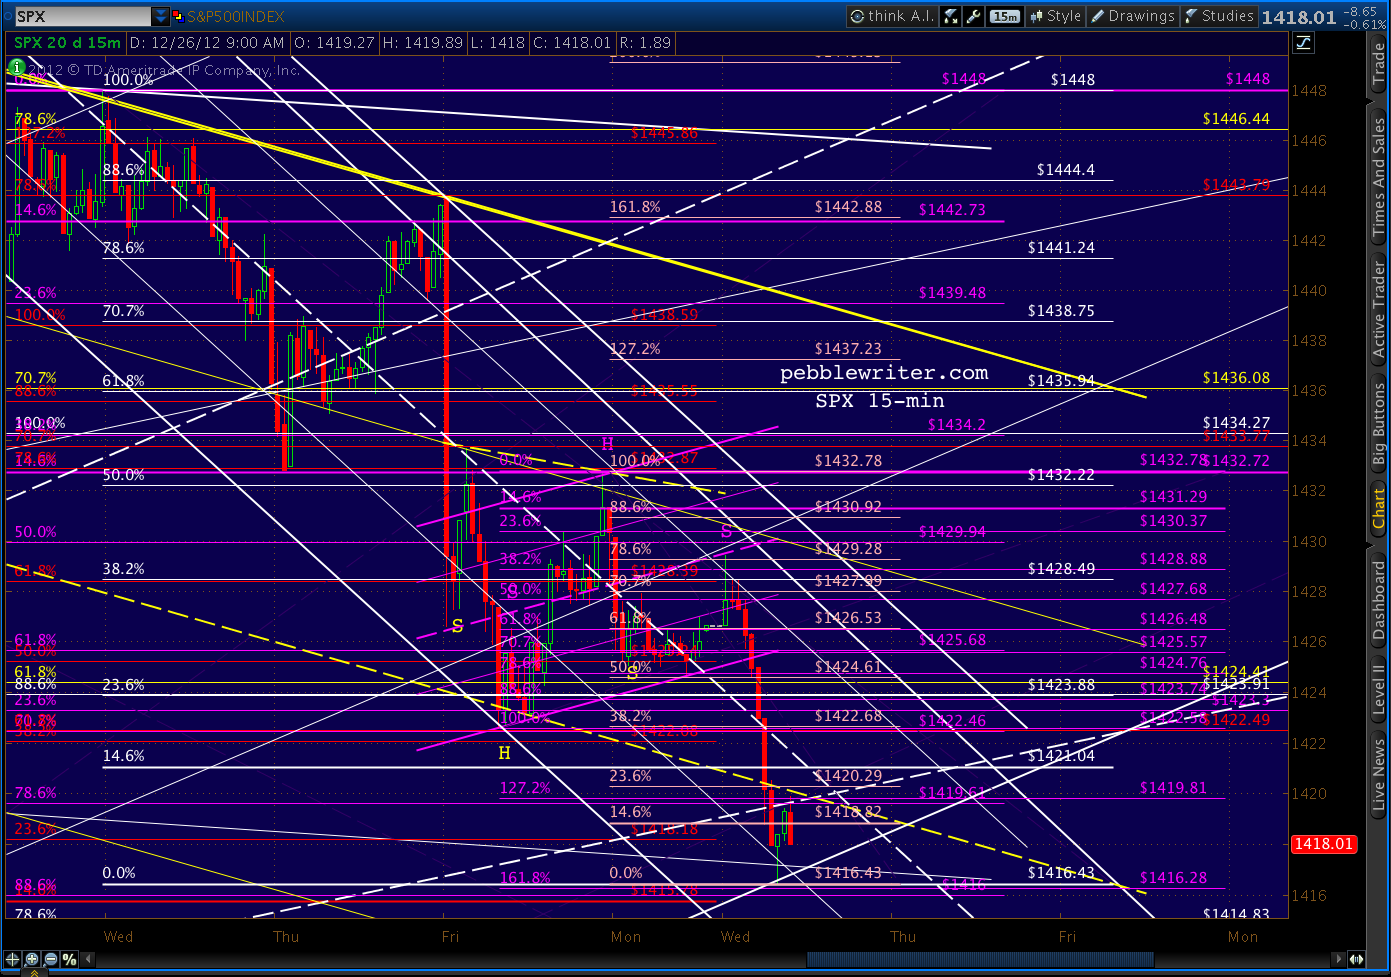
As to SPX, any push beyond 1432.78 carries the risk of a Bat completion up at 1441.27. Though, there would no doubt be a reaction at the .618 of 1435 first.
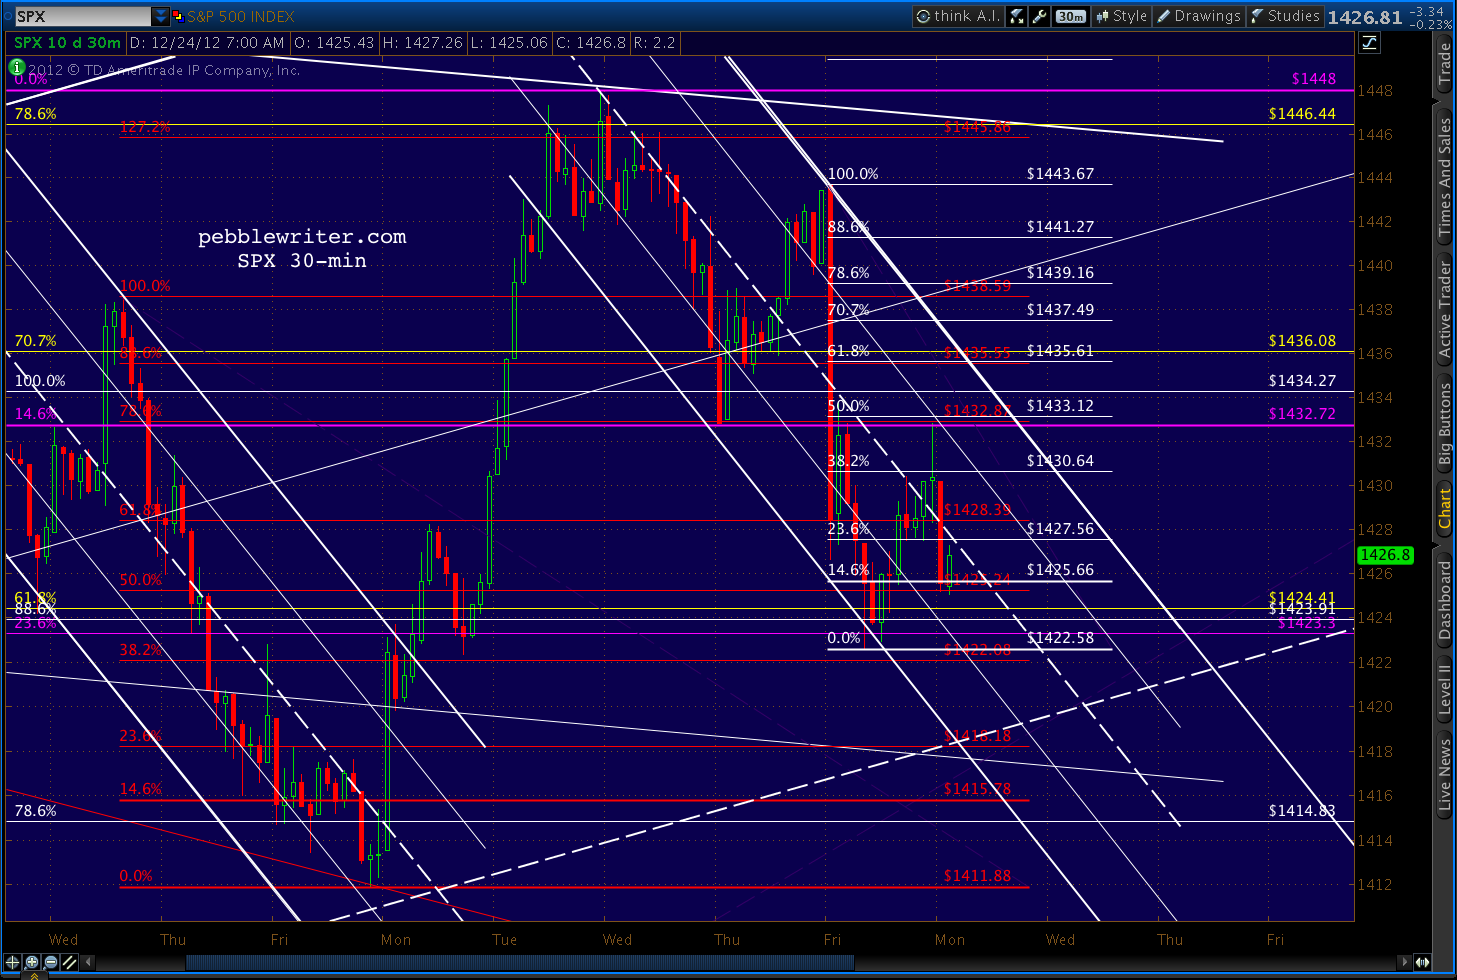 Since the 1432.78 high on Dec 21 stopped just shy of the 1432.82 low the day before, it might mark the completion of a Wave 4 in the first subwave of whatever degree wave down we’re currently in. Thus, the bulls might attempt to throw this most obvious bearish wave count into disarray by overlapping 1432.82.
It would then be easier to characterize the 1448-1422 slide as a normal A-B-C corrective wave rather than a bearish impulsive wave. Regular readers know that I don’t use Elliott Wave for predictive purposes, but it’s good to be aware of what Wavers might be thinking — since breaking through key EW levels will likely get them moving one direction or the other.
Our bearish case would benefit most by a reversal right here at the midline of the proposed white channel.
More later.
UPDATE: 11:45 AM
SPX just completed a small H&S pattern (below, in purple.) If it plays out, it will negate a potential IH&S pattern (in yellow). If the purple pattern plays out, it targets 1417 or so, which is around the bottom of the little white channel that’s tracking pretty well so far.
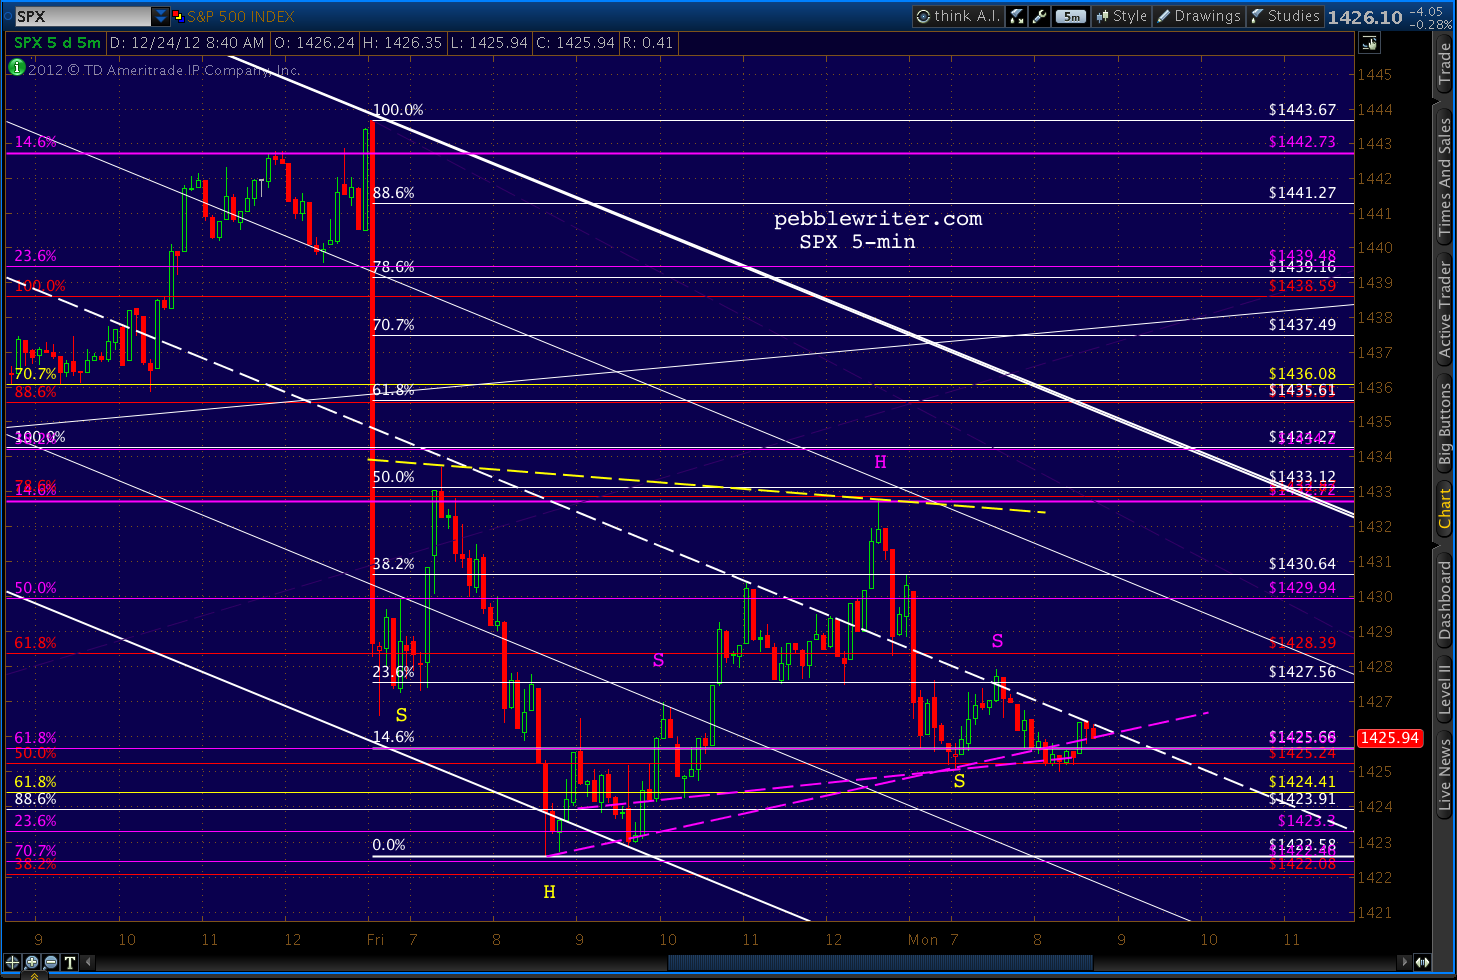 If the yellow pattern completes with a return to the dashed yellow line at Friday’s 1432 high, it would target somewhere in the vicinity of the .886 retracement of the 1443-1422 drop at 1441.
A low-volume, holiday-shortened feel-good day like today would be the perfect time to execute a ramp job. As discussed above, keep your guard up.
UPDATE: 1:00 PM
Things remain on track here at the end of the holiday-shortened equity trading day. Any fireworks will have to wait until Wednesday.

BTW, I finally updated the RESULTS PAGE for those who follow such things. Friday marked the end of the third quarter since the new site went live on Mar 22. After Dec 31, reports will be based upon calendar quarters.
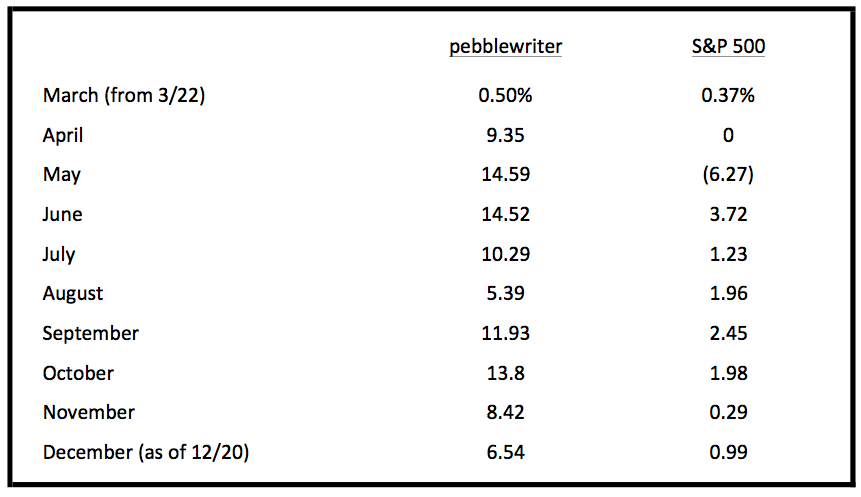 Since inception last March, we’re up about 95% as compared to 3.7% for SPX (without dividends.) I don’t have figures for the same time period for hedge funds, but according to HSBC’s Dec 13 Hedge Fund Weekly [available on Zerohedge.com] the average ytd performance for all equity hedge funds was 5.15%. The top-performing fund (BTG Pactual’s Distressed Mortgage Fund) returned 39.91%.
* * * * * * * *
POTENTIAL CHANGES:
A couple of weeks ago, I mentioned I’ve been considering some significant changes to this site. Although our results have been above-average, I’ve debated whether the current format is the best way of delivering value to members.
It’s challenging, for instance, to convey information in a way that serves the needs of both long-term investors and day-traders. It’s also difficult to strike a balance between providing timely trade information to those who don’t require a lot of explanation and educating those who are new to my process.
Also, from a purely mercenary standpoint, I’d like the site to make financial sense for me and my family. I realized when I began the site that it would take some time for word to spread. My goal was that by the end of the year I could cover my nut while putting in only 40-50 hours per week — leaving me enough time to hang out with the family, coach a little basketball, travel some.
Nine months later, membership has grown to a point where it almost pencils out — but, not quite. I can’t yet justify hiring a proper web developer and administrative staff to handle membership issues, accounting, loss prevention, so I’m putting in 60-80 hours week on average — which, of course, leaves less time to chart, write and sleep — not to mention my family and other business interests.
It seems I have two choices: grow the site or convert it. Growing it should be simple but, in all my years as a stockbroker and later in asset management sales, I have come to realize I don’t really enjoy sales. And, of course, devoting time to shameless promotion takes away from charting and writing — which I do enjoy.
Converting the site would mean setting up a hedge fund. Several friends have expressed interest in seeding a small fund that would ultimately grow to about $100 million. I would continue to do exactly what I’ve been doing — identifying major and interim tops and bottoms — and execute unleveraged long or short positions in major markets on behalf of the fund.
It would be run from my small, but lovely town (also an internationally renowned vacation destination) on the Central California coast with an assistant and a trader. Custody, administration, etc would be handled by name brand entities elsewhere.
As I envision it, current members would have the option of investing in the fund or continuing to simply receive research until their membership expires. Current members would, of course, have their pebblewriter.com fees applied to fund management fees — which would be discounted for current members who are involved from the start.
One member has also suggested a chat-room type system whereby fund trades could be communicated in real time to members who want to continue trading their own accounts as well. I am fine with this idea, as long as we’re not giving away research to our competitors (one of the problems with the current site, where we get 20-30 login attempts daily for every active, paying member.)
I have a lot of homework yet to do, beginning with a survey of current members I had planned on sending out regardless. In the next couple of days, I will be seeking your opinion on both the current site and the proposed fund. There is no fund yet, so I am not soliciting investments at this time; but, it would be very useful to get a sense of members’ potential interest. Please watch for an email.
NEW FEE SCHEDULE:
In the meantime, membership fees for pebblewriter.com are slated to increase on January 1, 2013 (regardless of what happens with the fund, I need to purchase some new computers, backup systems and communications.) In keeping with my practice of tying fees to performance, the new rates are as follows:
- Annual: $950
- Semi-Annual: $550
- Quarterly: $375
I recognize this is a significant increase, so I am offering existing members the opportunity to lock in current rates through December 31. Also, as a bonus, the first 15 annual memberships will be granted Charter Membership status. In other words, your annual rate will never rise above $800 for the life of the site. As those who joined last Spring for $500 will tell you, that’s pretty cool.
This offer won’t be opened up to the public until December 26th. And, as always, if you currently have a membership, we’ll tack your new one on to the end of your current one. That way, you won’t get stuck with even higher prices when your existing membership expires in a few months.
Again, if we move forward with the fund, current members will receive a full offset for any pebblewriter.com fees paid from this date forward, and will also receive a meaningful discount on any fund fees charged. I strongly believe in rewarding those who’ve stood by me on this adventure.
If you’ve read this far, thanks! I had no idea when I started pebblewriter last year that it would grow into something so rewarding and enjoyable. I’ve learned a lot, and I hope most of you have, too.
* * * * * * * *
Christmas Eve is always bittersweet for me. I love being with family, singing Christmas carols and seeing the excitement on my children’s faces as they rush downstairs to see what Santa brought. And, it seems most people are just a little bit nicer to one another. But, it’s also the day when, at age 15, I lost my mother — my one remaining parent. So, for me, it’s a reminder to reach out to loved ones and tell them how much they mean.
It’s also a reminder of the importance of helping those who are struggling. These are challenging times. If you’re anything like me, the events of the past year have caused you to take stock of the world and your place in it. Between wars, famine, financial distress, political and religious division and, yes, shootings — we need this holy day now more than ever. And, regardless of what church, synagogue, temple or mosque we attend, we need to look for opportunities — every day — to minister to those around us.
My family and I wish you all a Merry Christmas and a blessed New Year.



 The EURUSD still hasn’t retaken its key level — the .886 of the last swoon at 1.329. It reached 1.3298 late yesterday evening, but has since fallen back below the key major white channel.