First, a quick overview…
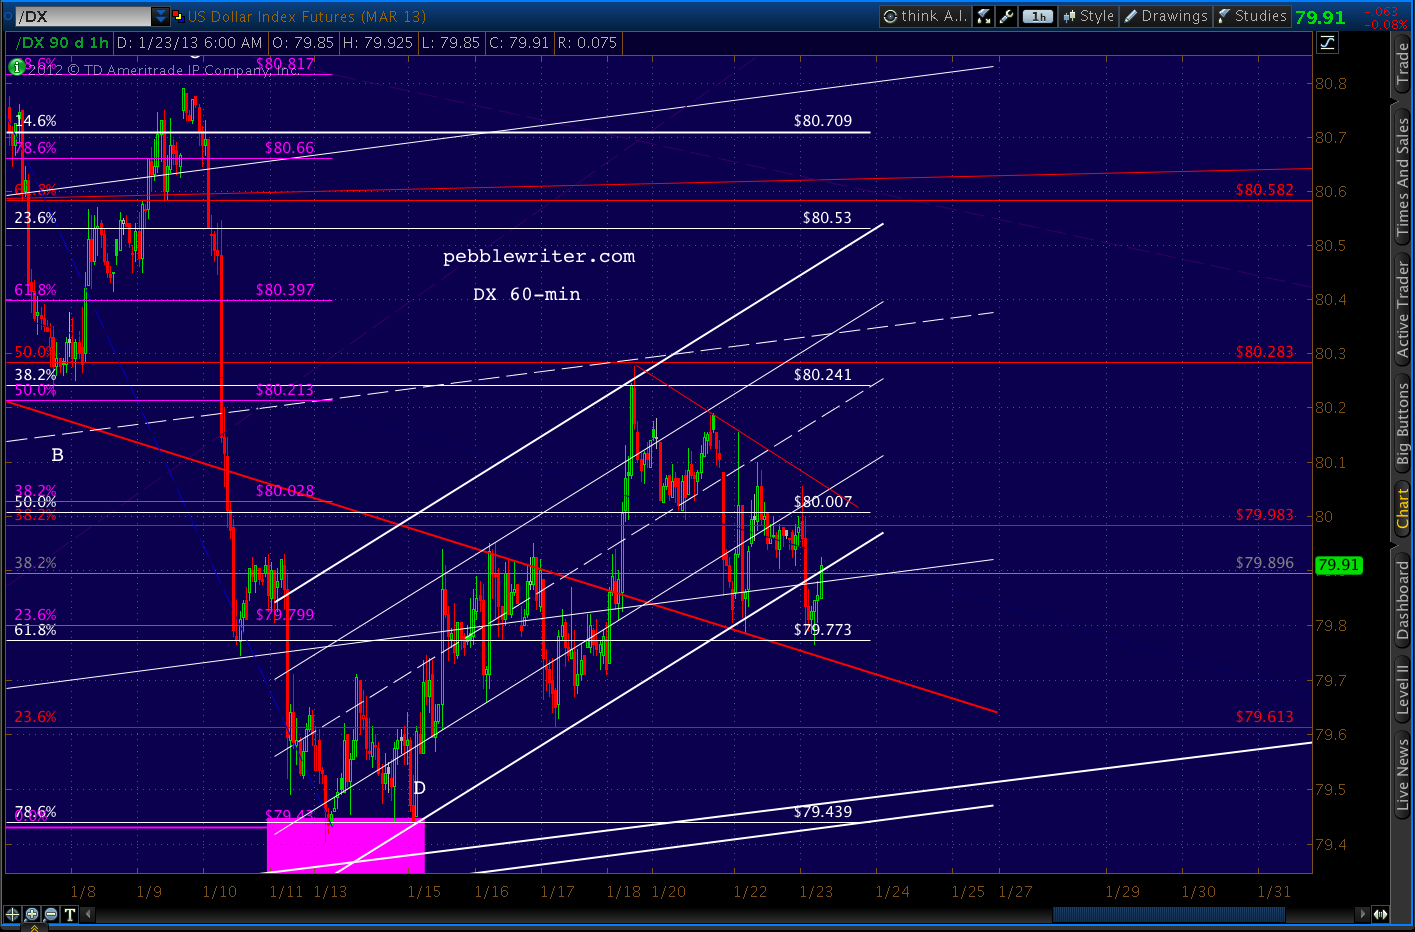
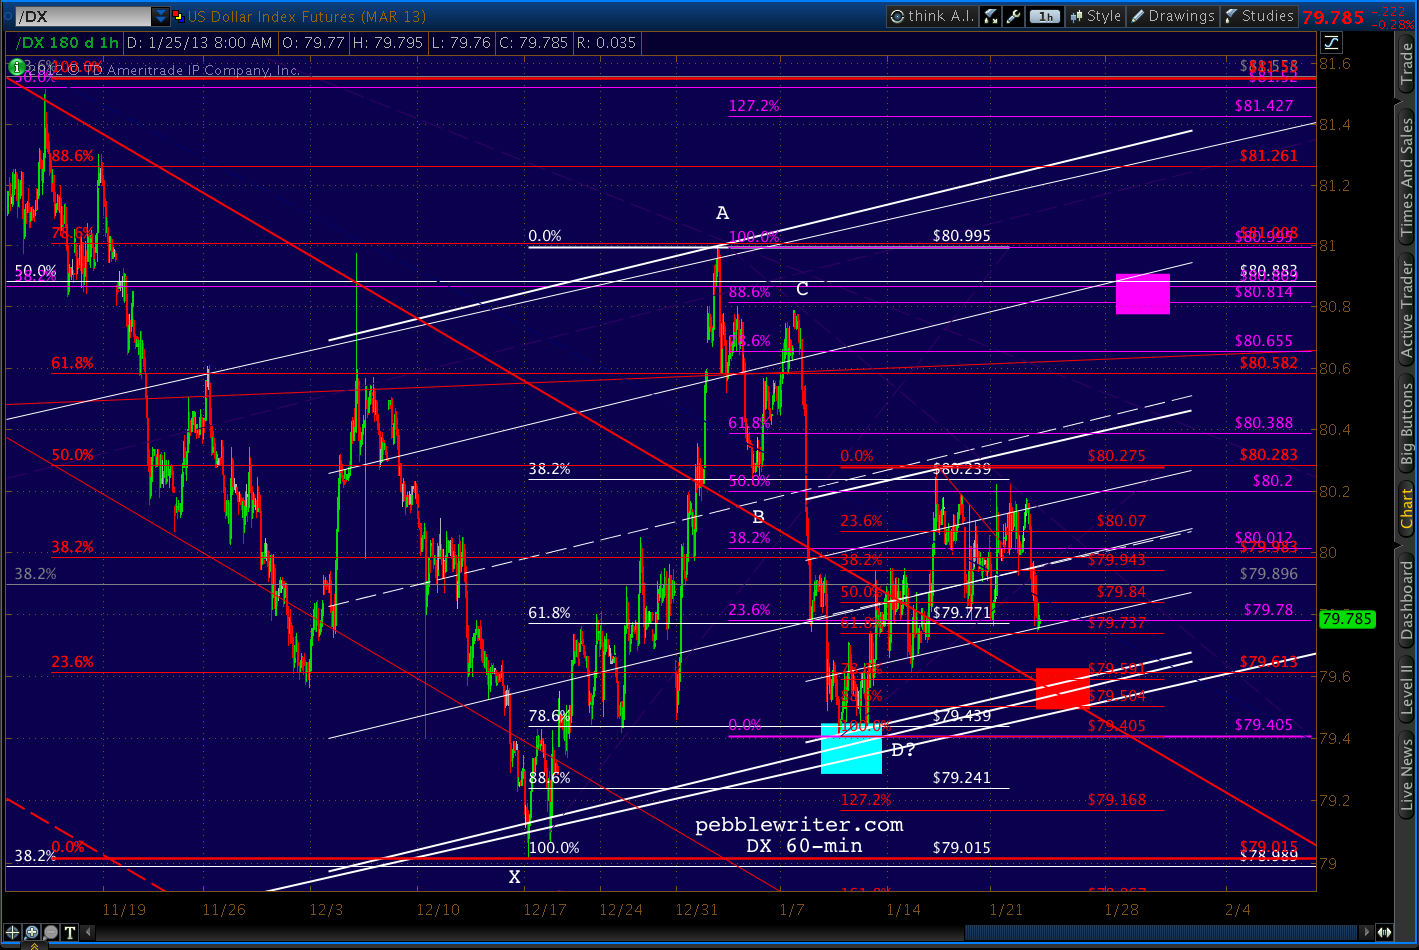
The dollar got clobbered overnight, knocking it temporarily out of the white channel that’s guided it since Jan 11.
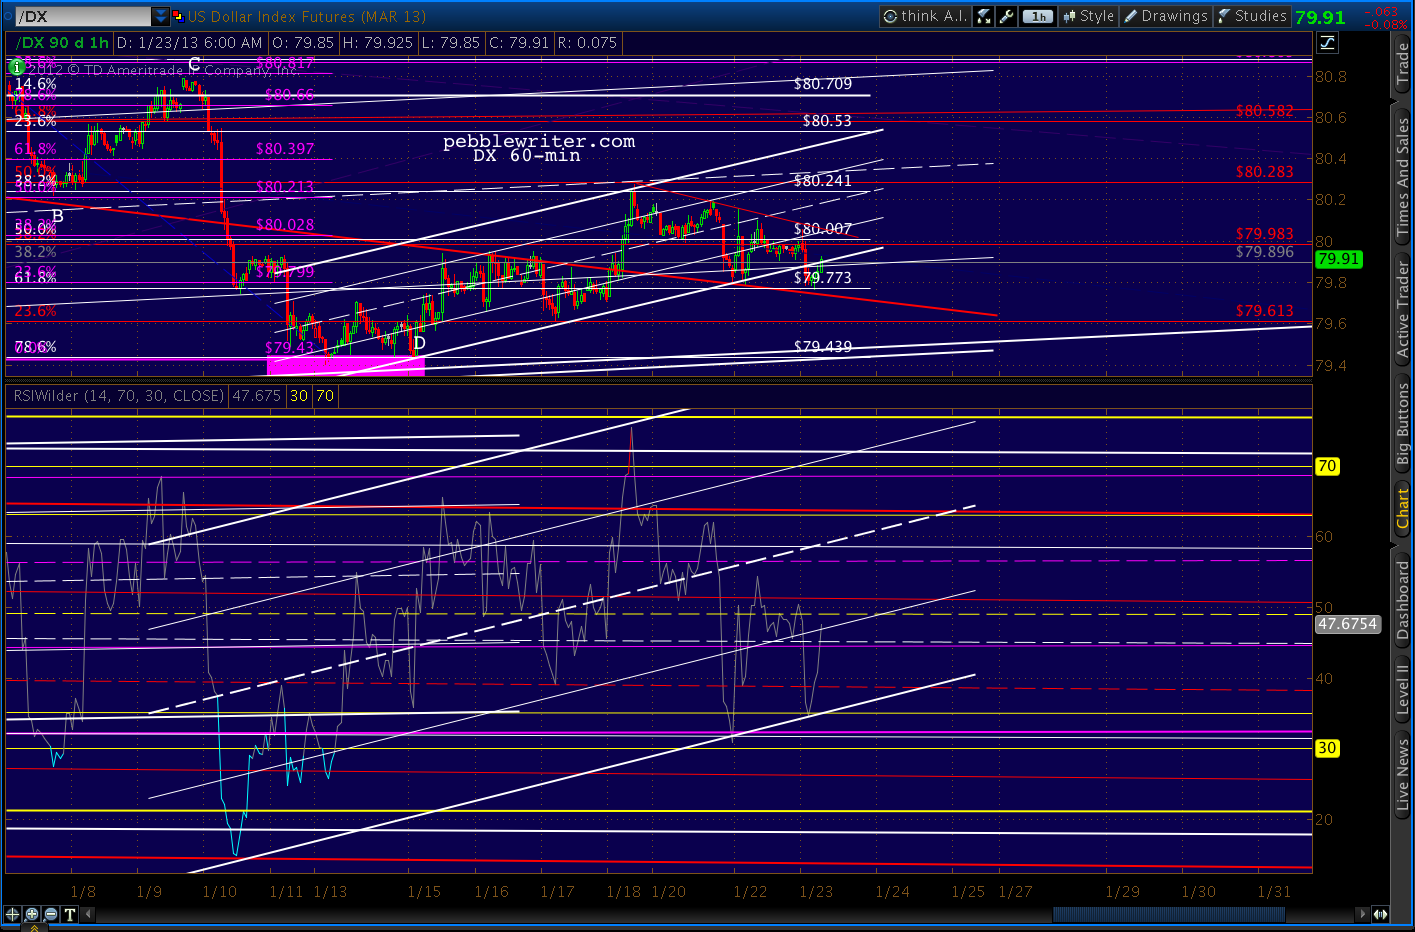
 But, interestingly, its RSI channel is doing just fine, thank you.
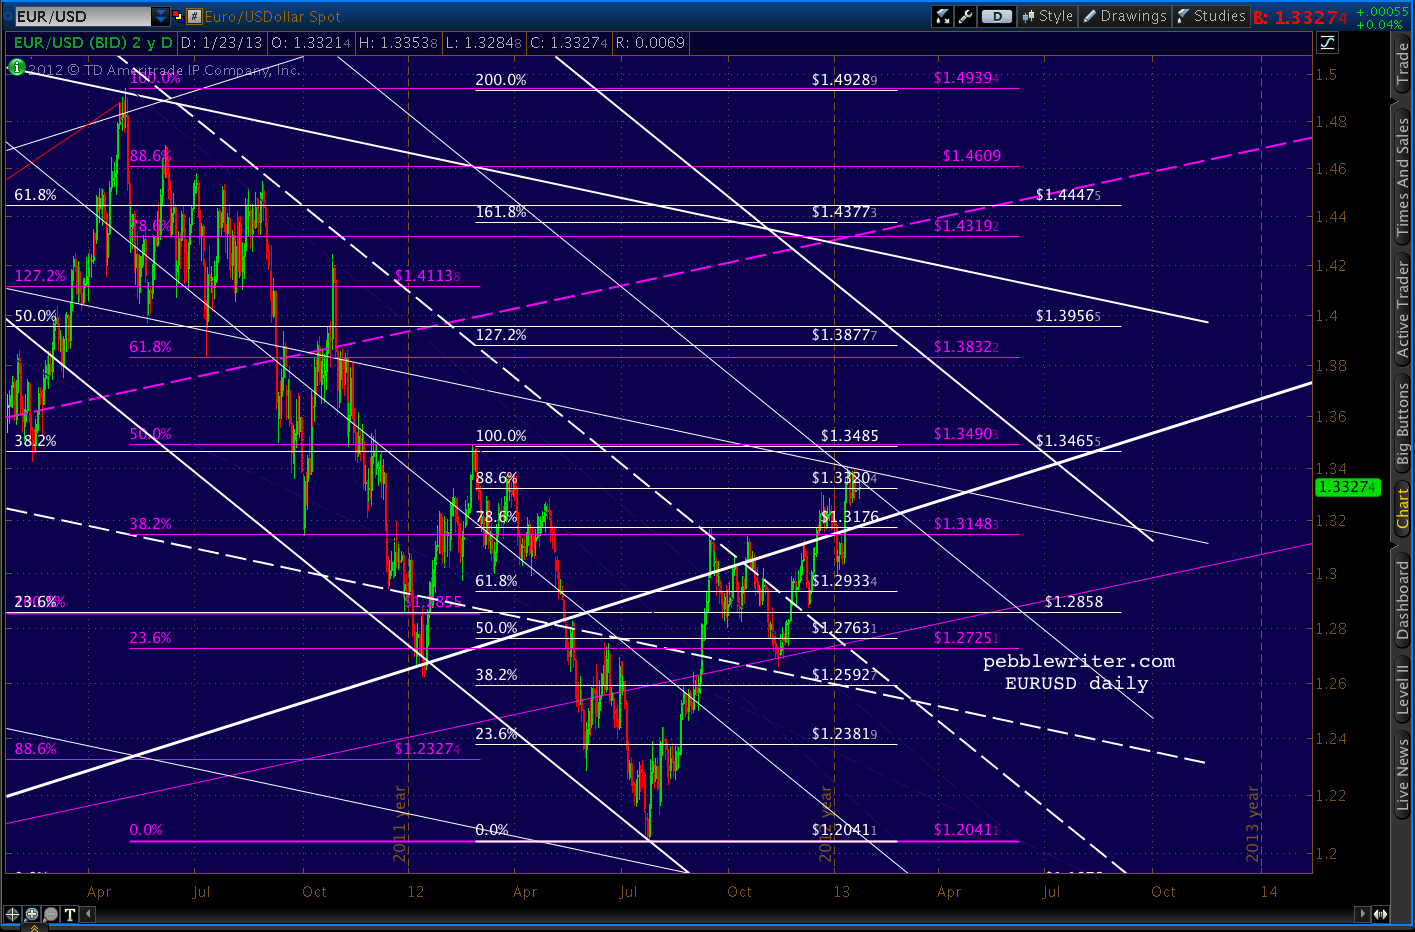
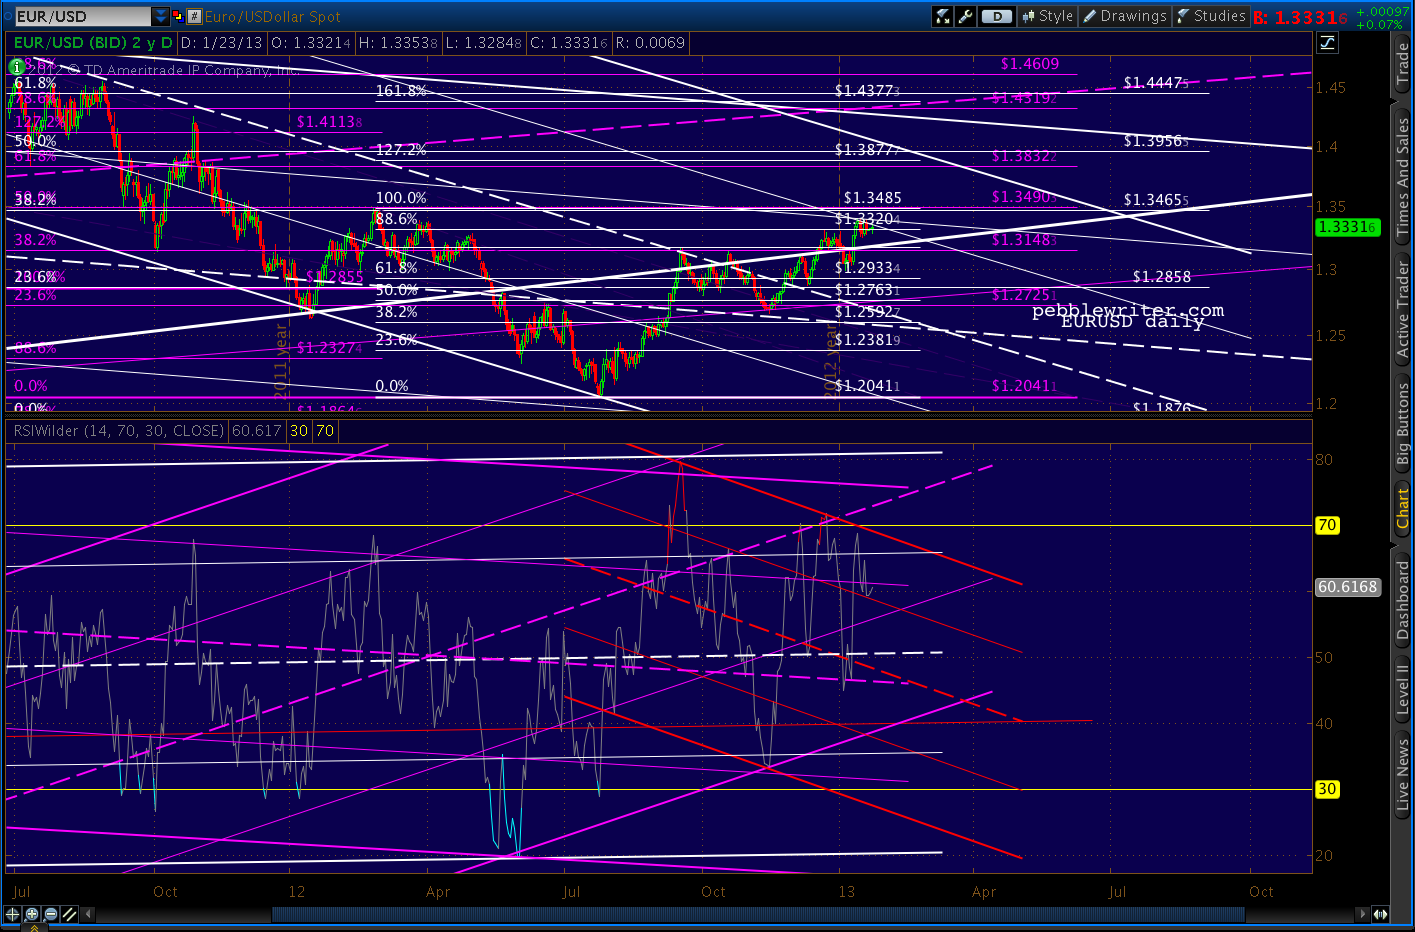
The EURUSD continues to levitate, but still hasn’t broken the last important interim top put in on Feb 24. It is also bumping up against two 25% channel lines, so could very well stall out here at the .886.
 There is still ample negative divergence regardless of which channel ultimately wins out.
With the market exceeding the recent 1474 highs, the analog that did so well for us since last April is officially dead. This begs the question: “now what?” I see three big issues hanging over the market right now:
- earnings season — AAPL in particular
- the US budget/debt ceiling imbroglio
- new highs justified?
Earnings
GOOG and IBM both gapped up this morning, but the earnings that can really move the market — AAPL — comes after the close. We’ll take a fresh look at the AAPL chart later today.
Budget/Debt-Ceiling
In a few hours, the House will probably pass a measure to postpone the debt ceiling debate until May. Reid and Obama have both said they’re on board, so this appears to be a done deal. If House Republicans don’t fall in line, as occurred with “Plan B,” the market will sell off precipitously.
New Highs
The market’s strength has caught many off guard, including yours truly. Many are calling for new all-time highs for SPX. The 2007 high of 1576 is now only 84 points away, so a few good sessions could do it.
We’ll take a fresh look, focusing on the harmonic and chart pattern picture as well as the establishment agenda. “What’s that?” you say. Say all you want about random walks, CAPM, dividend discount models and Dow Theory. Like any government-managed enterprise, the market is subject to the policy goals and needs of those who attempt to control it.
Even to my cynical ears, this sounds a bit like rants from the tin-foil hat crowd. But, consider the news on Egan-Jones yesterday. This is one of the biggest stories of the month, yet predictably earned only this from WSJ/Marketwatch:
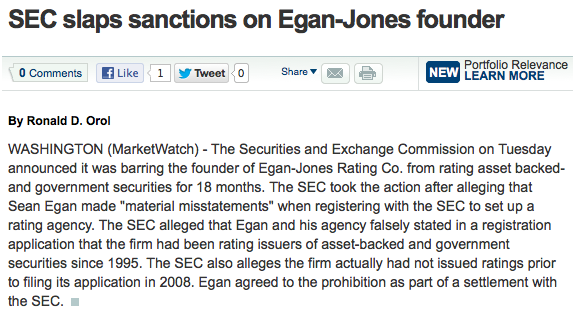 CNBC was slightly more generous, yet still presented only the SEC’s side of the story. It’s a story that deserves to be told because it speaks volumes about the degree to which the market is presently being controlled. And, I’m not just talking about quantitative easing, though I suppose we’d have to consider QE exhibit #1.
Last summer the market crashed 22%. It was an analog (replay) of the 2007 top, so we saw it coming in plenty of time to profit quite handsomely. But, it was a huge wake-up call for The Powers That Be (TPTB) or Plunge Protection Team, Wall Street Cabal — whatever you want to call it.
With virtually unlimited power and unlimited resources, why couldn’t they prevent something like that from happening? More importantly, if the top was a replay of the 2007 top, might the rest of 2011 play out like 2008-2009?
It didn’t, because they learned from the crash of July-August. First, they tweaked the markets just enough to bust important chart patterns that were playing out. Second, they tweaked the rules to provide for more time to contain any damage which might otherwise occur (circuit breakers, etc.) Third, they attacked those who had “caused” the crash.
S&P CEO Deven Sharma was one of the first victims. In the wake of the 2007 financial crisis, S&P was rightly pilloried for having pulled its punches — particularly on mortgage and banking related debt. This was no surprise to anyone who’s ever worked on Wall Street — which pays for these supposedly unbiased views.
An infamous exchange between two S&P analysts in April 2007 aptly illustrates:
“BTW, that deal is ridiculous.”
“I know, right . . . model def(initely) does not capture half the risk.”
“We should not be rating it.”
“We rate every deal. It could be structured by cows and we would rate it.”
Imagine if Hollywood studios funded the reviews of their movies. Would you care if they received thumbs up or down? So, in August 2011 S&P found religion and bravely downgraded US debt. Seventeen days later, Sharma was fired and replaced with the COO of Citibank, the bank whose existence relies on the absence of any future downgrades.
Egan-Jones beat S&P to the punch, downgrading US debt on July 16. Two days later, the SEC’s Office of Compliance Inspections and Examinations called looking for information on the downgrade.
On October 12, Egan Jones was formally notified of a Wells Notice — they were being investigated. On April 24, the SEC filed a cease and desist order against Egan-Jones — the only rating firm not on the take — stating the action was “necessary for the protection of investors and in the public interest.”
The financial establishment’s interests, sure. But, to frame this obvious smack down as “in the public interest” is laughable alarming. Egan-Jones was the one rating firm with the balls to point out the country’s crumbling financial condition and stick to their guns. Now they’ve been branded as deceitful, dangerous. George Orwell spoke the truth in 1984:
“In a time of universal deceit, telling the truth is a revolutionary act.”
That other deep thinker, Jim Morrison, provided a similarly profound observation:
“Whoever controls the media controls the mind.”
The extent to which the market has been manipulated is deserving of its own post. But, this Zerohedge article, forwarded by a member, is a great preview.
Okay, so I know what you’re thinking: if the market is so heavily manipulated (and, presumably, insulated from downturns) why bother trying to beat it? Simple.
- Chaos theory tells us they won’t have enough fingers to plug every hole in the dike (TPTB have similar “never again” strategy sessions after every crash.)
- Even when things do run as programmed, we can still effectively capture enough significant swings in the markets enough of the time to boost returns and, more importantly, try to avoid huge downdrafts.
Over the very long-term, stocks return 8-10% — depending on the time frame examined. But, sadly, most of us are limited to 40-60 years of investing. And, a 60% crash right before starting a business, buying a home or beginning retirement could be devastating.
So, we’ll keep plugging away, letting the markets tell us where they want to go…while trying to get there first.
So, the question is “Now What?” We’ll start by looking at the harmonic picture. As detailed in our last review of all the previous tops, harmonic patterns are very likely to come into play. So, we’ll start with the charts, then move on to the agenda question and, last take a look at AAPL.
Since we’ve exceeded the range at which this rally could be considered a double top, we’re probably going higher still. So, we’ll examine the 1.272 and 1.618 extensions.
In terms of a trading strategy, I’d be comfortable going long here at 1491. But, disappointing AAPL earnings could knock the stuffing out of the market. So, those with weak hearts should probably stay on the sidelines until tomorrow morning.
The most recent patterns show a few possibilities, some of which are clumped together in fairly narrow ranges. The largest of the patterns — the yellow grid — shows a 1.272 Butterfly Pattern extension at 1510.19 that intersects with the 2.24 extension of the decline (purple grid) from 1448 – 1343.
A Butterfly Pattern is a good bet, as the Dec 18 reversal at 1448 pretty much nailed the .786 Fib level Point B (1446.44) which Butterfly Patterns require.
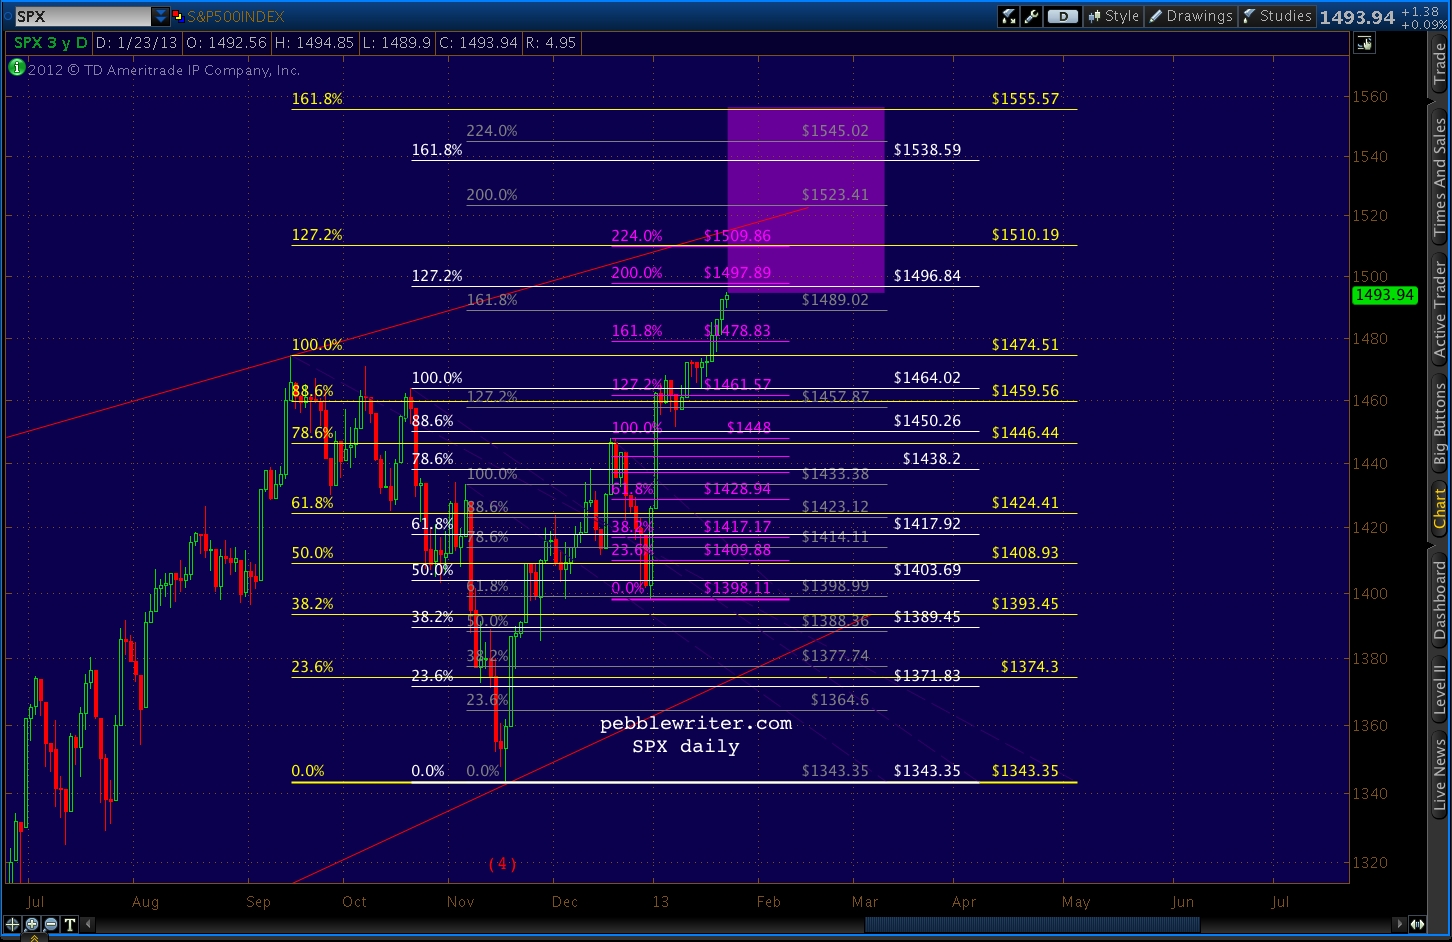
1510.19 also falls within the confines of the thin red line — the TL connecting the Apr 2 and Sep 14 highs that would probably satisfy the EW requirements of an ending diagonal. I know you’re out there, my Waver friends. Please weigh in, as I know only enough EW theory to be dangerous.
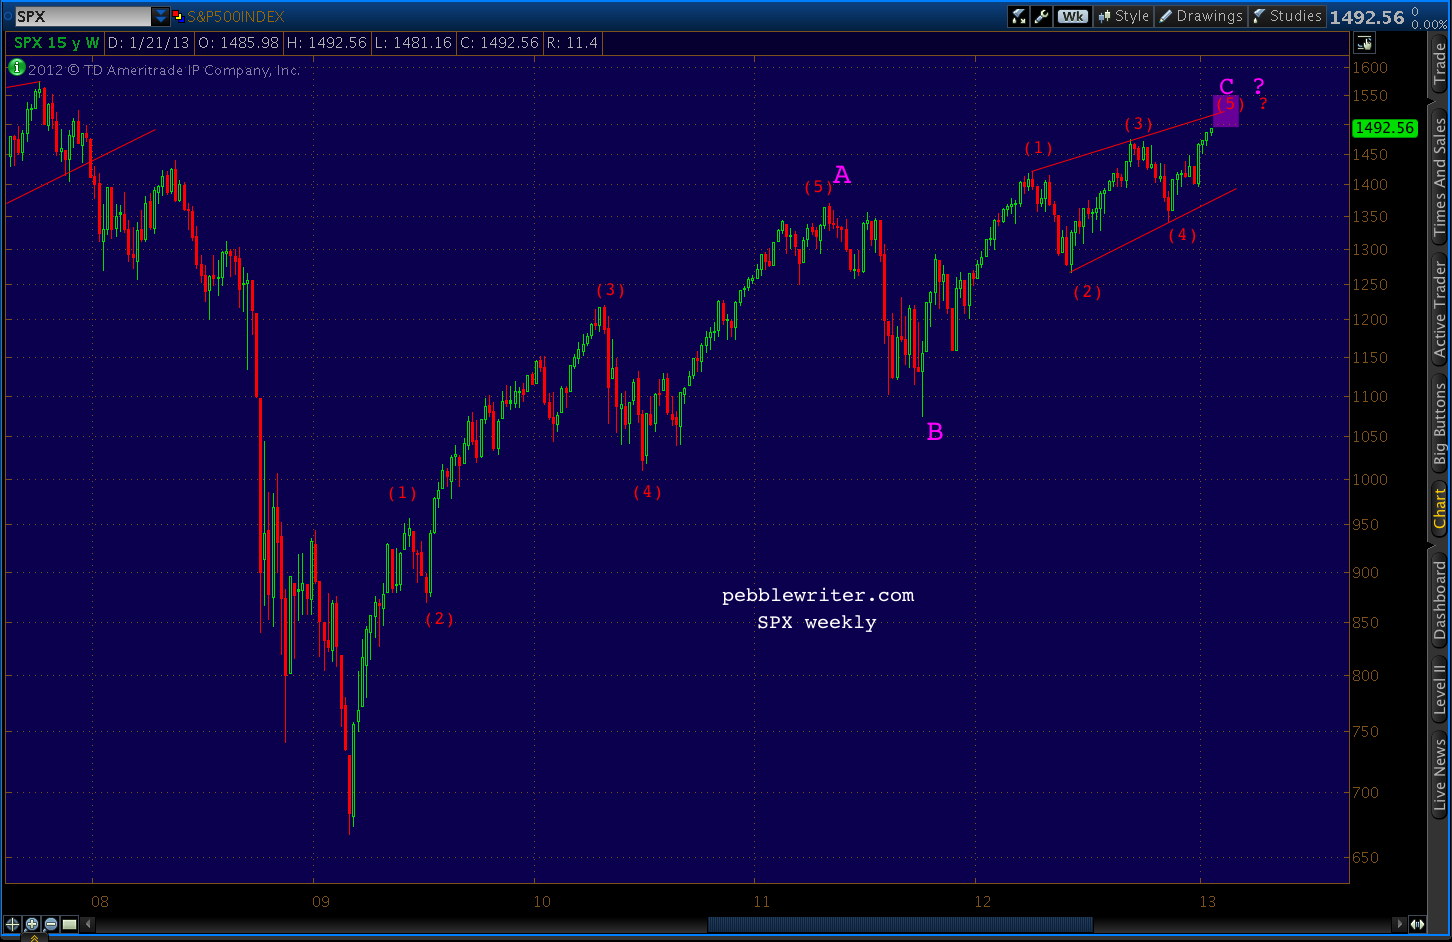 The white pattern is appealing enough, but I would have to consider it secondary in importance to the yellow since it began at a less momentous point X. Ditto for the grey pattern.
Although it should be noted that we faced a similar dilemma when choosing between the Point X’s for the Butterfly patterns beginning in 2011 [see: All the Pretty Butterflies.] In the end, it was a point similar to the white pattern 1.0 Fib at 1464.02 that determined the April 2 turn. It featured a Point B closest to the .786 Fib.
Zooming out, we can see that the 2011 highs could very well still influence the outcome of the current top. The chart that includes everything is a little busy…
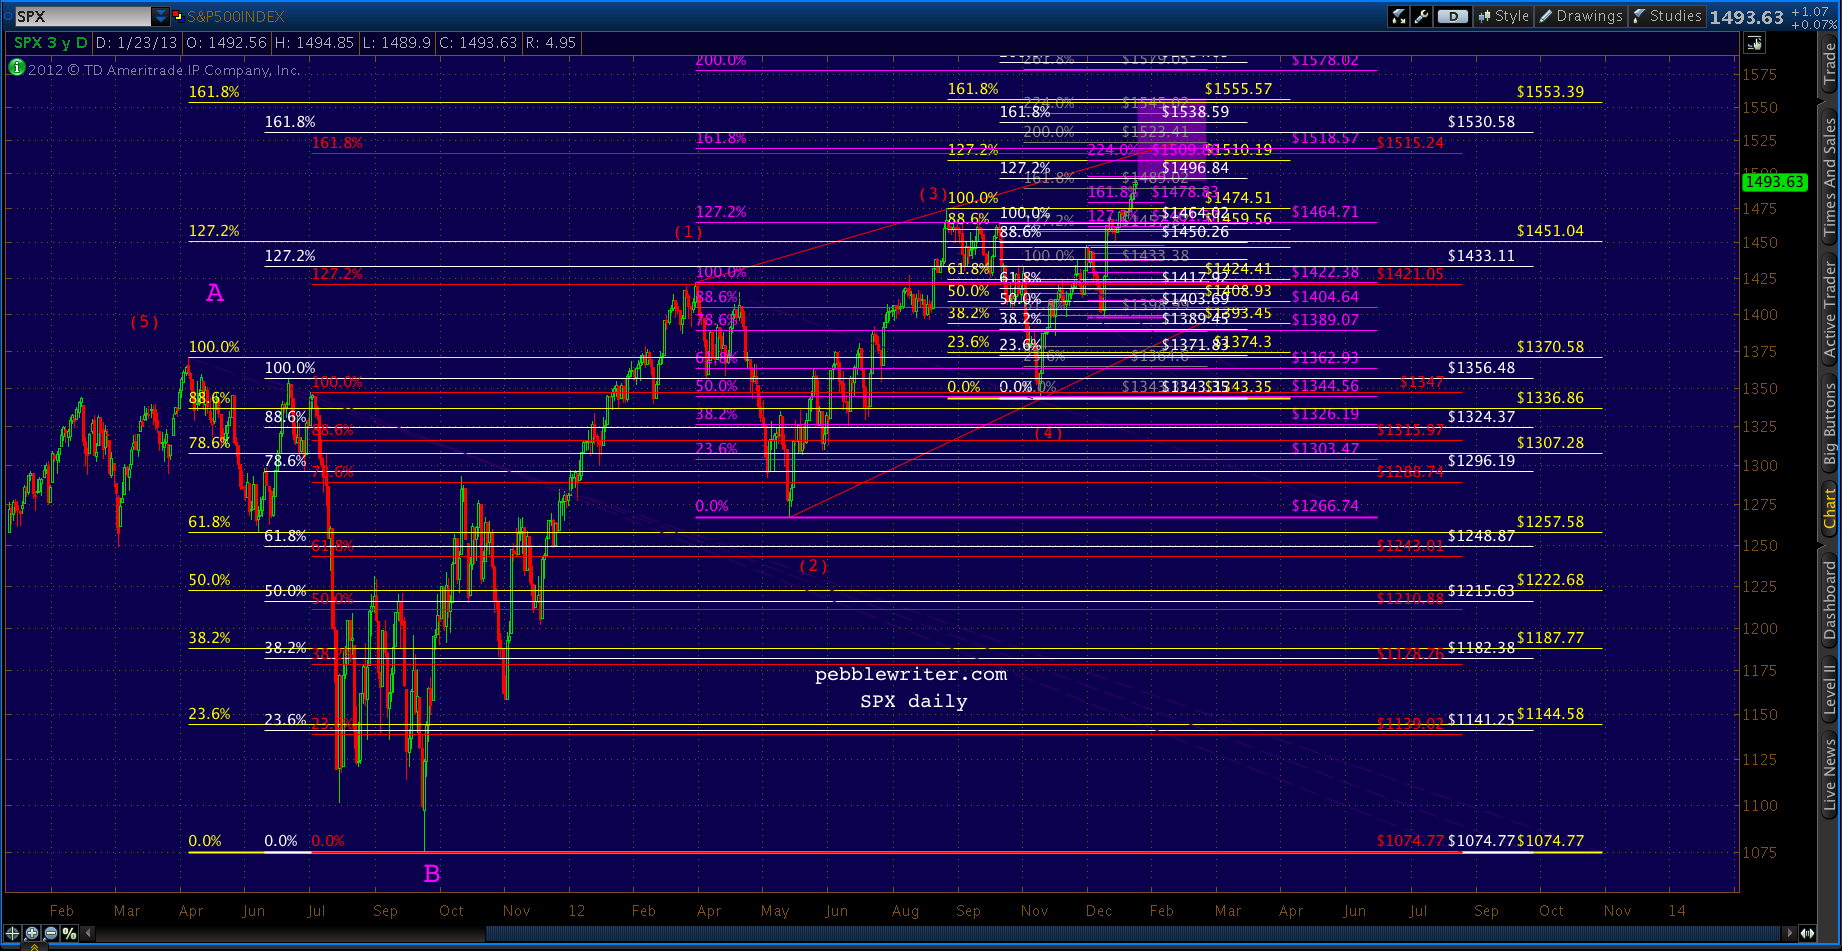 …so I’ll clean it up by eliminating the interior retracement levels and switching to weekly.
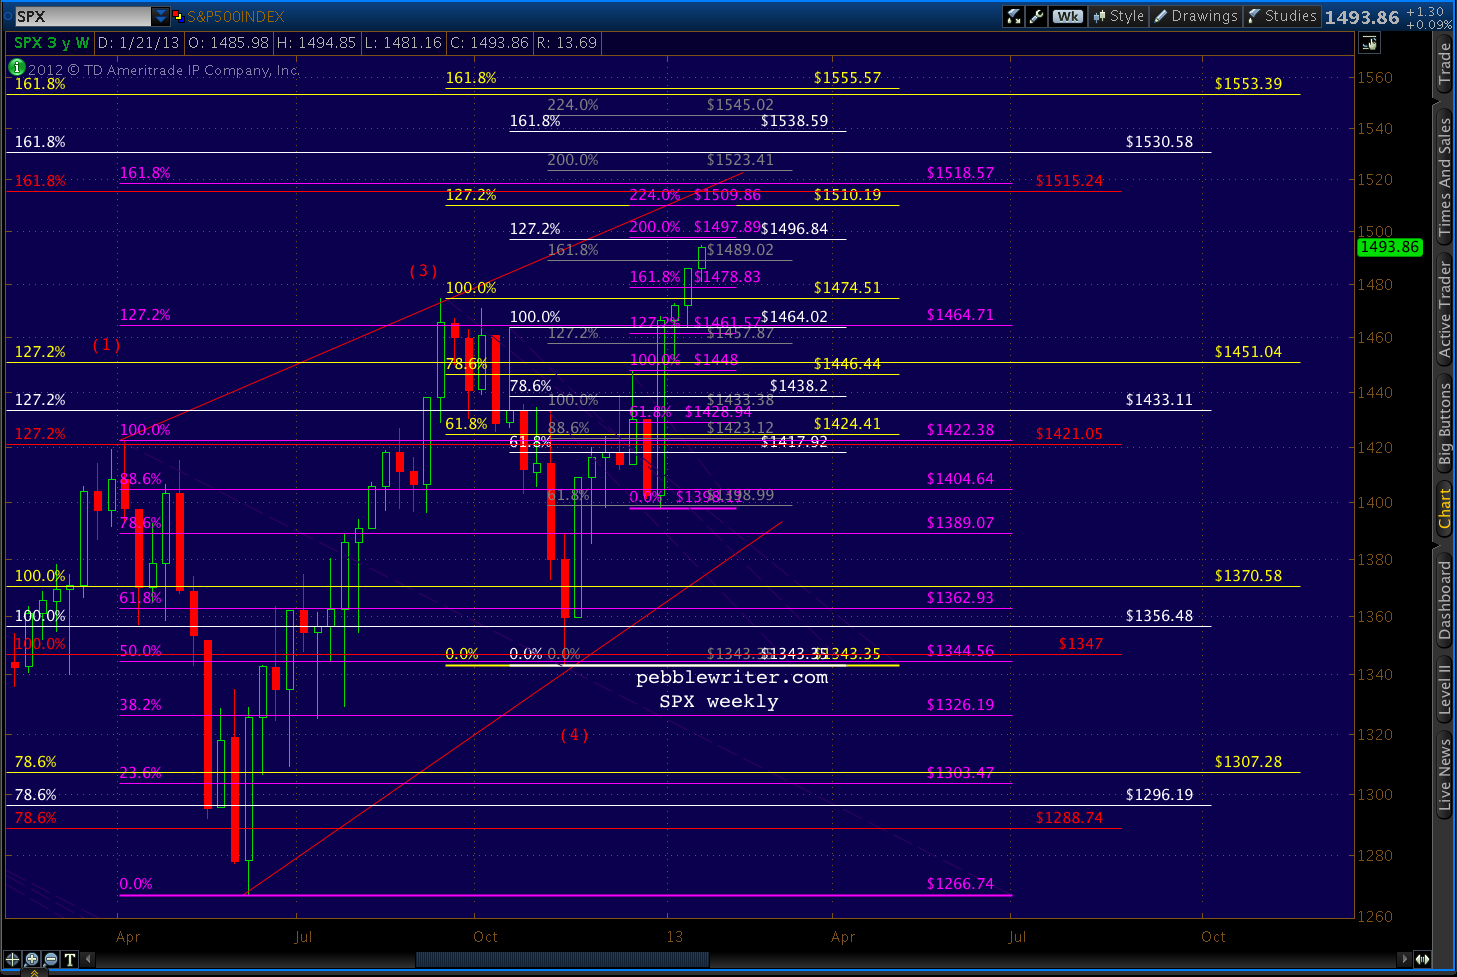 The target areas can be more easily seen in this close up.
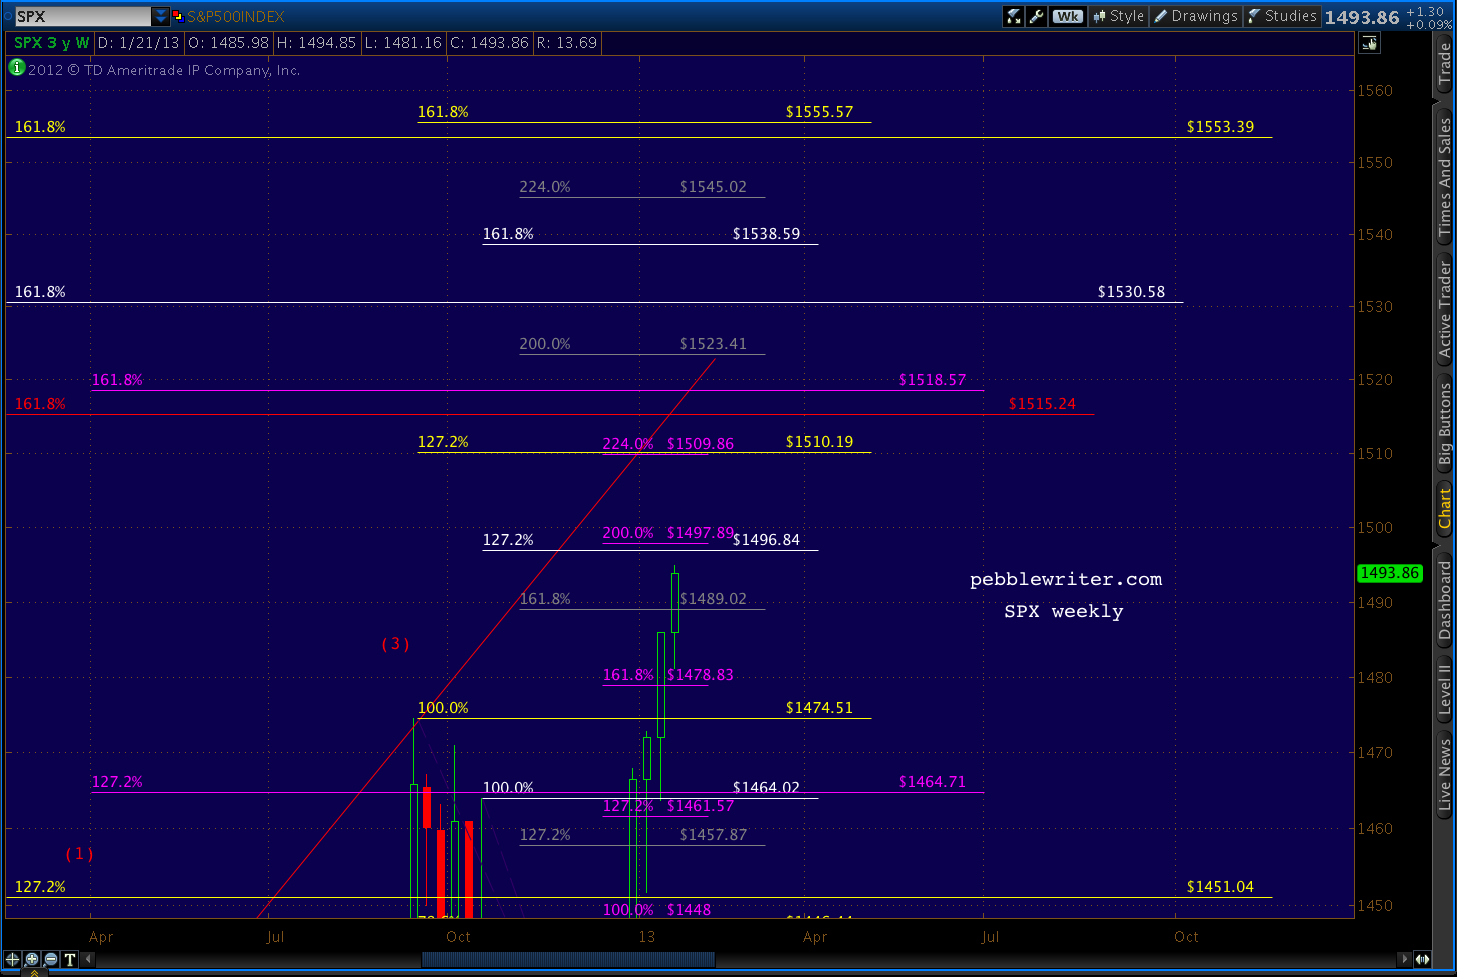 Note that the large red pattern, the one whose 1.272 extension helped me accurately forecast the April top, comes into play at its 1.618 extension of 1515 – only a few points away from the 1509-1510 level discussed above.
This is promising, as patterns that influence markets once (that was an 11% correction, after all!) are more likely to do so again. And, patterns that the market completely ignores — such as the yellow and white patterns from May and July 2011 — are less likely to suddenly leap into a position of authority.
And, there’s also a purple 1.618 extension (set up by the 1422 – 1266 decline) at 1518.57. Again, this is close enough to be considered significant.
If 1520 is exceeded, then we’ll look at the next higher grouping: 1553-1555. This “group” is basically the two yellow 1.618’s. Again, the larger pattern’s 1.272 had no influence on the market. The smaller pattern’s 1.272 is the one coming up at 1519.
Summary
My leading harmonic forecast is for 1509-1515. I can’t imagine getting this close to 1500 and not snagging it for the trophy case. And, I like the idea of dancing with the harmonic patterns that brung us.
My secondary goal is slightly higher at 1553-1555, so there should be opportunities to jump back in and capture most of any upside above 1520 if/when appropriate. Such a move would likely follow a reversal from 1509-1515 back down to 1474ish and would constitute a fifth wave rather than the ending diagonal suggested above.
If AAPL’s earnings stink up the joint after the closing bell, going long won’t have looked very smart. But, judging from the steadily appreciating share values, I’m guessing that a relatively positive result is already being leaked.
Chart Patterns
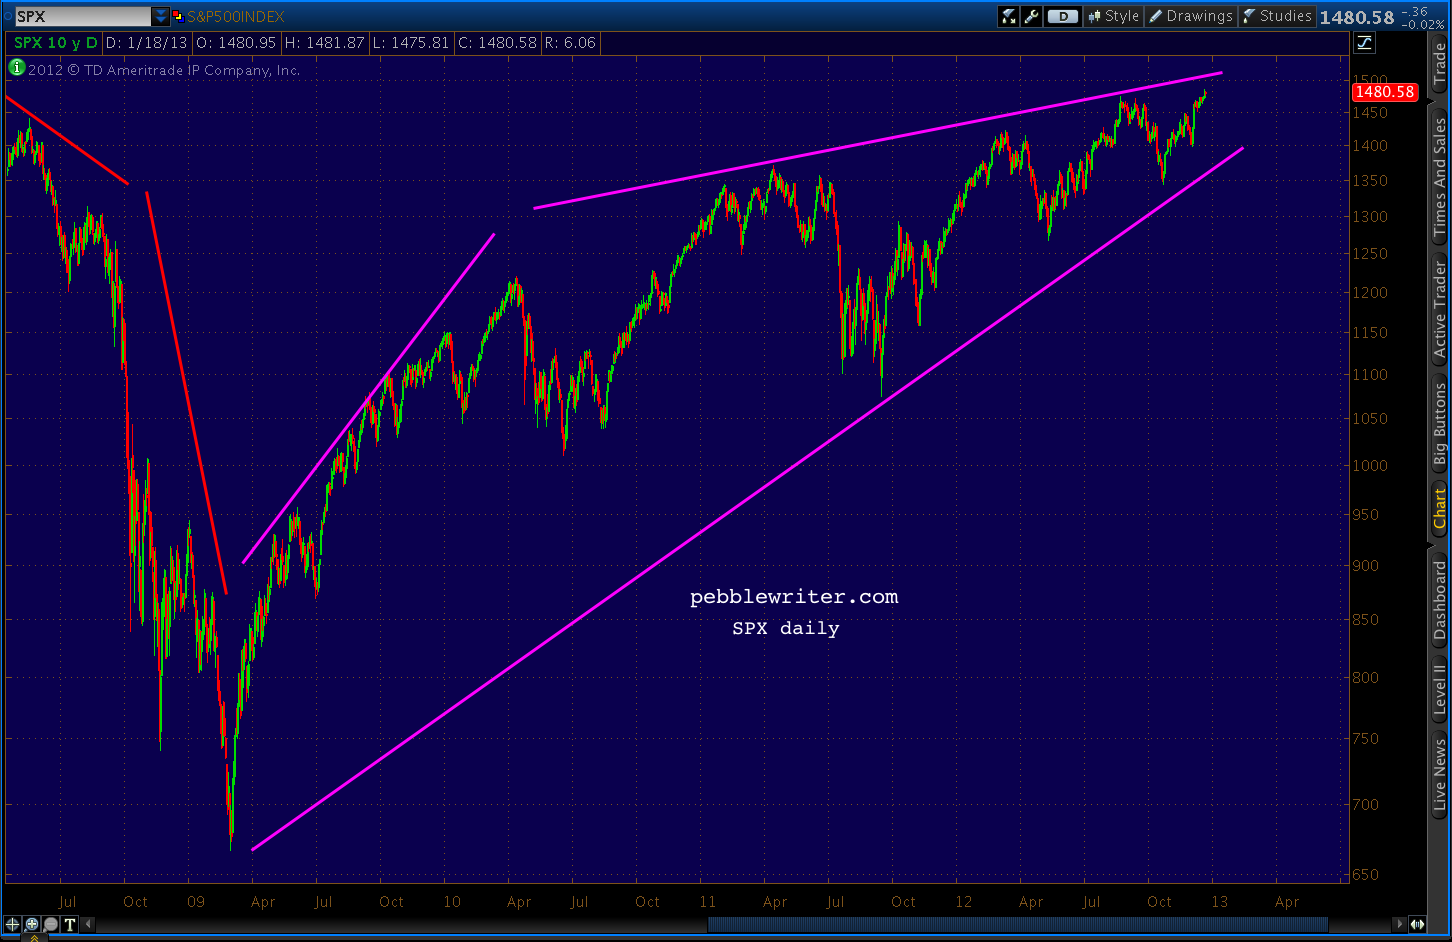
I won’t rehash the stuff already posted in the past couple of weeks. Just take a look at the rising wedge that would be confirmed by a reversal at 1510 as early as tomorrow. The target would come at the .886 of the base to apex price range and .618 of the time range (almost too good to be true.)
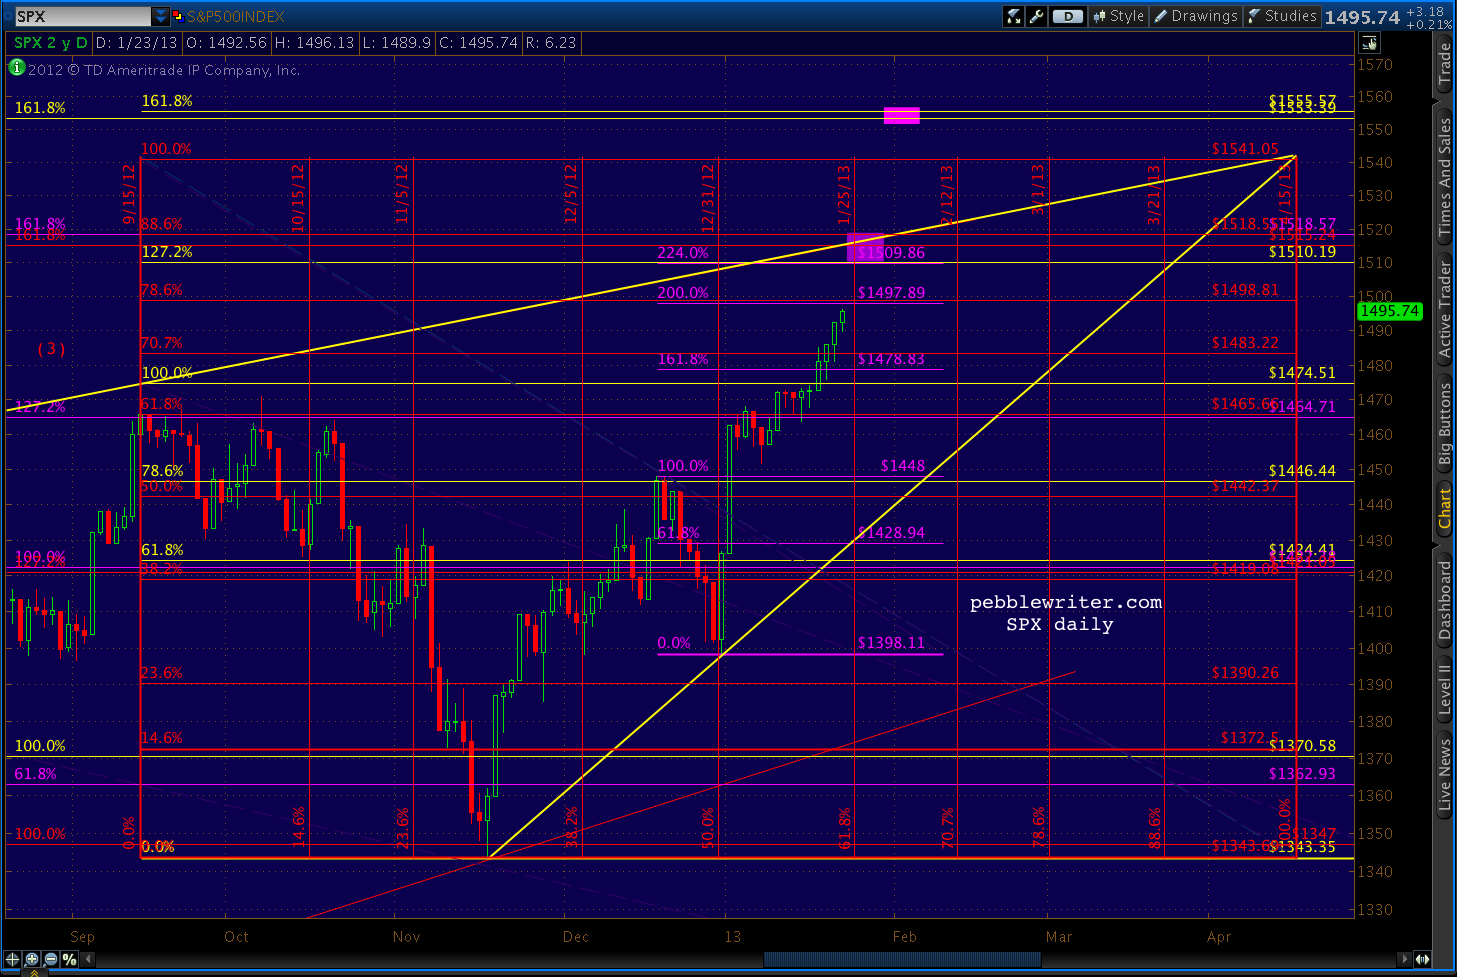 We’re currently very close to the .786 of 1498, which tells me there’s a decent chance of a run up to 1500ish into the close.
UPDATE: 3:45 PM
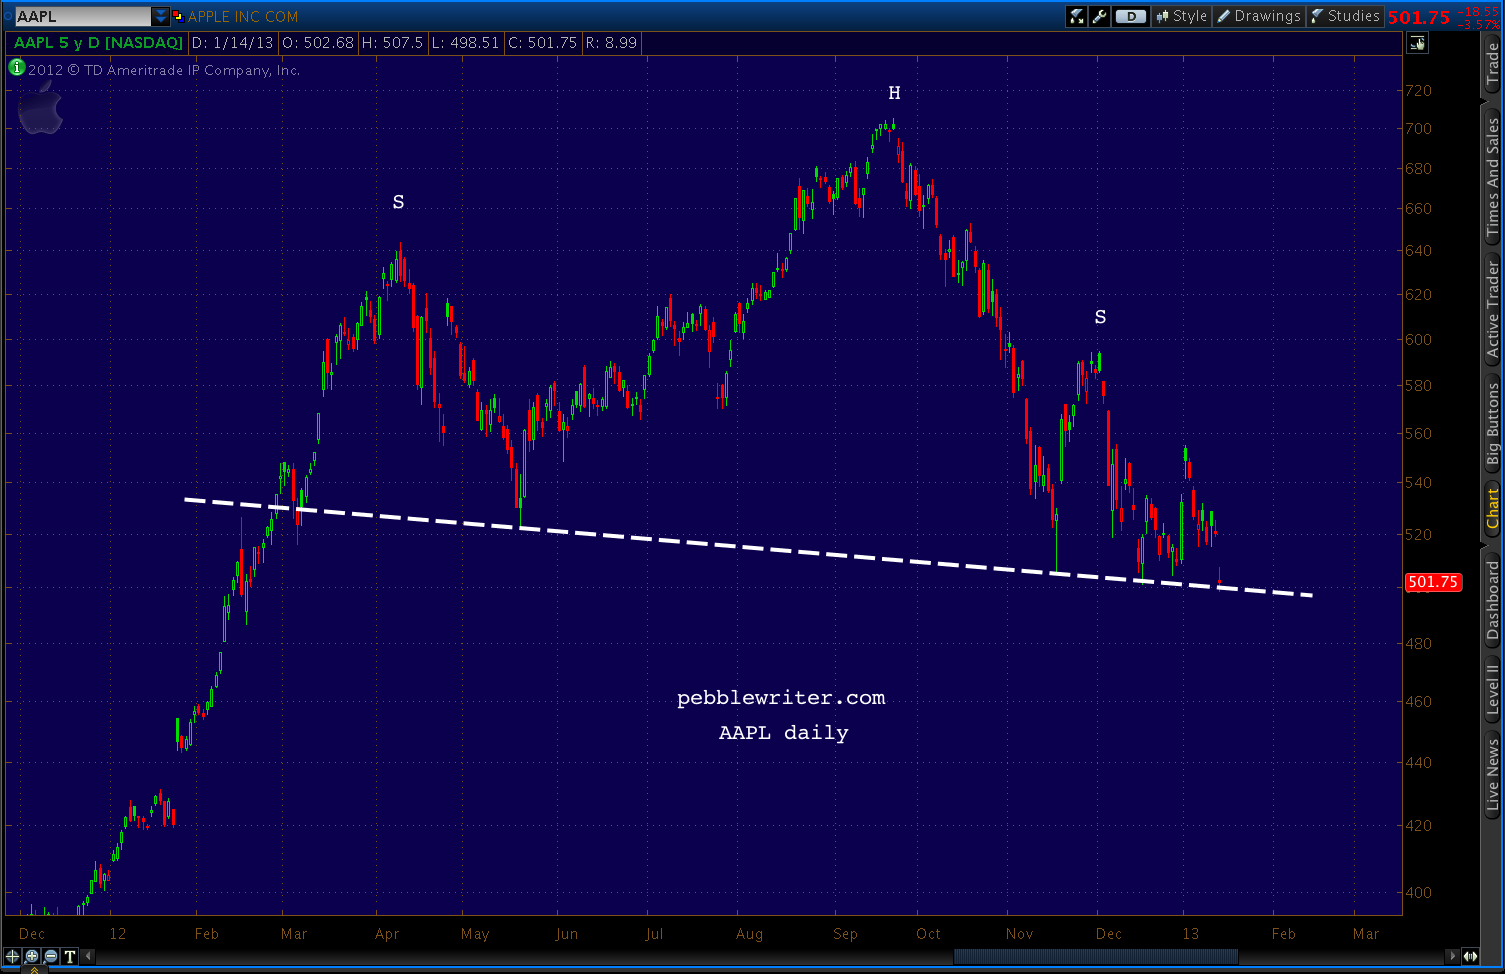
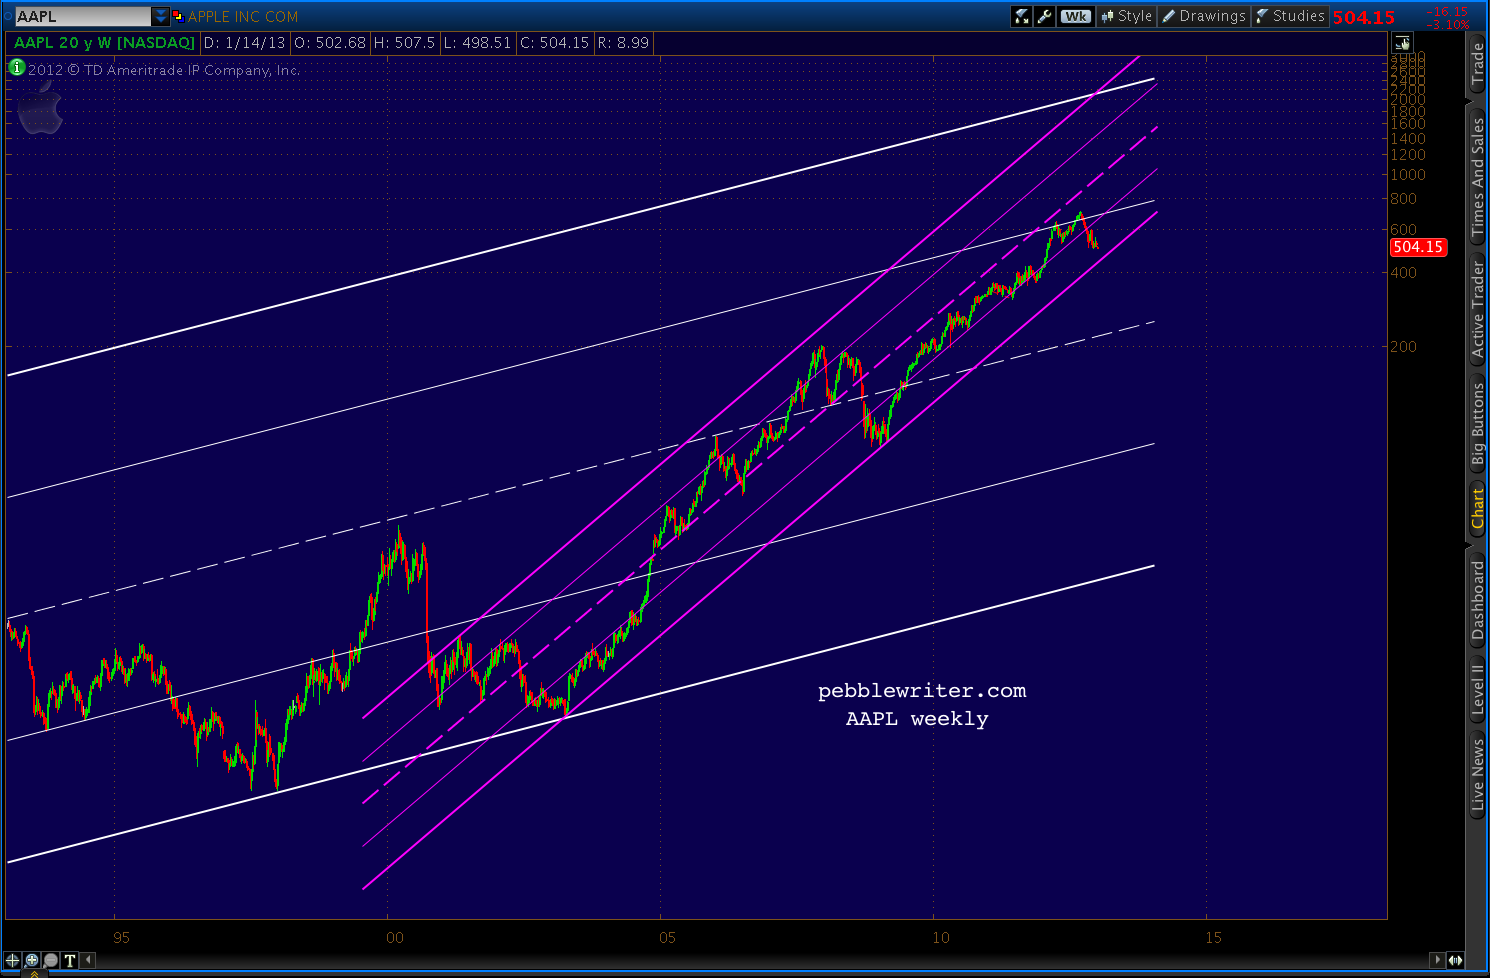
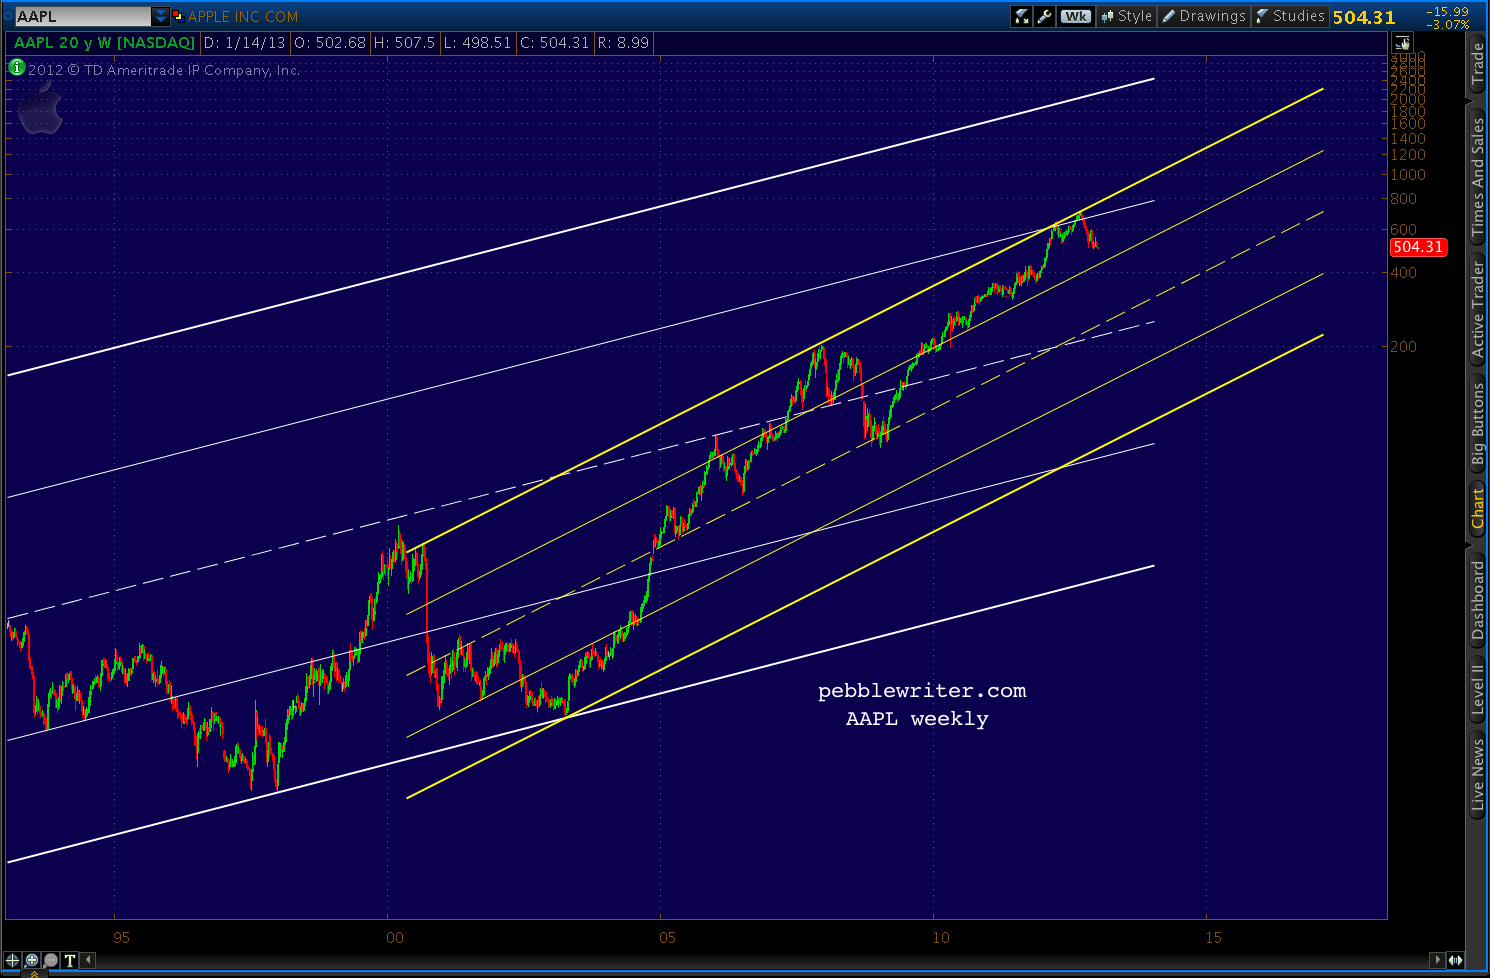
AAPL is up almost 9 points at the moment. A rally past 1426 would take it up out of the falling white channel it’s been in since last August.
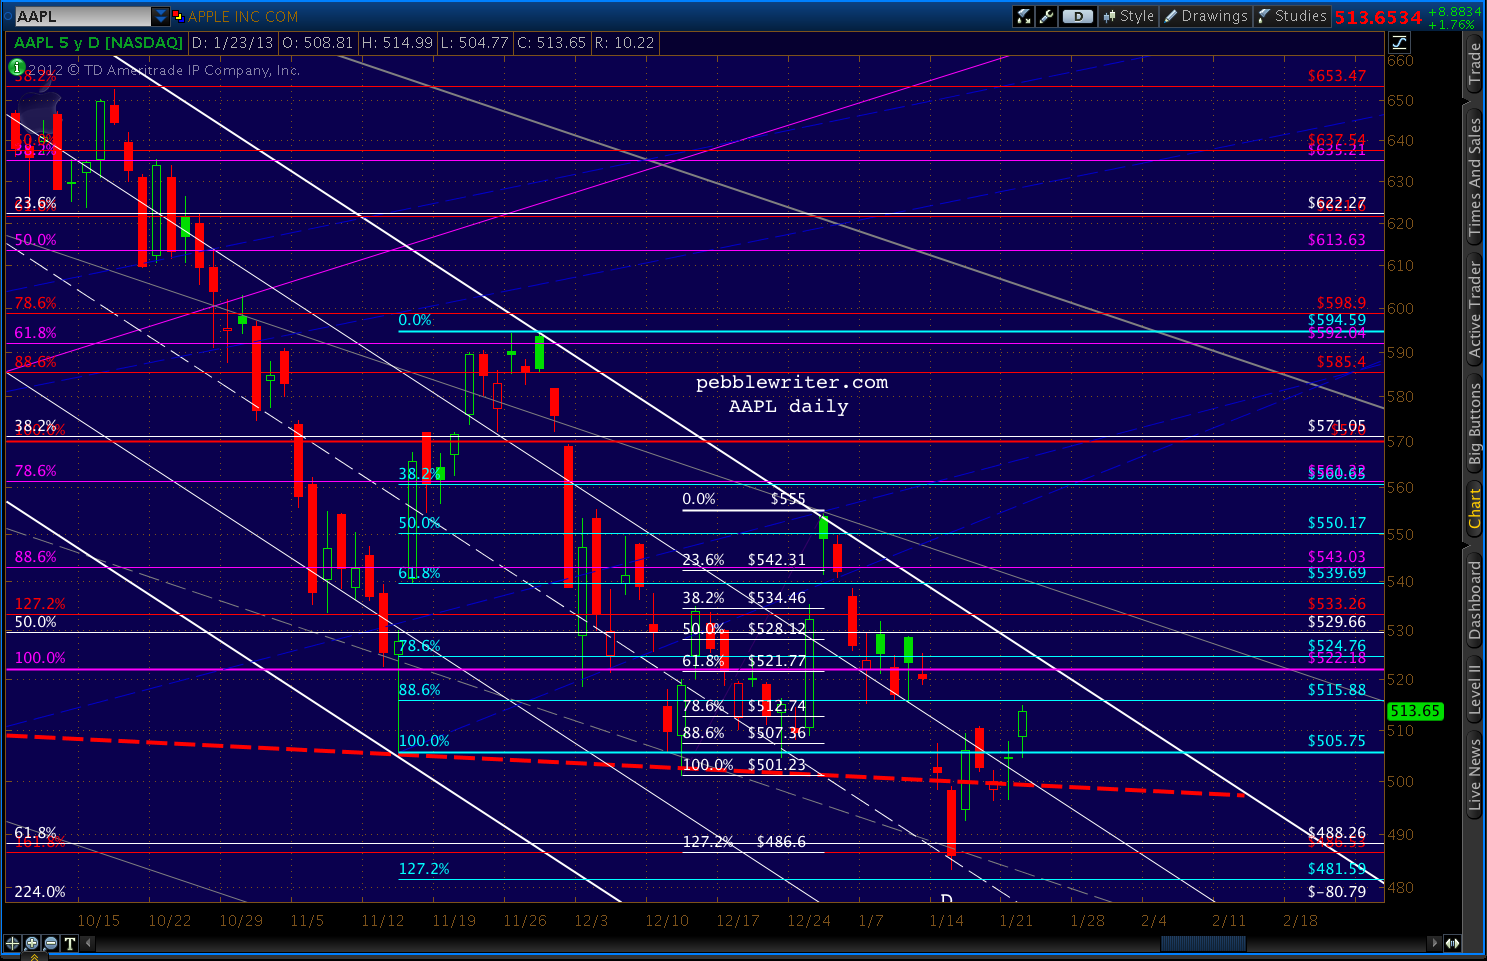 Anything over 515 would take RSI above the white and purple RSI channel midlines. So, as expected, much is riding on the earnings report and how it’s perceived.
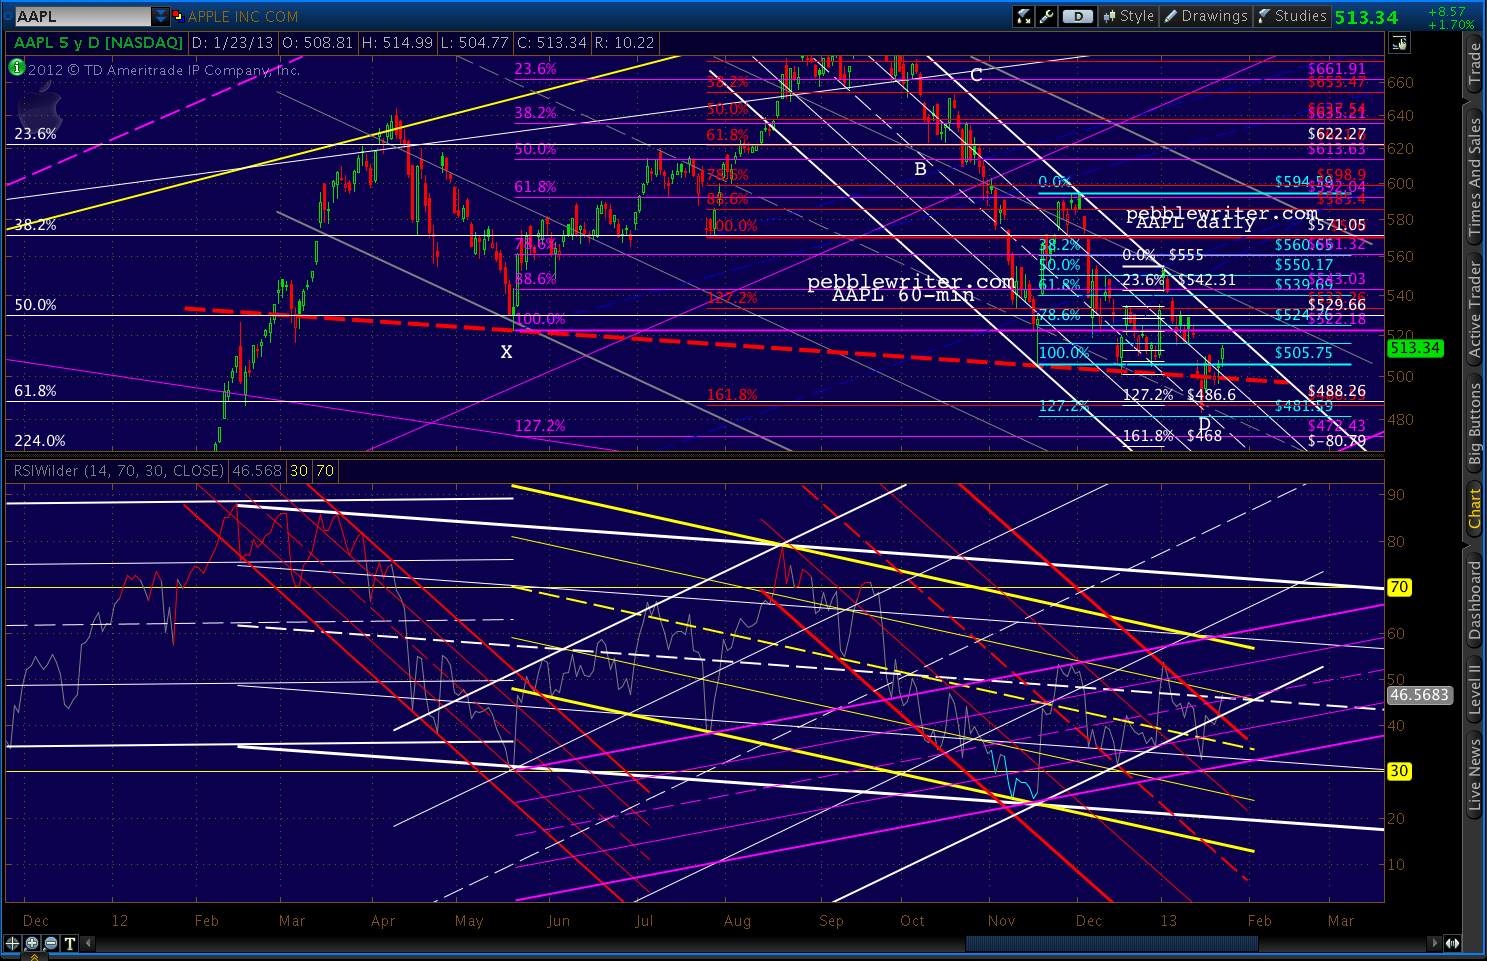
We’ll watch these RSI channels, though. A return to the top of the yellow (and, especially the white) channel would surely spell a reversal.
The Agenda
I think it’s pretty straight-forward — bag an important new high, but without setting the bar so high that expectations can’t be managed. At 1510, SPX clears 1500 but buys some time before the pressure of “will it exceed 1576?” comes to bear (no pun intended.)
Then, get through the budget mess (or, more kicking of the can) and see where we are. If we get a sequester, so be it. The establishment will be well positioned ahead of time and the correction will be managed.
After the shock of it wears off and prices have firmed in the 1200-1300’s, time to establish the next leg higher.
Now, the big question is whether TPTB can engineer such a move without it getting out of hand — as it often does.
Stay tuned.


 This market is just like that great scene from the Bogart & Bacall classic directed by Howard Hawks. Not the steamy love scenes or the chase scene or the tension filled dramatic scenes — but the credit roll at the start of the movie.







 Healthcare will be free for all, but office visits will require the donation of a body part. Social Security benefits will be increased, but will require the conscription of one’s offspring in the volunteer military which, by then, will surely have preemptively attacked Iran (in a bid for energy independence, America will annex OPEC.) And, of course, new SEC regulations will prohibit the selling of stocks.