After roughly $1,000,000,000,000 in QE in 2013, the US added a total of 2,186,000 jobs — if you believe the BLS numbers (surely, none of our readers do.) By my calculations, that comes to roughly $457,000 per job. Just think of the difference a $1 trillion investment might have made in infrastructure, medical research or alternative energy.
Sure, the unemployment rate is down to 6.7%. But, that’s only because the labor force participation rate is down to 62.8% — the lowest in 35 years (the Great Depression’s 50% rate doesn’t seem all that far off.) I heard one commentator explain the participation rate as the percentage of people still looking for jobs. That’s nonsense.
Many years ago, the government stopped counting folks whose unemployment benefits had run out. Adding the long-term and short-term discouraged workers back in, the historically comparable unemployment rate is approaching 25%. From economist John Williams’ excellent ShadowStats.com:
 So, if quantitative easing hasn’t boosted employment, what was the point? Without a doubt, QE has been effective — at inflating asset prices. From stocks to modern art, farmland to Ferrari’s, investment assets have benefited hugely from the huge influx of cash. But, no one has benefited as greatly as have the banks.
Remember when all the big banks went belly up in 2008? The reason you don’t is because the Fed has been throwing money at them hand over fist for the past six years. Most folks know all about the $700 billion from TARP.
But, it wasn’t until November 2011, when Bloomberg won a Freedom of Information Act ruling giving them access to information so secret that even some Fed governors were in the dark, that we learned about the other $7.77 trillion in Fed below-market rate loans (read more HERE.)
Th en, there’s the permission to carry worthless securities on their books at cost, dump said securities on the Fed, write their own rules in the foreclosure debacle, the Madoff debacle, the MF Global debacle, etc., etc., etc. As philosopher George Carlin put it in his own colorful style, you’d think “they own this f&#$ing place.”
Unfortunately, they do — and, at a surprisingly low cost. According to OpenSecrets.org, 2013’s bank lobbying totaled $73 million — a little more than half the amount JPMorgan Chase spent to update its private jet fleet the year it took $25 billion in TARP money.
Perhaps that’s why — six years after the financial crisis began — banks have not been required to deal with the derivatives crisis that threatens to bring the entire financial system crashing down. That probably sounds overly dramatic. It’s not.
Recall that a derivatives contract is an agreement between a financial institution, such as a bank or insurance company, and an entity that wishes to protect itself from a financial risk (e.g., a corporate borrower concerned about rising interest rates, an exporter worried about fluctuations in currencies, an investor concerned about creditworthiness of bonds it buys.)
The total size of the global derivatives market is estimated at somewhere around $1.5 quadrillion. Yes, quadrillion — as in “a quadrillion here, a quadrillion there… pretty soon you’re talking real money.” You don’t see “quadrillion” very often, so I’ll write it out:
$1,500,000,000,000,000
It works out to about $214,000 per every man, woman and child on earth. It’s also equal to over twenty times the combined gross domestic product of every country on earth. If you counted out $100 bills, one each second of every single day, you would reach $1.5 quadrillion in the year 477,659.
The banks will tell you it’s no big deal, because these are notional amounts. They contend the true exposure is much lower after netting — essentially, everyone subtracting out what they’re owed from what they owe. For instance, if I owe you $20 and you owe me $15, we just simplify things and say I owe you a net $5.
 It gets complicated, of course, if you and I both have agreements with lots of other folks. Obviously, I might have trouble paying you what I owe if I can’t collect from those who owe me money.
It gets even more complicated when everyone slices up these agreements into little pieces and sells them to scores of investors or pledges them as collateral.
And, that’s exactly what happened. In fact, by agreeing to protect everyone from higher interest rates, currency volatility, credit risk, etc. (for a reasonable fee, of course) the biggest banks, brokerage firms and insurance companies did quite well for themselves. AIG, for example, made a mint by guaranteeing hundreds of billions in credit default swaps.
 But, as we learned from the AIG debacle (no shortage of debacles, are there?), a guarantor can screw up. It can model the risk poorly, enter too many agreements, misprice its services. AIG bit off more than it could chew.
$58 billion of its $441 billion in credit default swaps were on structured securities backed by sub-prime debt. When the world suddenly realized that most of the sub-prime mortgages underwritten rubber-stamped by the banks weren’t worth all that much, AIG was left holding the bag. Wait, that’s not quite right.
The folks who had netting agreements with AIG were left holding the bag. Fortunately for them, the Federal Reserve came to the rescue and ponied up $85 billion — not for the benefit of AIG, but for all those counterparties with netting agreements. In other words, they prevented the sky from falling. But, did they?
Ah, yes, the $1.5 quadrillion… The seven largest US banks alone report an aggregate $235 trillion in derivatives exposure — 15 times 2012 US GDP. This compares to a paltry $571 billion in Tier 1 Capital. In other words, reported derivatives exposure is 413 times Tier 1 Capital.
 To look at it as would a lender, a mere 0.24% decline in the value of the assets (the $235 trillion in derivatives contracts) would wipe out all Tier 1 Capital. That’s the equivalent of $2,400 equity for a $1,000,000 loan. For Goldman Sachs, the multiple is an astounding 2,404 for a wipeout ratio of 0.04% — $416 equity on that $1,000,000 loan.
Remember, this is reported derivatives exposure. The vast majority of the contracts are over-the-counter. No exchange exists to provide a fair market value, which is left open to the interpretation of the banks doing the reporting. It’s the banking industry’s version of grading your own open-book final exam.
Given the events of 2007-2009, one might think the regulators would be working feverishly to rein in systemic derivatives exposure. Yet, Sunday, we were again reminded just who is in charge of setting the rules.
A key Basel III rule that would have required disclosure of gross (notional) derivatives exposure has been watered down to allow net exposure reporting. By the time the rules are actually implemented in 2018 (if then), don’t be surprised if they are watered down still more.
What might trigger the collapse of the $1.5 quadrillion house of cards? My best guess is Thailand and another Asian financial crisis. The political turmoil surrounding the Yingluck Shinawatra government has been spilling over into the markets. The Baht, already under pressure, is threatening a repeat of its 1997 unwinding.
But, it could just as easily be the eurozone. The markets were obviously unimpressed with Draghi’s latest assertion that the ECB is ready for “decisive action” with “ample resources” and ” all available tools.” These promises are sounding more and more like empty threats as sovereign debt levels continue to climb amid deteriorating employment and trade.
Or, how about the good ol’ US of A? How many more jobs reports like Friday’s might it take for investors to realize that the stock market rally is all about abnormally low interest rates, accounting sleight of hand, share buybacks and excessive liquidity rather than strengthening fundamentals? Does anyone really believe tapering won’t matter?
Regardless of the triggering event, the hell it might unleash — should things get out of hand — could make the 2007-2009 financial crisis look minor by comparison. If the Fed and the Treasury Department can’t stop the sky from falling next time, there might be no banks left to bail out.
* * * * *
Out of necessity, this article merely scratches the surface of the incestuous relationship between the Fed, the Treasury Department, Congress and Wall Street. For more, I highly recommend Matt Taibbi’s Jan 2013 article in Rolling Stone: Secrets and Lies of the Bailout.



 And, presented what I believe to be a compelling chart on Japanese equities last week:
 But, the fact is that almost all of the major indices I watch have reached a natural reversal point from a harmonic standpoint. Many have also completed chart patterns that indicate a reversal is at hand. To wit…
 DJIA has still failed to break out after completing a Butterfly Pattern in late December.
 COMP has almost (98.6% of the way) reached 78.6% of its drop from 5132 in Mar 2000.
 XLF recently retraced half of its 85% drop from 2007 to 2009.
 The Transports are just shy of completing a Crab Pattern at the 1.618 extension.
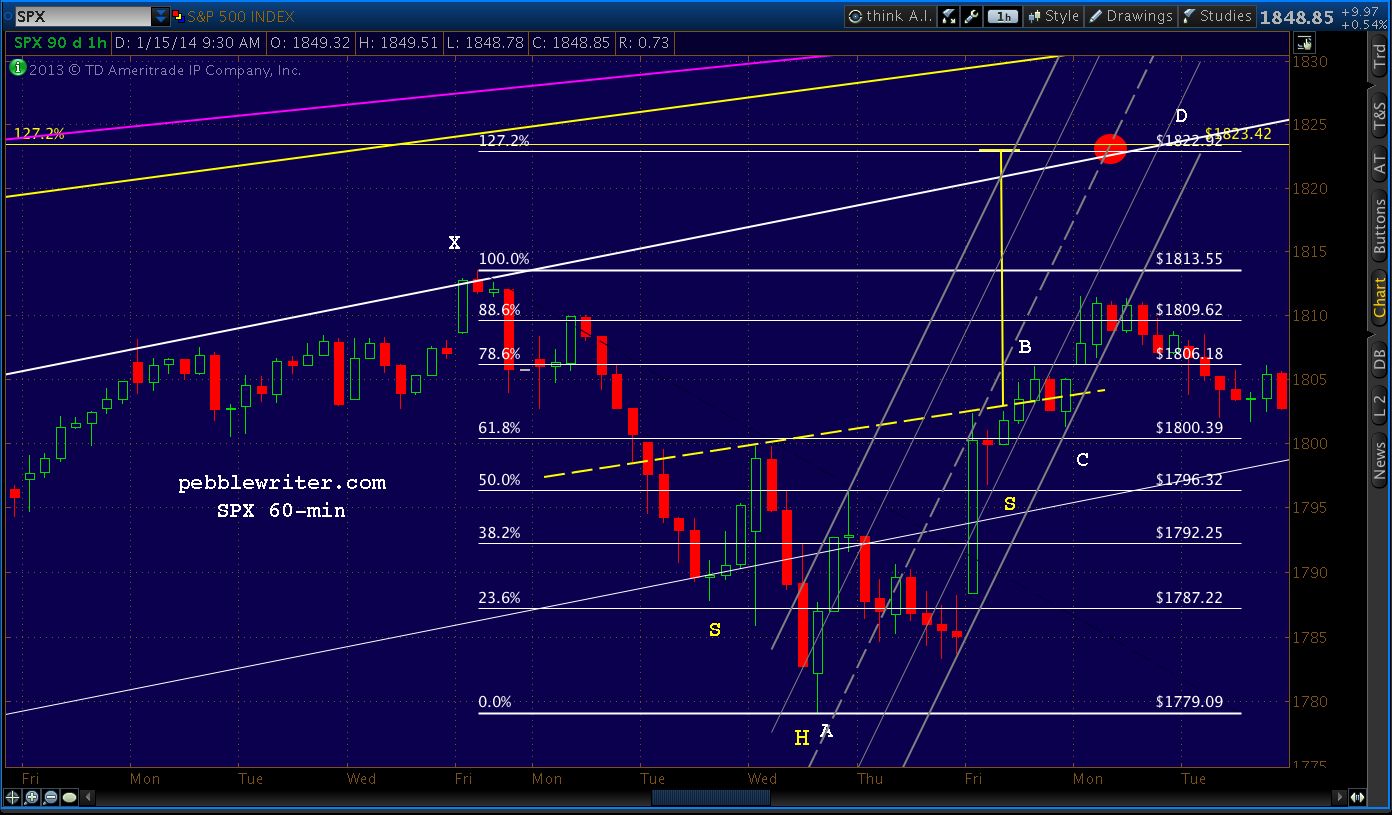
 SPX pushed slightly beyond its Butterfly top of 1823 in order to accommodate a Butterfly completion in ES — but has yet to break out despite numerous ramp jobs in the after market.