ES and SPX are completing a Bat Pattern this morning. Look for a reaction at SPX 1809.62 — the red .886 Fib level. Charts in a few…
continued for members… (more…)
ES and SPX are completing a Bat Pattern this morning. Look for a reaction at SPX 1809.62 — the red .886 Fib level. Charts in a few…
continued for members… (more…)
Today should be all about establishing a Point B for the final Butterfly Pattern. The magic number? SPX 1806.16 (1805.50 on ES.)
How else to explain the market’s euphoria over a taper-quickening jobs report? This morning’s made to order market “response” sent ES scampering up to nail Wednesday’s target. And, it’s hanging in there — at least until the pop and drop.
We’re seeing a Gartley unfold first, which will lead us to the .786 later in the day. Look for the IH&S we’ve been expecting to set up after the pullback from 1801.58.
Making a slight adjustment to the IHS. The pullback shouldn’t be all that great, as we’ll probably reach SPX 1806 at the close, leaving latecomer bulls who hold long over the weekend with a disappointing opening on Monday — one last shake down before the climax next week — probably Wednesday.
The eminis are a little trickier. If they’re to reach their 1.272 at 1837.26, it’ll have to happen overnight or over a weekend. With an extra 15 minutes at their disposal, they could easily tack on an extra few points to reach the white .886 at 1808.53 today — even if SPX only reaches the .786 at 1806. If not, Sunday would do nicely.
SPX could also push past to its own .886 at 1809.61, which would be a great head fake as it would signal the 1.618 extension at 1834. Bottom line, be careful. If you intend to hold long over the weekend, keep in mind that this whole move is an precision exercise in manipulation. It has been very carefully crafted to separate you from your money.
UPDATE: 1:50 PM
SPX just reached the .786. Well…almost reached it. By coming up just a few pips short (1806.4 versus 1806.16) they can justify a last-minute rally to close at a high point.
The day’s high for SPX: 1806.04 versus our 1806.16 target. For the e-minis: 1806 versus our target of 1805.05. Close enough for government work.
I have some very interesting charts to post regarding the implications of completing the big Butterfly Pattern. As mentioned before, there are two versions: mildly upsetting, and leaping- from-windows ugly. I’ll try to get them posted later this afternoon.
The market’s hanging in there, finding support at the purple midline and a red channel line after retracing completing a bullish Bat Pattern yesterday. The bulls need ES 1786/SPX 1785 to hold.
continued for members… (more…)
INITIAL POST: 9:20 AM
Between bank downgrades, the ADP report and a raft of bearish analogs floating around out there, it’s a tough day to buy the dip. But, that’s exactly what the charts, particularly a rather bullish analog, are telling us to do.
Look for the eminis to potentially tag the white .786 at 1782.63 and for SPX to bottom out at current levels (1785.91.)
continued for members… (more…)
The rising wedge is broken and ES is nearing our first target from yesterday. Have we already topped out?
continued for members… (more…)
I hope everyone is enjoying a relaxing holiday weekend. Equity markets close at 1PM EST today.
Most of the indices and currencies we watch have been coiling — tracing out triangle or flag patterns this past week. A break out is now imminent, but it will be a trap.
continued for members… (more…)
Do you love this rally? Are you ready to throw caution to the wind and plow every last cent into stocks? If your answer is “no”, you’re in good company.
Triangles are all about indecision. And, we’ve got plenty of that. Jumping in at all-time highs feels just plain insane — despite the cheerleading from the boob tube crew.
Yet, there’s a little more upside left — or, so say the harmonics. We just need to break up through this triangle…and then navigate the mine field of harmonic and channel resistance that awaits.
The important patterns at the moment are:
Since the .886 and purple midline are both around 1808, we’ll keep a close eye on things there.
The dollar’s harmonics suggest a sizable drop to 80.06 or so. But, there’s the possibility that this counter wave will extend a little further to the channel top before selling commences.
ES broke up through the triangle top, reached 1807.50, and is currently back-testing. One word of caution: what happened yesterday with the break above the IH&S neckline could happen again.
The 1798 level has attracted a tag twice now. A third tag at the white channel bottom later today (the purple circle) would make for a well-formed flag pattern… and, flush out all the weak bulls sitting in traffic or on a tarmac on the way to Grandma’s, secure in the knowledge that their stops will protect them.
UPDATE: 12:00 PM
DX just tagged a TL connecting the last two tops and the purple channel midline. And, the red .618 is just above at 80.819. A reversal should be close at hand.
Interim target?
Another day, another case of whiplash. The dollar is indicative of the volatility — a downtrend to the white .886 that reversed back up to the .382 before heading lower, right? After retracing about 101% of Sunday’s low, it reversed and regained the white channel — only to abandon it again this morning.
The EURUSD has been almost as schizophrenic, reversing after completing a Bat Pattern — but failing to break out after the catch at the white .500.
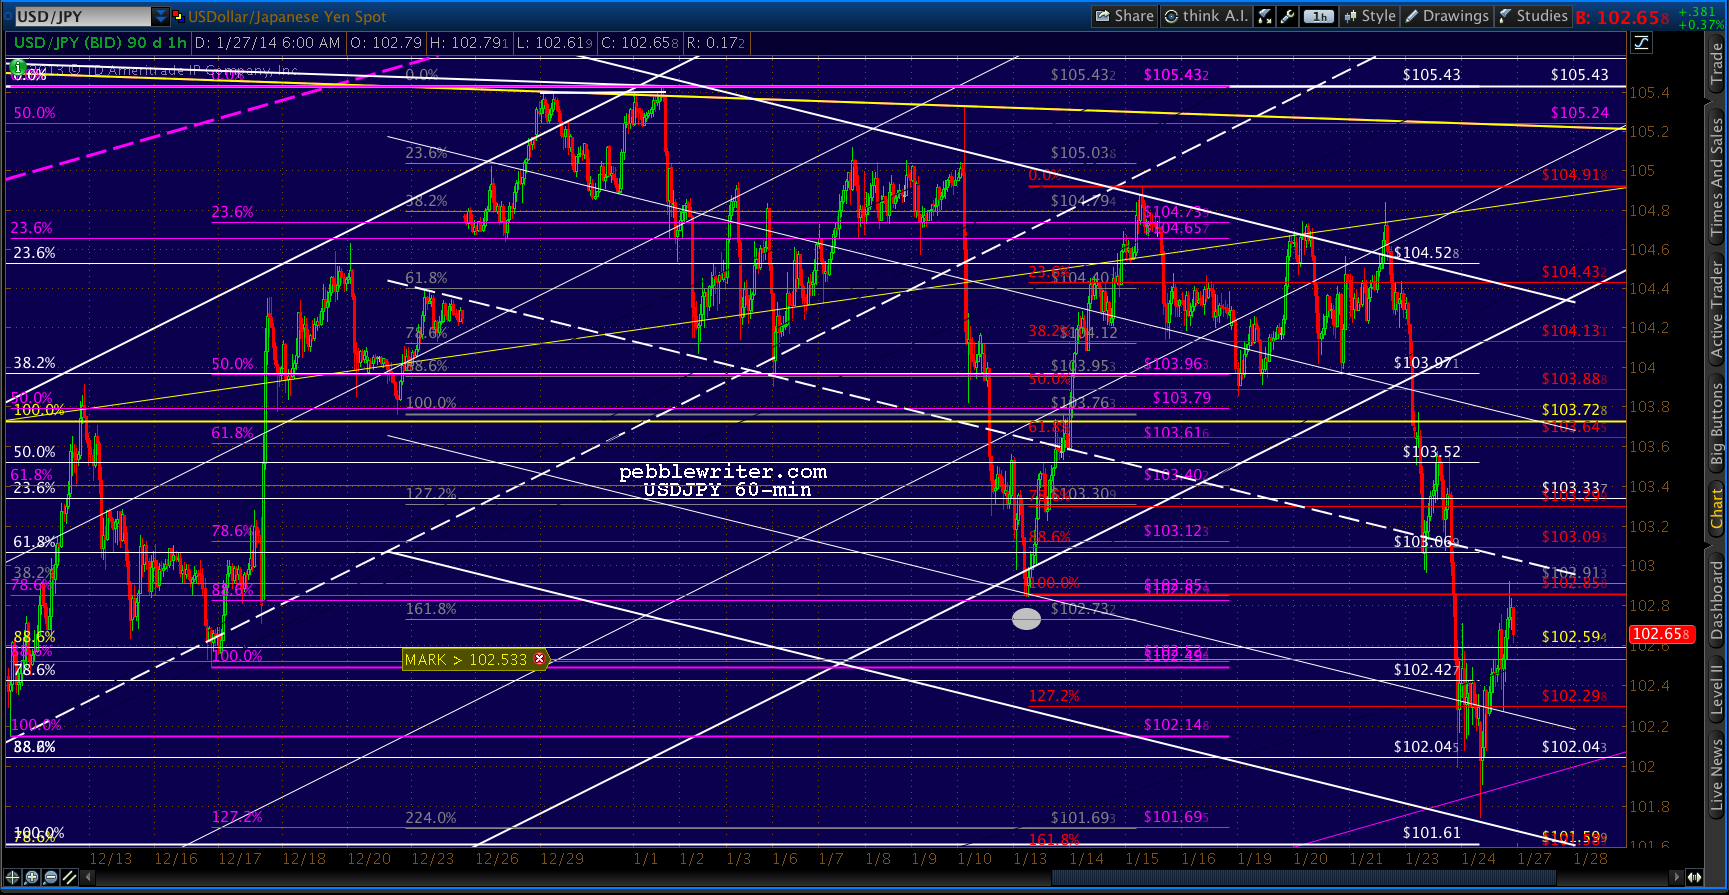
The USDJPY broke out of a very well-formed channel (in white below) a few days ago with an even better-looking channel (in purple), only to put in a backtest that’s a full-on nail biter.
Then, there’s the equities markets…we’ve got dueling H&S Patterns (both bullish and bearish), violated Harmonic Patterns and violated channels coming at us right and left.
This morning’s post-consumer confidence plunge (completing an H&S Pattern) probably had more than a few bulls reaching for the sell button. But, it stopped .25 shy of yesterday’s low and recovered the neckline in a matter of minutes.
Things are on track for the big Butterfly pattern to complete very soon — even as soon as later this morning.
For those who have been following this website for any length of time, this is a major milestone we’ve been anticipating since Mar 29, 2012 — shortly after this website was launched [see: All the Pretty Butterflies.]
The S&P 500 is one of many major indices approaching or reaching important Fibonacci reversal levels, as we discussed last week [see: Around the World.]
To recap the current state of affairs…
- The Nikkei reached 15,597 this past Friday.
- The NYA already came within 13 points of our 10,239 target.
- The DJIA is only 200 points from our 16,300 target.
- The FTSE 100 is only 6 points away from our 677 target.
- And, SPX is only 15 points away from the 1823 target.
It bears repeating that these harmonic targets — being so large and from such a long time ago — rarely provide on the nose reversals. The April 2010 reversal, after climbing from 666 to 1219, came up 9 points short of the .618 Fib level.
The May 2011 Gartley Pattern completion came up 11 points shy of the .786. The September 2012 Bat Pattern completion, on the other hand, overshot the target by a couple of points.
Bottom line, when you’re within 1% of a target after a 1,142 point move (from 666 to 1808) it’s hard to predict exactly where things will turn. It also bears repeating that these patterns, though not known to all, are known to many large institutions that — with relatively little money — could decide to blow them out of the water if it suits them.
These are the same institutions which have a very strong vested interest in a market that never, ever declines. They peddle mutual funds, underwrite stocks and bonds, facilitate M&A transactions, and have huge trading books of their own (not to mention trillions in derivatives.)
With the Fed throwing free money at them, how hard would it really be to run prices up past a key resistance level? We’ve seen it happen many times in the past year alone.
As always, trade safe. Volatility will be elevated this week.
UPDATE: 9:40 AM
ES just backtested the purple channel midline and should be headed for the red 1.618 at 1815.35 as soon as SPX fills this morning’s gap (1804.84.)
SPX gap almost filled, should flesh out the rising white channel.
ES and SPX are a little out of sync. ES overshot the purple midline, and has been straddling it ever since — hinting at a backtest of the last minor top at 1800ish or the white .500 at 1800.67.
ES just reached 1800.50, which should offer decent support. As mentioned earlier, we should see a reversal here. If it slips any lower, the next support is at 1798.59.