Posts

  • End Games

    Don’t look now, but the Butterfly Pattern generated by the drop from 1576 in October 2007 to 666 in March 2009 is a handful of points from completing.  We’ve discussed this target for over a year [see: The World According to Ben.] It’s hard to believe it’s finally here.

    Will we get a 1973-style response [see: Butterfly Warning] or something more muted?  Will the same knuckleheads who tried to portray throttling back the Fed’s magical money machine as a good thing pull out all the stops…again?

    The caveats:

    • SPX probably won’t stop at 1823.42 on the dime; that rarely happens
    • at 1823, it’s already plenty close enough
    • it could overshoot 1823 a bit; 10 points is a common margin of error
    • TPTB could keep things going and bust right through 1823 if they so choose
    • even if this proves to be an important top, it won’t necessarily plummet

    I’d be comfortable taking a short position right here at 1817, as the purple channel seems to offer good nice resistance at the white channel intersection. But, it’s a steep channel, and SPX could continue bumping up along the underside of it for the rest of the day, easily tacking on the extra 6 points.  I show the top of the purple channel intersecting with 1823 at around 3:15PM.

    The red channel is from a couple of weeks ago based on several similar previous channels.  But, the purple channel has almost as strong a pedigree.

    ES is also a few points from a pattern completion — a Crab Pattern on a much smaller scale.  Its Big Butterfly is way up at 1837 and obviously wouldn’t be reached during regular market hours if SPX does reverse at 1823.

    Furthermore, the DJIA Big Butterfly is still a few points away: 16,300 versus its current 16,250.

    UPDATE:  2:00 PM

    SPX just tagged 1823.42.

    In fact, the global market targets we posted about a month ago [see: Around the World] have generally been reached:


    Index Nov 20 Target Result
    Nikkei 225 15,597 15,870
    FTSE 100 <6875 <6875
    NYSE 10,239 10,229
    SPX 1823 1823
    DJIA 16,300 16,286


    One indicator I look at in various time frames is the RSI.  I don’t care so much about the actual value, but how it moves in relation to past moves.  I discovered a long time ago that, just like prices, its movements often form channels.  It’s a little like reading tea leaves or throwing monkey bones, but it works for me.

    Note how, on the 60-min RSI chart for SPX, the swings in RSI followed the rising purple channel to a point, then switched over to the falling white channel.  In the midst of the transition, a new channel has been established – shown below in red.

    If SPX reverses at 1823 as I expect, RSI will fall back below the top of the red channel and confirm the downtrend.  We can watch its progression relative to the purple, white and red midlines.

    What’s really interesting to me, however, is the daily RSI chart:  The rising white channel is pretty obvious, and has been consistent with the series of higher lows in SPX.  No divergence here.

    But, consider the peaks in RSI.  As seen below, they can be connected with a falling channel line.  The prices are rising, but the relative strength is falling.  This, of course, is marked negative divergence — and, it has been known to spoil more than a few bullish parties.

    Here’s the same chart with prices.  Note that it’s not the tag of the yellow channel top that’ll kill a bull market.  That just gets the ball rolling.  It’s the subsequent falling channel — usually around the 5th tag or so.  And, if a peak should fail to even reach the trend line, such as July 2011 at 1347 — watch out below.

    Here’s a close-up of the past year.  Note that RSI is currently bumping up against the white channel midline, the purple channel top (arguably a little ragged) and the red channel top — all at about 5 tags of the red channel top after the yellow top tag at 1729.

    If you’re a bull, this is a good reason to lighten your load.  If you’re a bear, this is a good reason to get very, very short — especially in light of the biggest Butterfly Pattern completion since 1973.

    Not that there are any similarities or anything…

    Anyone happen to notice the nice bottom in VIX yesterday and today?

    I’ll update several more charts over the weekend, but here’s a little taste…a nice juicy Crab Pattern in RUT.

    Have a great weekend, everyone.


  • Charts I’m Watching: Dec 19, 2013

    I suppose yesterday would rank right up there as one of the more impressive dip buys ever.  It was not, as the talking heads would have you think, the market’s acceptance of the taper as no big deal.

    From yesterday’s Bye-Bye Ben:

    My expectation?  Whether they taper or not, TPTB are standing by with buckets of cash to buy any dips that appear.

    And, that’s exactly what they did — the better to sell investors on the idea that everything’s just fine, that the market won’t miss that $10 billion/month or any amount they decide to taper.

    Just in case the message didn’t get through… today’s a big POMO day.  Trade safe.

    *  *  *  *  *

    The futures are digesting some of yesterday’s gains.  Looks like we have most of an A-B-C with the B and C of the C leg maybe down to 1790ish?

    While the dollar is following the path we laid out with uncanny precision.

    continued for members(more…)

  • Bye-Bye Ben

    Finally, the day we’ve all been waiting for.  Will they or won’t they?  Who knows?  But, it’s pretty clear, from watching the talking heads over the past few days, what the script is:  bring on the taper, but paint it as a non-event because the economy is strong enough to take it.

    We can argue about whether the economy really is that strong, and whether inflation is an issue.  But, there’s little argument that today’s decision will impact the markets.  My expectation?  Whether they taper or not, TPTB are standing by with buckets of cash to buy any dips that appear.

    If you’re a bull, I wouldn’t worry so much about an immediate sell-off (though stops are always a good idea), but I would be concerned about what the market does after the cash infusion spike — especially if SPX tags 1823.

    Tomorrow’s a big POMO day.  But, there’s more to worry about than just tomorrow.  As always, I’ll trade where the market is going, not where it should go.

    US equity markets are relatively quiet this morning, settling a bit after fleshing out a triangle as expected.

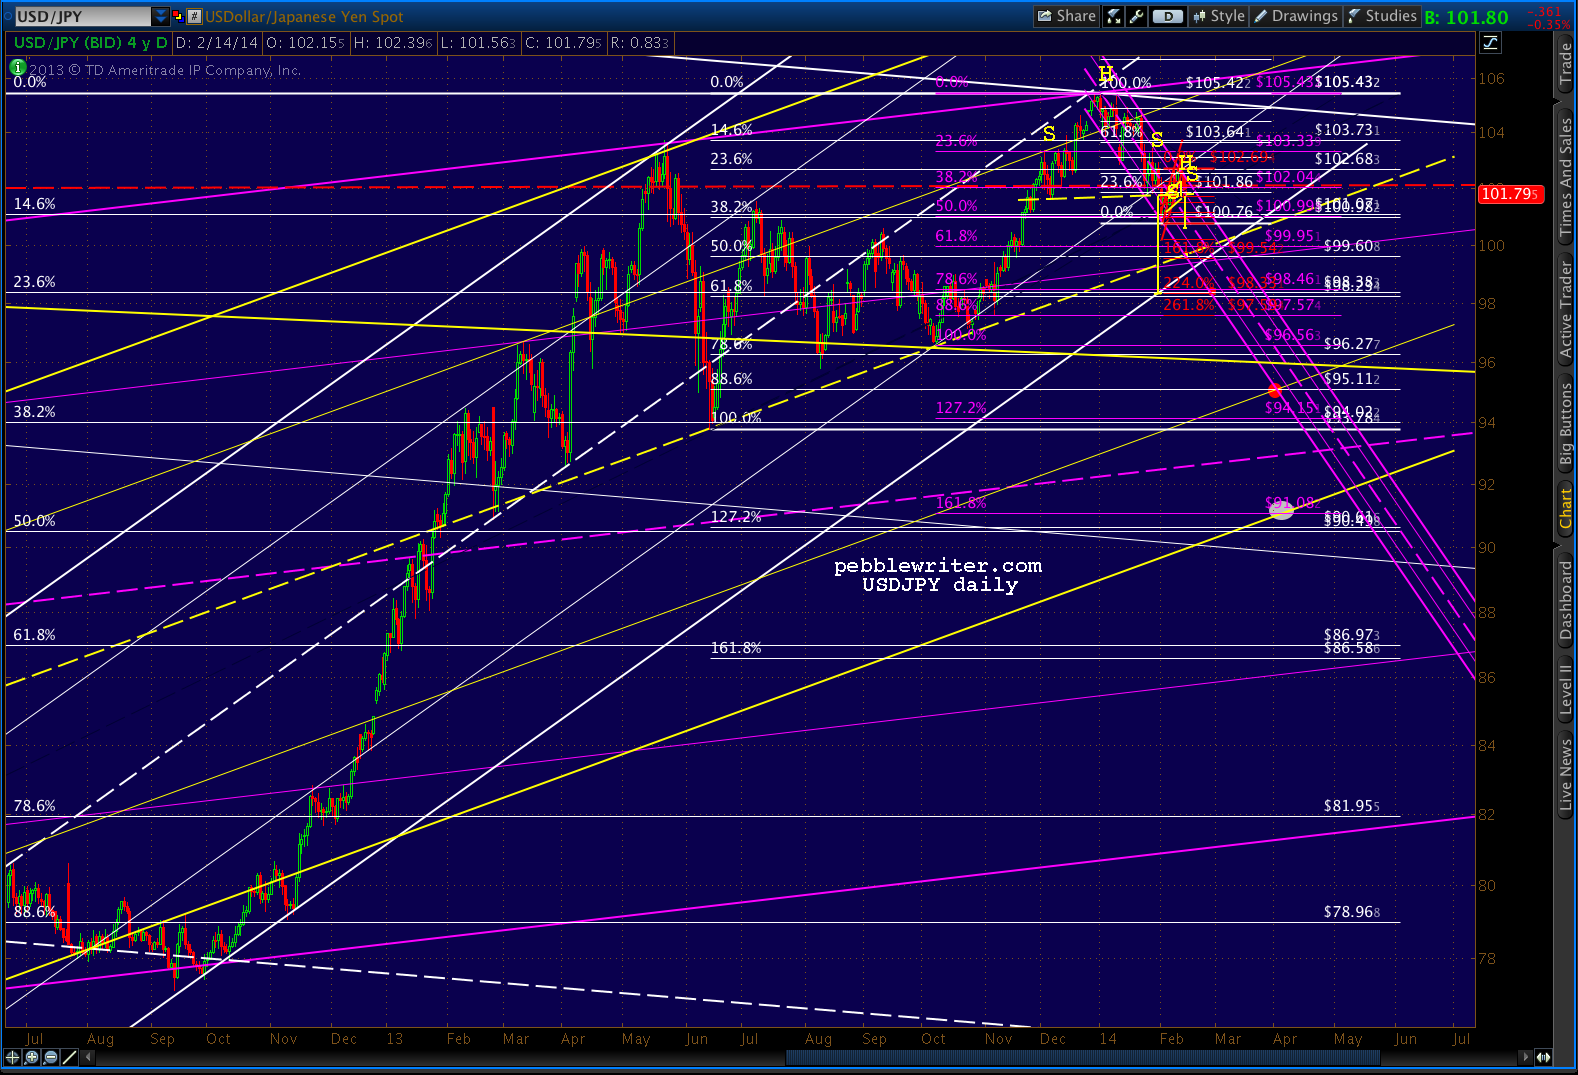
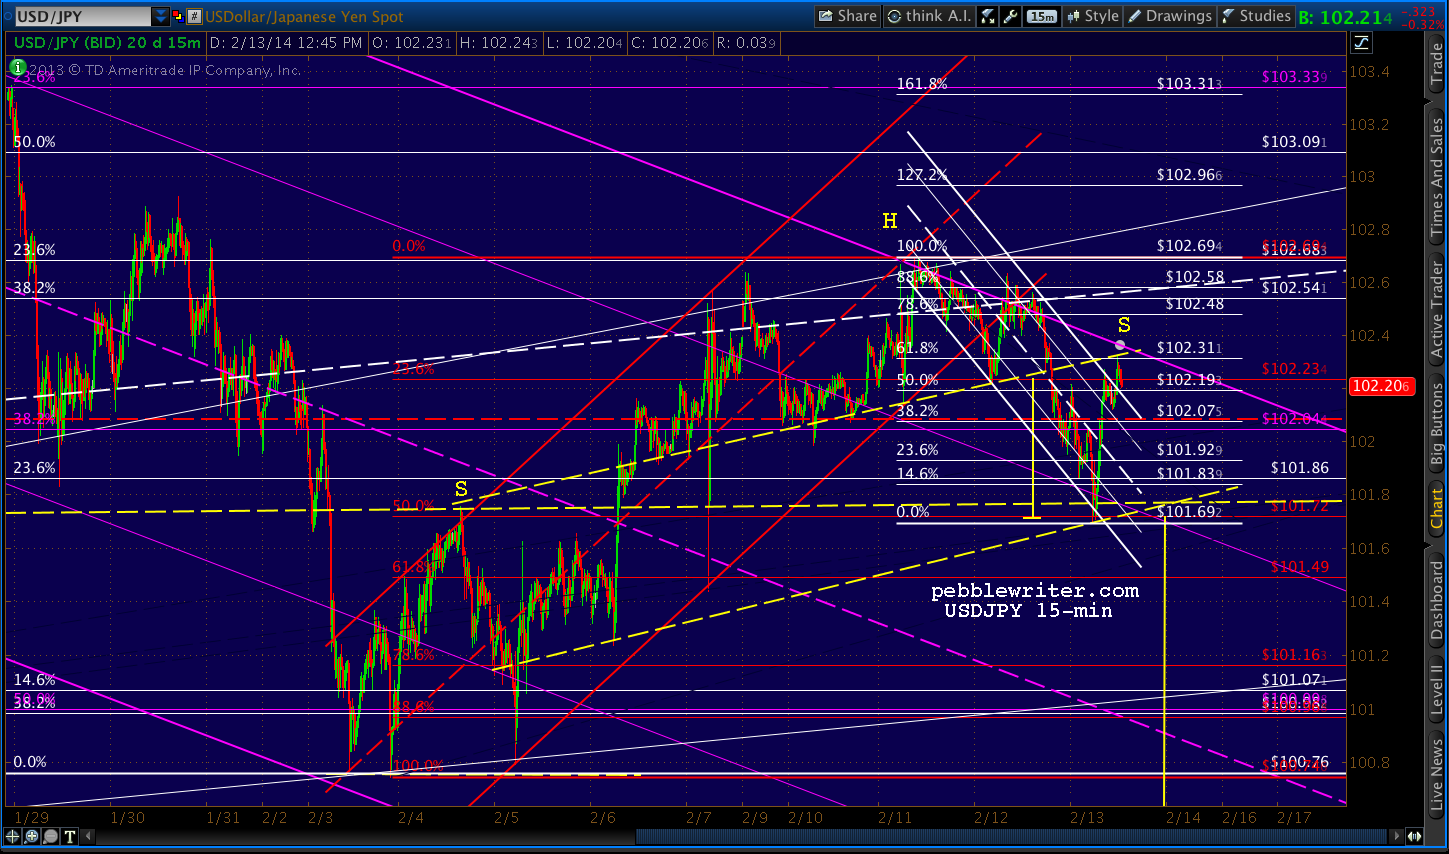
    The USDJPY is retreating after hitting channel resistance in this post new-high week.

    While, the dollar looks like it could break either way — probably sinking, then soaring.

    Yesterday, VIX tried to break out of the white channel but fell back in line.

    UPDATE:  1:53 PM

    Should get the announcement in a few minutes…  Do or die time.  Some targets in either direction…

    The close-up:

    continued for members(more…)

  • The Final Stretch

    Despite yesterday’s overnight dump and subsequent rally, the path to the Butterfly completion is still very much intact.  Though, it bears repeating (the 50th time?) that we might have already seen the top last week at SPX 1813.

    continued for members(more…)

  • Charts I’m Watching: Dec 16, 2013

    All eyes on the Fed this week, of course.  The usual course is a triangle, narrowing as we approach the moment of truth.

    Note the overnight stick save on ES, back above the neckline and channel mid-line.

    And, the bump at the bottom of the red channel for USDJPY — after the new high last week.

  • Charts I’m Watching: Dec 13, 2013

    Happy Friday the 13th everyone.  Yesterday we looked at an interesting bullish path that, given the price action overnight, is in serious danger of fizzling.  This morning, we’ll turn to the bearish case that represents the more obvious scenario to play out.

    Setting aside everything else, the two H&S Patterns we’ve been watching have confirmed, and still point to SPX 1755-1760.  Even what’s left of the overnight rally won’t get prices back above the neckline.

    As we discussed yesterday, this is the obvious case.  Yet, I can’t tell you how many times over the past 8 months the obvious bearish case failed to play out.  Normally reliable patterns have been beaten silly by overnight ramp jobs, etc.

    In fact, if the market holds these levels, there’s still a legitimate path to our Butterfly Pattern targets. And, did anyone happen to notice the USDJPY made a new high yesterday?

    The key for equities is SPX 1780 — the neckline.  If it acts as a lid on this little rally, watch out for 1755.  If the market pushes through and negates the pattern, then all is well in the Fed’s Fun House.

    Stay tuned.


  • What’s Wrong With This Picture?

    As discussed very early this morning, the H&S Patterns on SPX and ES have completed.  The downside course is clear. The neckline is the same slope as all the other juicy H&S Patterns of the past few years (really!) and it bears a strong resemblence to the H&S Pattern of

    SPX came within 10 points of its Fibonacci target — same as occurred in April 2010 and May 2011 before those big downturns.

    SPX already broke the Dec 4 and Nov 20 lows, so the bullish harmonic scenarios are rather limited.  ES, on the other hand, stubbornly refused to play ball — staying north of 1774.50 until just a moment ago.

    It finally cut loose, only to stop way down at…wait, 1771.75?  That’s not even 3 points.  It isn’t even a Fib level, for crying out loud!  Or, is it?

    Turns out 1771.75 is one of those magic numbers that the bulls are hoping can turn the tide.  It’s also one of those moves that MM’s live for, that are so meticulously well-planned that they separate all but the most paranoid traders from their hard-earned money.

    continued for members… (more…)

  • Charts I’m Watching: Dec 11, 2013

    ES reached our interim goal of 1799.50 overnight.  Is there more to come?  The currencies are mixed.

    The EURUSD, a completed Bat Pattern at a long-term channel midline…

    continued for members(more…)

  • Charts I’m Watching: Dec 10, 2013

    Nice little sell-off on ES, reaching potential support at the channel midline near 1800.  This will delay the march to 1823, as the red channel obviously is  now obviously kaput.


    Like the USDJPY, this is a small scale double-top after a rather anemic reaction at the .786 and .886.

    continued for members(more…)

  • Butterfly Warning

    While much of my trading is driven by swings lasting only days or hours, occasionally we arrive at one of those critical junctions that’s been years in the making.  For the S&P 500, 1823 is one of those levels.

    This is the culmination of a huge Butterfly Pattern, the 1.272 extension of the drop from 1576 in Oct 2007 to 666 in March 2009.  I’ve been watching it for months, as has anyone who takes Harmonics seriously.

    The previous significant reversals on the harmonic scale charted above ranged from mild to severe.  And, note that 2 of the 3 came up 10-11 points shy of their projected turning point.

    • 17% drop from the .618 Fib level in April 2010
    • 22% drop from the .786 Fib level in May 2011
    • 9% drop from the .886 Fib level in September 2012

    Butterfly Patterns require a significant reversal at the .786 Fib level, and the 22% drop from May – Oct 2011 certainly qualifies.  However, they can extend to either the 1.272 or the 1.618 Fib level.  In other words, the real damage might await us at SPX 2138.

    In a heavily manipulated market such as we now have, this turn of events would surprise no one.  Take a nominal breakthrough in the budget deal, pour a little more QE on it, sprinkle in an overnight ramp job or two and we could slice right through 1823 as we did 1576 (the potential double-top.)

    If the market does react, however, the implications range from minor (off 5-6% to 1700 or so) to huge.  How huge?

    Many investors have seen the comparisons between the current market and 1929.  But, the last major sell-off after completing a Butterfly Pattern was in 1973.  The S&P 500 dropped 48% between January 1973 and October 1974.

    While we wait for 1823 to show its colors, I’ll look more closely at the strengths and weakness of this potential analog (see more on analogs and their effectiveness HERE.)

    Stay tuned.