Posts

  • Charts I’m Watching: Nov 11, 2013

    Today is Veterans Day in the US.  It began as Armistice Day in 1918 to celebrate the end of “the war to end all wars.”  Unfortunately it wasn’t the end, so Armistice Day evolved over the years to honor America’s veterans for their patriotism, love of country, and willingness to serve and sacrifice for the common good.

    It’s a good reminder to reach out to veterans you know, or even one who’s a total stranger, and thank them for their service.  The cushy life we live wouldn’t be possible without them.

    If making a donation is more your style, my personal favorite is the Michael J Novosel Foundation.  Mike Novosel began combat service as an Army bomber pilot in World War II and ended up a medical evacuation (Dustoff) pilot in Vietnam.

    He and his son Mike Jr. flew together in the same unit and rescued one another — each, after the other was shot down — only a week apart in 1969.  I had the honor of knowing them both.

    Mike Sr was shot down after flying fifteen times into a Viet Cong training area, without air or ground support, to rescue 29 South Vietnamese soldiers who were pinned down by machine gun and mortar fire.

    In Mike’s opinion, there was nothing extraordinary about this mission.  It was similar to many of the other 2,542 missions in which he rescued 5,589 wounded during his two tours.  The army disagreed, and he was awarded the Congressional Medal of Honor.

    We toss around the word “hero” much too lightly.  It cheapens the whole concept.  In my opinion, Mike Novosel set the bar exactly where it should be: a selfless dedication to others, regardless of the personal risk.

    *  *  *  *  *

    Nothing has changed since Friday.  SPX got within .53 of the .886 of its drop from 1775 to 1746…

    …while the e-minis came within 1.42 of its .886.  We’re seeing a reaction as a result of being close enough to a Bat Pattern completion, but whether we’ll get one last little push or not is anyone’s guess.

    I suspect we will, as there was very little in the way of wave action on the way up. If so, the targets are ES 1770.17 and SPX 1771.31.

    The dollar is loitering near the red channel it just backtested at the white channel midline, which makes it a candidate for a fresh leg back below 80.

    UPDATE:  10:10 AM

    Both just reached their 886, so we should see some downside here.  As always, the question is “how much?”

    ES is at the midline of the redrawn channel, so my best guess is the red .146 line where it intersects with the .618 at 1759.98.  But, I’d keep stops just above the 1774.50 high just in case there isn’t much of a reaction at all.

    A more drawn-out affair could target the falling white midline late tomorrow afternoon at 1754.50.

    SPX’s channel is much better defined than ES, and suggests a lesser drop to the .786 at 1768.48 might be all the downside in store.

    continued for members... (more…)

  • Charts I’m Watching: Nov 8, 2013

    The e-minis bounced at an .886 Fib level of a not very well-formed harmonic pattern, so a reaction here is less than certain.  A second H&S pattern has also completed and the red channel has broken down, but could be widening as occurred in late July-early August.

    SPX needs to tag 1744.46 in order to complete a Bat Pattern.  Unlike ES, yesterday’s high didn’t exceed the Oct 30 high.  So, this is a normal, legitimate pattern with just a bit of hair on it: a less than perfectly defined Point X of inception.

    Yesterday’s close on a negative note clearly stretched SPX’s rising red channel — perhaps more than it can handle.  But, today is a bigger than normal day for QE: $4.25-5.25 billion in outright purchases.  The last such time led to those Oct highs mentioned above.

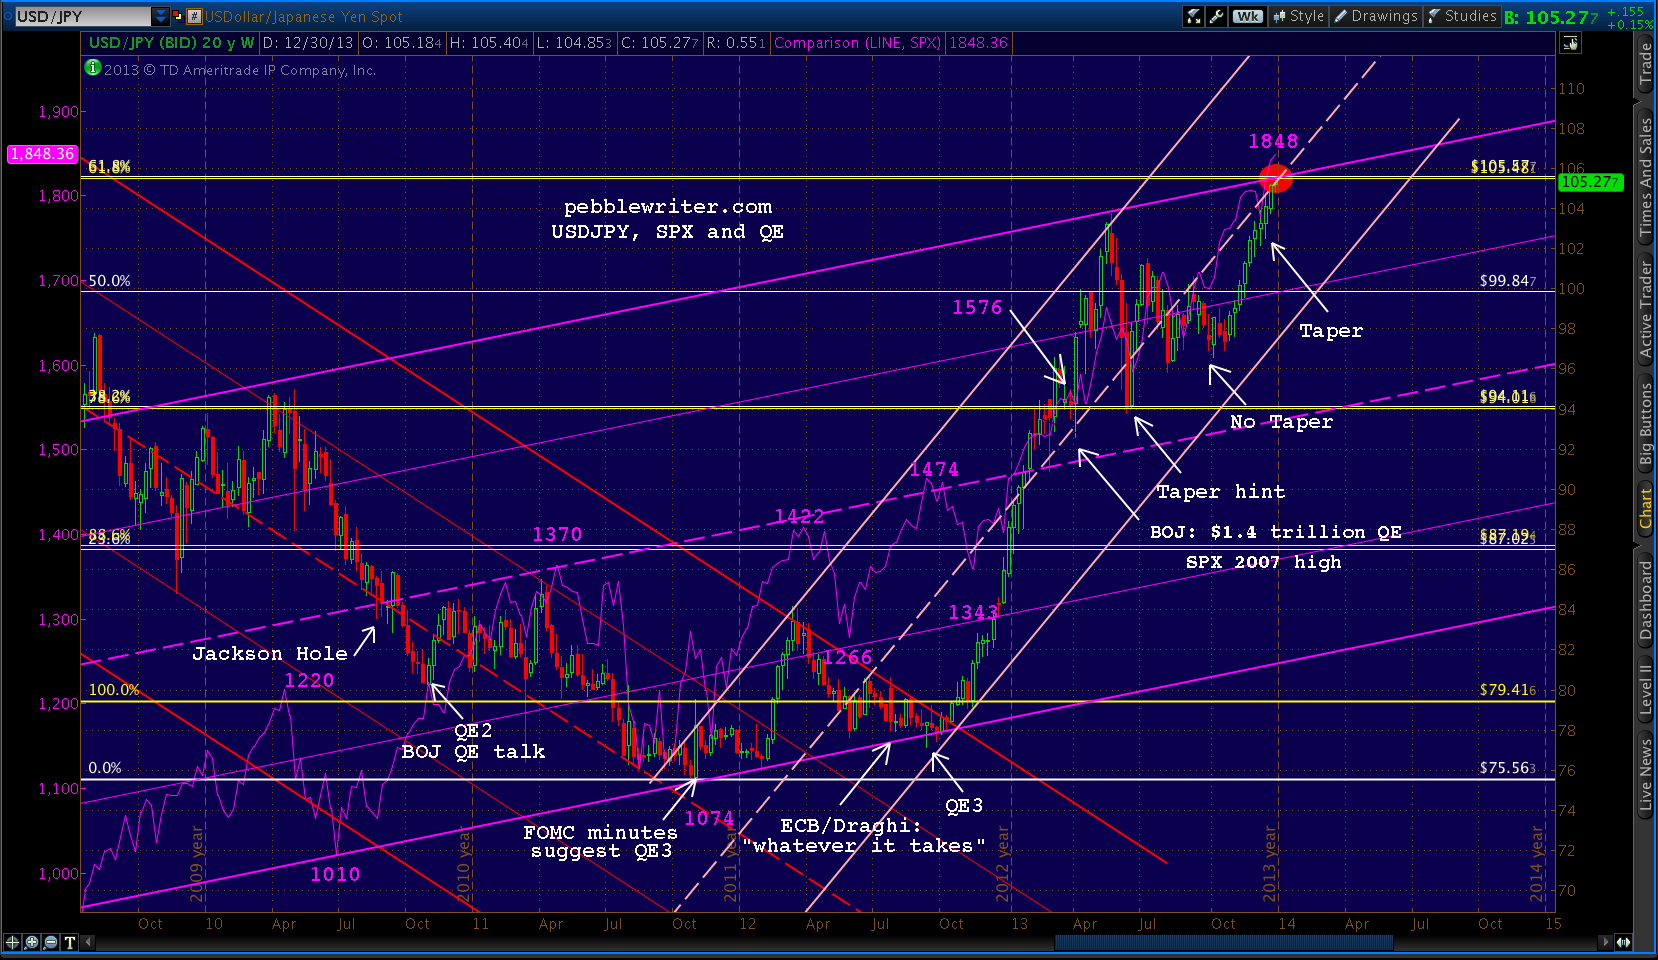
    USDJPY, which briefly popped up above the pennant pattern yesterday, has reached the .886 time Fib.  Something’s gotta give.

    The daily RSI suggests the next move will be higher.

    Last, keep an eye on bonds today.  The 10-year poked above the channel it has been tracking.  A spike in rates would hardly be constructive for stocks.

    UPDATE:  12:30 PM

    So far, so good.  SPX and ES both just reached the .618 retrace of their drops from yesterday’s highs and are safely back above the H&S necklines.   This would be a good spot for a pause if they have loftier ambitions, or a reversal if lower prices are ahead.


  • So Far, So Good…

    Lots of items to tick from yesterday’s post:

    • a reversal at ES 1770 to 1760 (those were yesterday’s high and low)
    • a quick spike in the dollar up to 81.11-81.22 (just tagged 81.21)
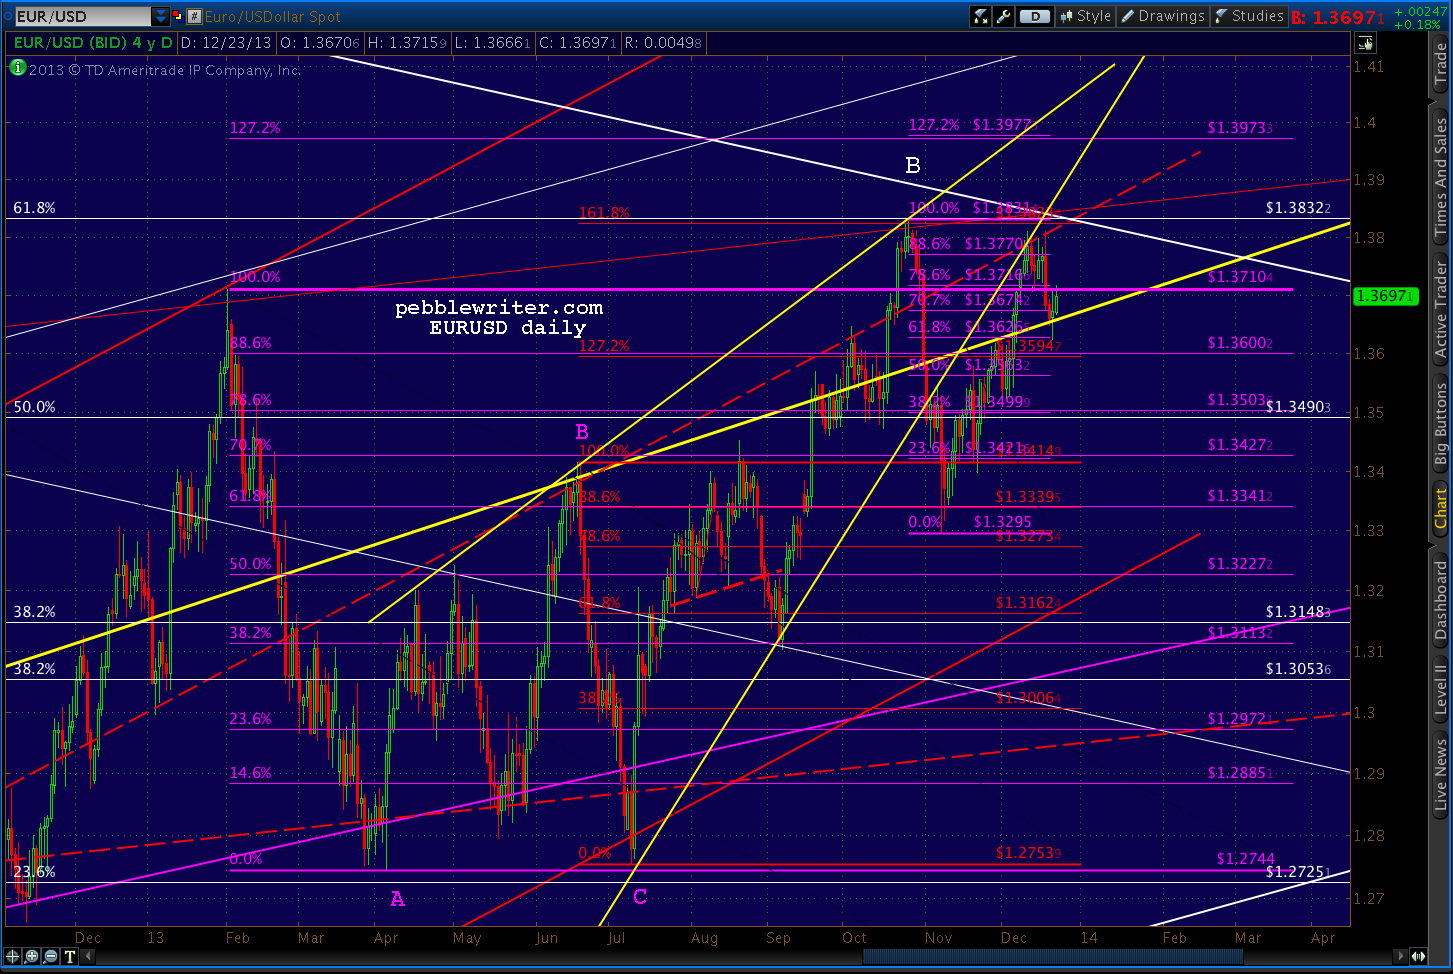
    • a dip in EURUSD to 1.33-1.34 (just tagged 1.335)
    • USDJPY would reach and react to 98.76 (just tagged it, waiting for a reaction)

    Here are some charts…

    ES just ran up to the red midline on the ECB rate cut and should react here before heading higher.

    Ditto for the dollar, which tagged the yellow channel top and both .618’s as expected.

    Beemers just got a little cheaper thanks to Super Mario.

    And, the USDJPY is that much closer to the top of the pennant.  I’m still looking for a tag and probably a break out.

    UPDATE:  11:30 AM

    Yikes!  After a perfectly obvious breakout on the ECB rate cut, the market came undone on (good news is bad) news that GDP grew faster than expected (2.8% versus 2.0 expected) and a decline in initial claims.

    It’s silly, really, since most of the GDP growth was due to inventory buildup.  Without it, GDP growth was 2.0%.  And, consumer spending (1.8% growth) slipped to its lowest level since 2Q 2011.

    When I wrote that ES “should react here” after breaking the Oct 30 highs this morning, I never dreamed it would drop 22 points.  It has probably bottomed out here at 1752.25 and should respect the white channel bottom (aka the H&S neckline) and the purple .786 Fib.

    But, as we discussed yesterday, all the support in the world won’t matter much if buyers — delirious over their Twitter gains — are convinced that a bubble pop is imminent.  We’re skating on thin ice, and a failure to rebound intraday would be quite negative for equities.

    Even though the previous high was taken out, the pattern’s 2nd right shoulder still hasn’t busted the H&S pattern (top of the white channel.)  I suspect this latest neckline test was designed to clear out the weak bulls before the next leg up.  From where I sit, it was pretty darned effective!

    UPDATE:  2:30 PM

    The cruelest aspect of this morning’s pump and dump was the way it stopped out the bears who had stops in at the previous high (interestingly, this didn’t happen on SPX, just ES.)

    Could the same thing be happening on the other end?  ES just dipped below the Nov 1 1747 lows — no doubt stopping out most anyone with a bullish bent.

    Yet, there are plenty of signs of a bottom here at ES 1745.  Consider the Dow, for instance, getting strong channel support when it counts.

    The dollar has completed a back test of the broken red channel and has fallen back below both white channel midlines and within the falling yellow channel.

    EURUSD caught a bid at the white .236 channel line and .500 Fib of the 1.27 to 1.38 rally.  A backtest of the broken yellow channel at the red .618 (1.2636) or even .886 (1.3770) looks like a good bet.

    And, SPX itself is a mere 14 points from closing at the neckline of its H&S Pattern (and, back in its rising red channel.)  It would mean a recovery 50% of its losses on the day — something we often see in the last half hour of trading.

    If it can close above 1760 after having just completed a Gartley Pattern at 1747.93, no harm no foul.  If not, the H&S points to 1732.

    ES 60-min RSI suggests a major bounce, but we’ll find out soon enough.

    One word of warning:  SPX has seen more than its share of failed H&S patterns after similar sell-offs.  I wouldn’t hold short overnight on the expectation of a continuation tomorrow unless you’re able to hedge your position.


  • Charts I’m Watching: Nov 6, 2013

    ES completed a small Gartley Pattern overnight (1767.50 vs 1767.67).

    SPX should play catch up on the opening.  Its .786 is 1770.40.

    UPDATE:  10:00 AM

    Make that a pair of Bat Patterns.  SPX just tagged its .886, while ES came close enough (1770 vs 1770.26.)

    Ideally, we’d get a little sell-off here to better establish the red channel bottom.  Note: I adjusted it after the close this morning to accommodate yesterday’s low and be more parallel to its ancestors.

    There’s a little room, now, after the sharp bottom at 1750.50.  And, the yellow rising wedge sure suggests it’s a possibility.

    I’d also like to see DX do a quick spike up here and tag 81.11-81.22.

    If it sounds like I’m speaking out of both sides of my mouth… probably because I am.  We called for a stick save on the EURUSD Monday — which we got.  But, the stop was at an odd spot from a harmonic standpoint.  Ideally, we’d see a tag of the red 1.00 at 1.34 or, better, the combo purple .618/red .886 at 1.33.

    And, how about this channel on USDJPY?  Sure looks it’s got a little room to run to me…

    You could argue that we should see a sizable reaction to the white .886 at 98.76.  But, you could also argue that the pair never quite reached the pink .618 at 99.05, much less the top of the pennant (red TL.)

    My hunch is we get a small, technical bump in the dollar (81.11-81.22) to deal with the EUR and JPY charts while ES sells off to 1760 or so, then a spike up in ES to 1837 while the dollar resumes selling off.

    continued for members(more…)

  • Charts I’m Watching: Nov 5, 2013

    EURUSD reacted to the .618/1.618 combo as expected, has an opportunity to reverse here at the purple channel bottom and previous high.

    Close-up:

    ES is approaching a potential midline of the admittedly unclear falling white channel.

    SPX looks like it just bottomed at 1759.84 per the purple channel, while the white shows a failed breakout.  I’d want to test a long position around 1758-1760, with stops at the previous 1752.70 low.

    UPDATE:  9:51 AM

    This would make for a nice bottom here at 1758ish.

    UPDATE:  10:00 AM

    Tagging a good TL at the .786 and a symmetric shoulder on a IH&S…  Should be very close to the bottom here at 1755.78.

    UPDATE: 2:40 PM

    SPX reversed nicely at 1755.76.  Where from here?

    continued for members(more…)

  • Charts I’m Watching: Nov 4, 2013

    ES closed above the bottom of the rising red channel Friday, remaining in the uptrend we forecast.  The next hurdle is approaching, however: the red .618 at 1763.22 which intersects today with the white channel’s .236 line.

    So, while the uptrend is intact, the coast is far from clear.  Remember, every channel works until it doesn’t.

    UPDATE:  9:35 AM

    I’ll consider 1763 close enough and adjust the declining white channel to reflect a reversal there.  We’ll look for a pullback here and subsequent break out through the .618.

    The SPX, which followed the e-minis’ lead on the opening, will probably want to back test its broken white channel top — suggesting a pullback to 1761-1762 or so.

    UPDATE:  10:03 AM

    SPX has reached the white channel top and .500 Fib, so could turn at any point between here and, say, 1761 (later in the day.)  The tell will be the strength of the reaction (if any) at this point.

    The dollar, meanwhile, has reached the range we anticipated back on Oct 22 and, is nearing the falling white channel midline as well as the purple .886 (81.111) and white .618’s (81.109 and 81.226.)

    While this wouldn’t quite reach the broken red channel bottom, it seems like a pretty good fit for the falling white and (adjusted) yellow channels.  So, I’d consider the dollar rally to be near the end of the spike we’ve anticipated.

    This jibes well with the Fib time ratios applied to the USDJPY chart, which indicates tomorrow will likely be the next reversal for the pair as it traces out the last days/weeks of a pennant dating back to February.

    UPDATE: 2:50 PM

    SPX turned at 1761.56, right in the middle of our target range (1761-1762) from earlier this morning after reversing at our upside target (1767) as expected.

    continued for members(more…)

  • Charts I’m Watching: Nov 1, 2013

    The fact that we made it through an October without a major hiccup in the markets is more a testament to the Fed and the PPT than to a healthy economy.  But, that’s okay.

    ES stuck around at our price target long enough to also tag our timing target, and should now be ready to resume its ascent along the red channel.

    It bears repeating that just because the market behaved as we expected over the past few days, there is no guarantee it will continue to do so.

    The key to our strategy is developing a forecast, taking the appropriate position, and then being ready to switch sides whenever we reach a reversal point or when the forecast stops working.

    In this case, we not only reached our target price (the solid yellow line) on time, but we reached the bottom of a well-formed channel.  ES should rise from here.  But, if the red channel should break down, it’s time to consider a short position.

    Remember, yesterday we identified 1749.33 as the key support for ES.  It’s actually 1748.8, but either is fine.

    Key price levels are 1752.50 for SPX and 1749.33 for ES. If those don’t hold, there’s potential for more downside — an intra-day overshoot of the channel bottom or a new channel as discussed yesterday afternoon.

    UPDATE:  11:15 AM

    ES is just about to tag our key support level at 1749.33.  I would play along on the downside on any drop through 1748, but with stops at 1749 just in case it’s merely getting a little over-excited.  As usual, I would go into the weekend in cash.

    I have to run out for a lunch meeting — might be back before the close.  In any case, more later.


  • Update on Bonds: Oct 31, 2013

    It’s been a month since our last update on bonds [see: Sep 24 update.]  At the time, TNX had just reached our initial target: the 1.618 extension of the plunge from 23.97 to 13.94 from April to July 2012.

    It was also the .618 retracement of the drop from 40.13 in April 2010 to 13.94.  It also happened to mark the top of an important channel (in purple) and an important psychological threshhold: the 3% mark.  So, we had no trouble expecting a reversal.

    But, there was some question as to the importance of an alternate channel (white) which held open the possibility of a move to 3.2% before the next big reversal.  It all came down to what changes the Fed had up its sleeve with respect to tapering.

    Turns out, not much.  They didn’t taper in September and yesterday’s FOMC announcement came and went with nary a hint of a return to central bank sanity.

    Since then, rates have continued to tick lower, heading ominously towards the yellow target in the 2.14 range the charts suggested (and, I dutifully charted.)  Why “ominously?”  Each of the previous plunges (except the last) corresponded with a meaningful dive in equities prices.

    The forecast is anything but settled. TNX has slipped below the midline of the rising white channel and the .786 line of the rising yellow channel; but, it has paused above the midline of the rising red channel.

    stay tuned…

  • Charts I’m Watching: Oct 31, 2013

    ES has another wave down to go before we can consider the red channel fleshed out.  It reached our  target zone, but a little faster than expected.

    And, it looks further along in doing so than SPX.

    The point in arresting SPX above the 1.618 fib level at 1759.97 (of the drop from 1709 on Aug 2) is so the drop can be characterized as a small backtest rather than an important top of any kind.

    Yet, the rising red channel continues to show plenty of downside potential if TPTB should decide to allow it.

    Remember, chart patterns occupy space and time; this one looks like it has unfinished business.

    Key price levels are 1752.50 for SPX and 1749.33 for ES. If those don’t hold, there’s potential for more downside — an intra-day overshoot of the channel bottom or a new channel as discussed yesterday afternoon.

    I’m going to take a few minutes and update the bond outlook, as there are some interesting developments taking place there.

  • Charts I’m Watching: Oct 30, 2013

    SPX poked up past our 1770.97 target in the last 3 minutes of trading yesterday.

    While, the e-minis reached our 1767.63 target around 3:59:30.  It’s clinging to a 1.5 pt gain at the moment.  Can it hold?

    There are two ways to play a leak past a natural turning point:

    1. dig your heels in, argue that it shouldn’t go higher and short like crazy;
    2. listen to what the market is saying and play along (with trailing stops in case it’s a trap.)

    Those who have followed this site for any length of time know how I feel about such things.

    continued for members(more…)