In an attempt to convince the world that the economy was, indeed, robust, the FOMC recently raised rates. It was also a bid by the Fed to retain what little credibility it has left. It failed.
As I have been writing for the past couple of years, the yen carry trade [what’s this?] has been the primary lever of higher stock prices since 2011. As long as the yen continues to get cheaper and the dollar richer, the USDJPY climbs higher — taking stocks along with it.
But, the Fed’s actions exacerbated a currency crisis going on in secondary markets. Hot money from the slush fund known as Japanese financial markets flowed back into Japan. The yen strengthened. Two days ago, the USDJPY plunged below the bottom of a channel dating back to October 2014 — seen above in red. As we pointed out at the time, every dip to the bottom of this red channel has caused a sell-off in stocks. And, each successive dip has produced larger and larger sell-offs. This latest one, which dipped below the channel bottom, produced the worst.
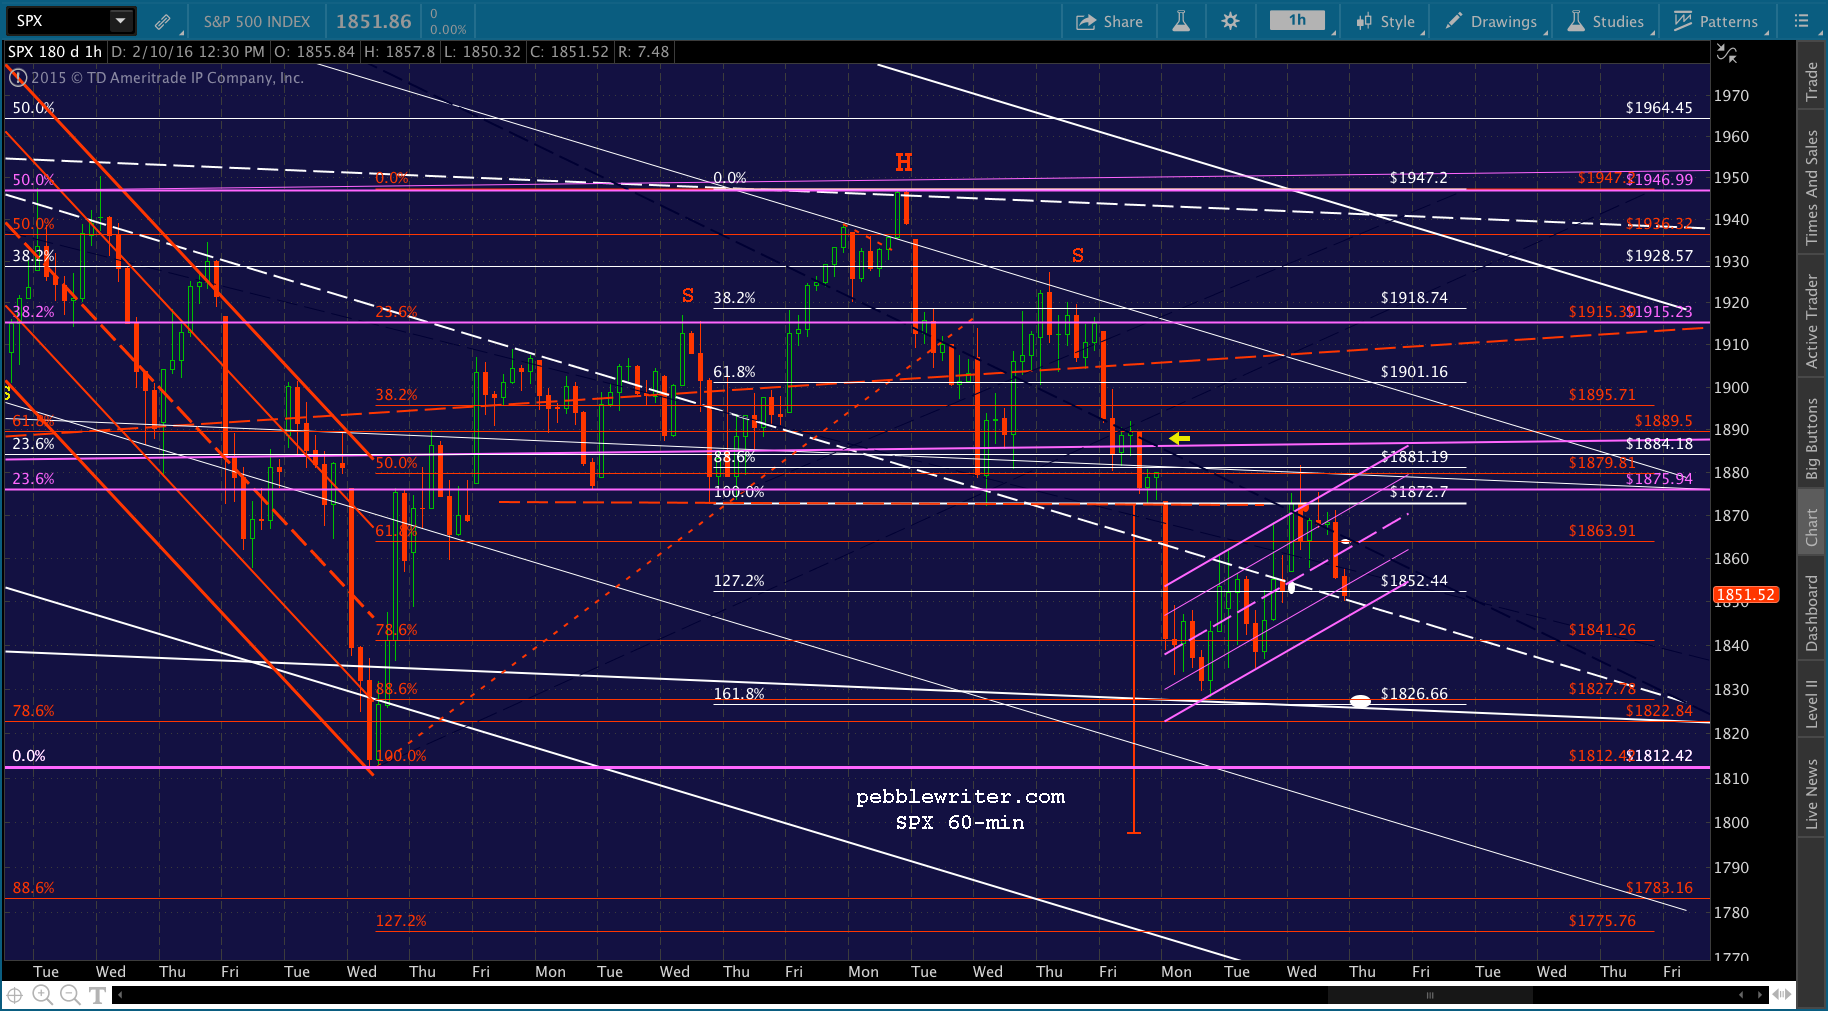
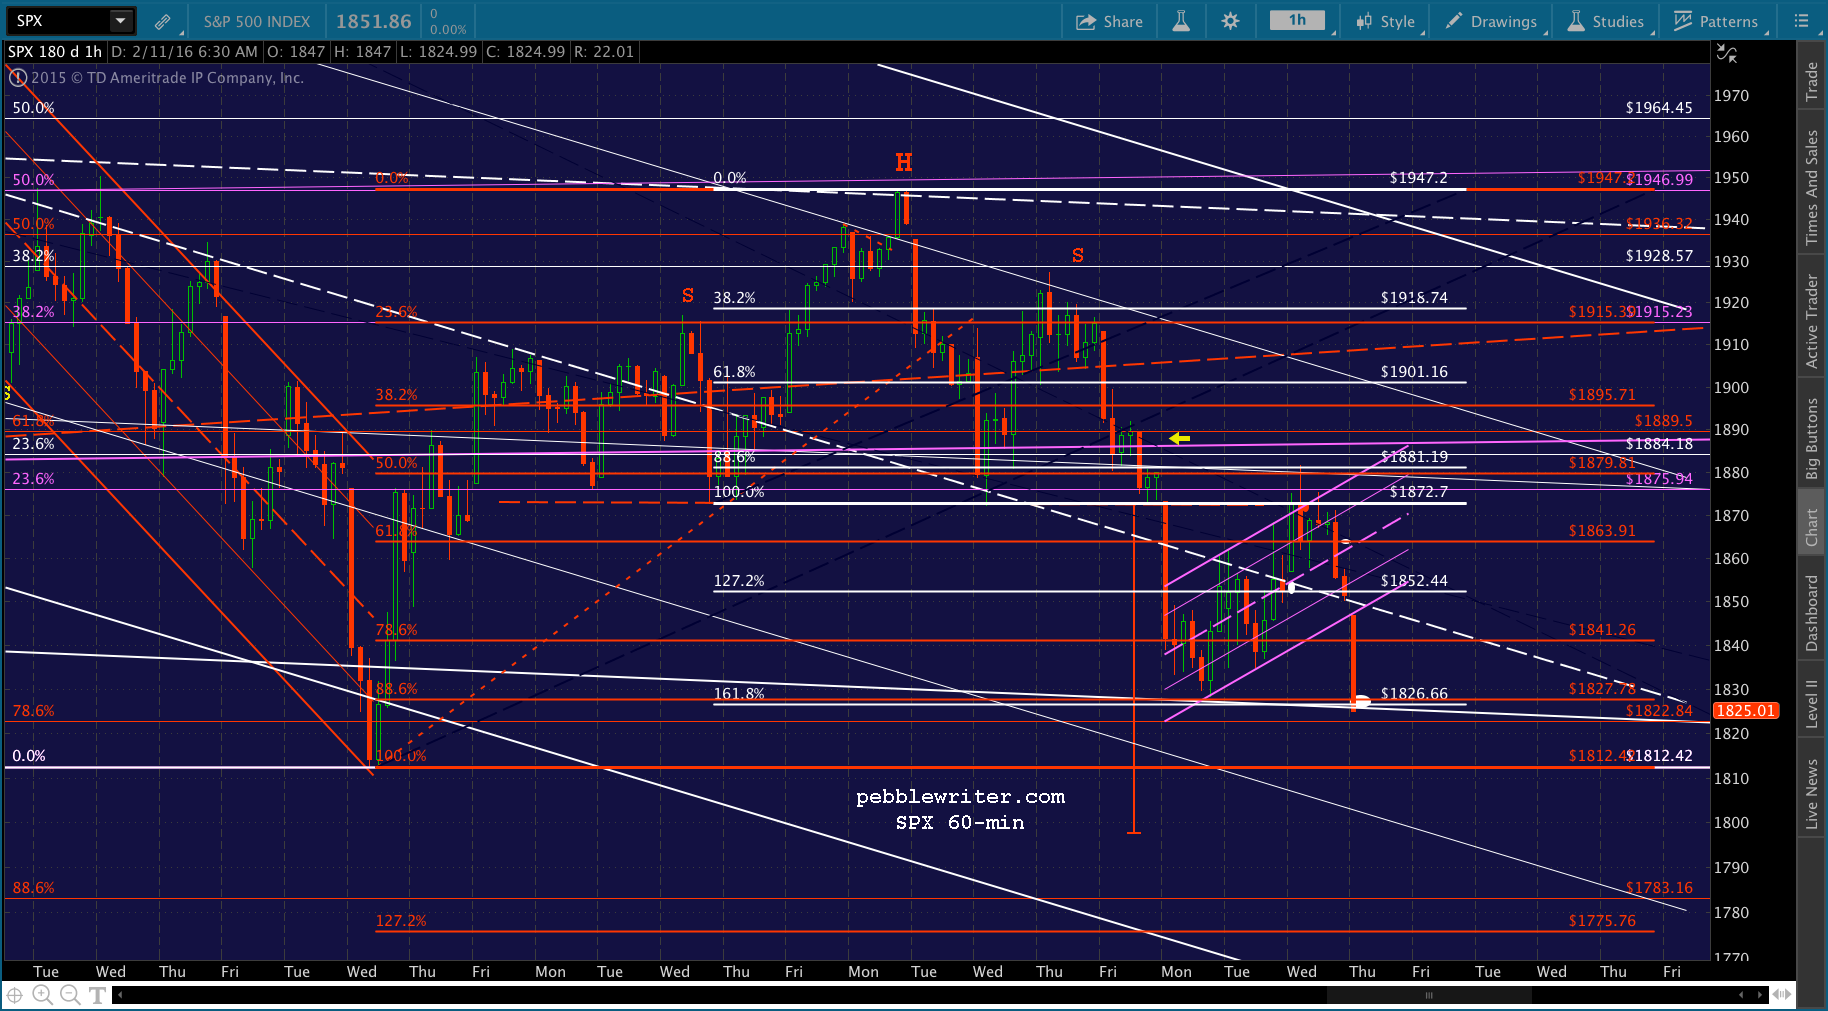
At the same time, SPX and ES dipped below necklines of large Head and Shoulders patterns that targeted additional 15% declines. As I wrote yesterday:
If, on the other hand, it closes back above 1887 or so, then bulls can breathe a little easier. The RSI charts indicate it’s not too late. But, again, it can’t happen without CL and/or USDJPY moving dramatically higher. Today was a start. Will they keep it going? It must start right here, right now.
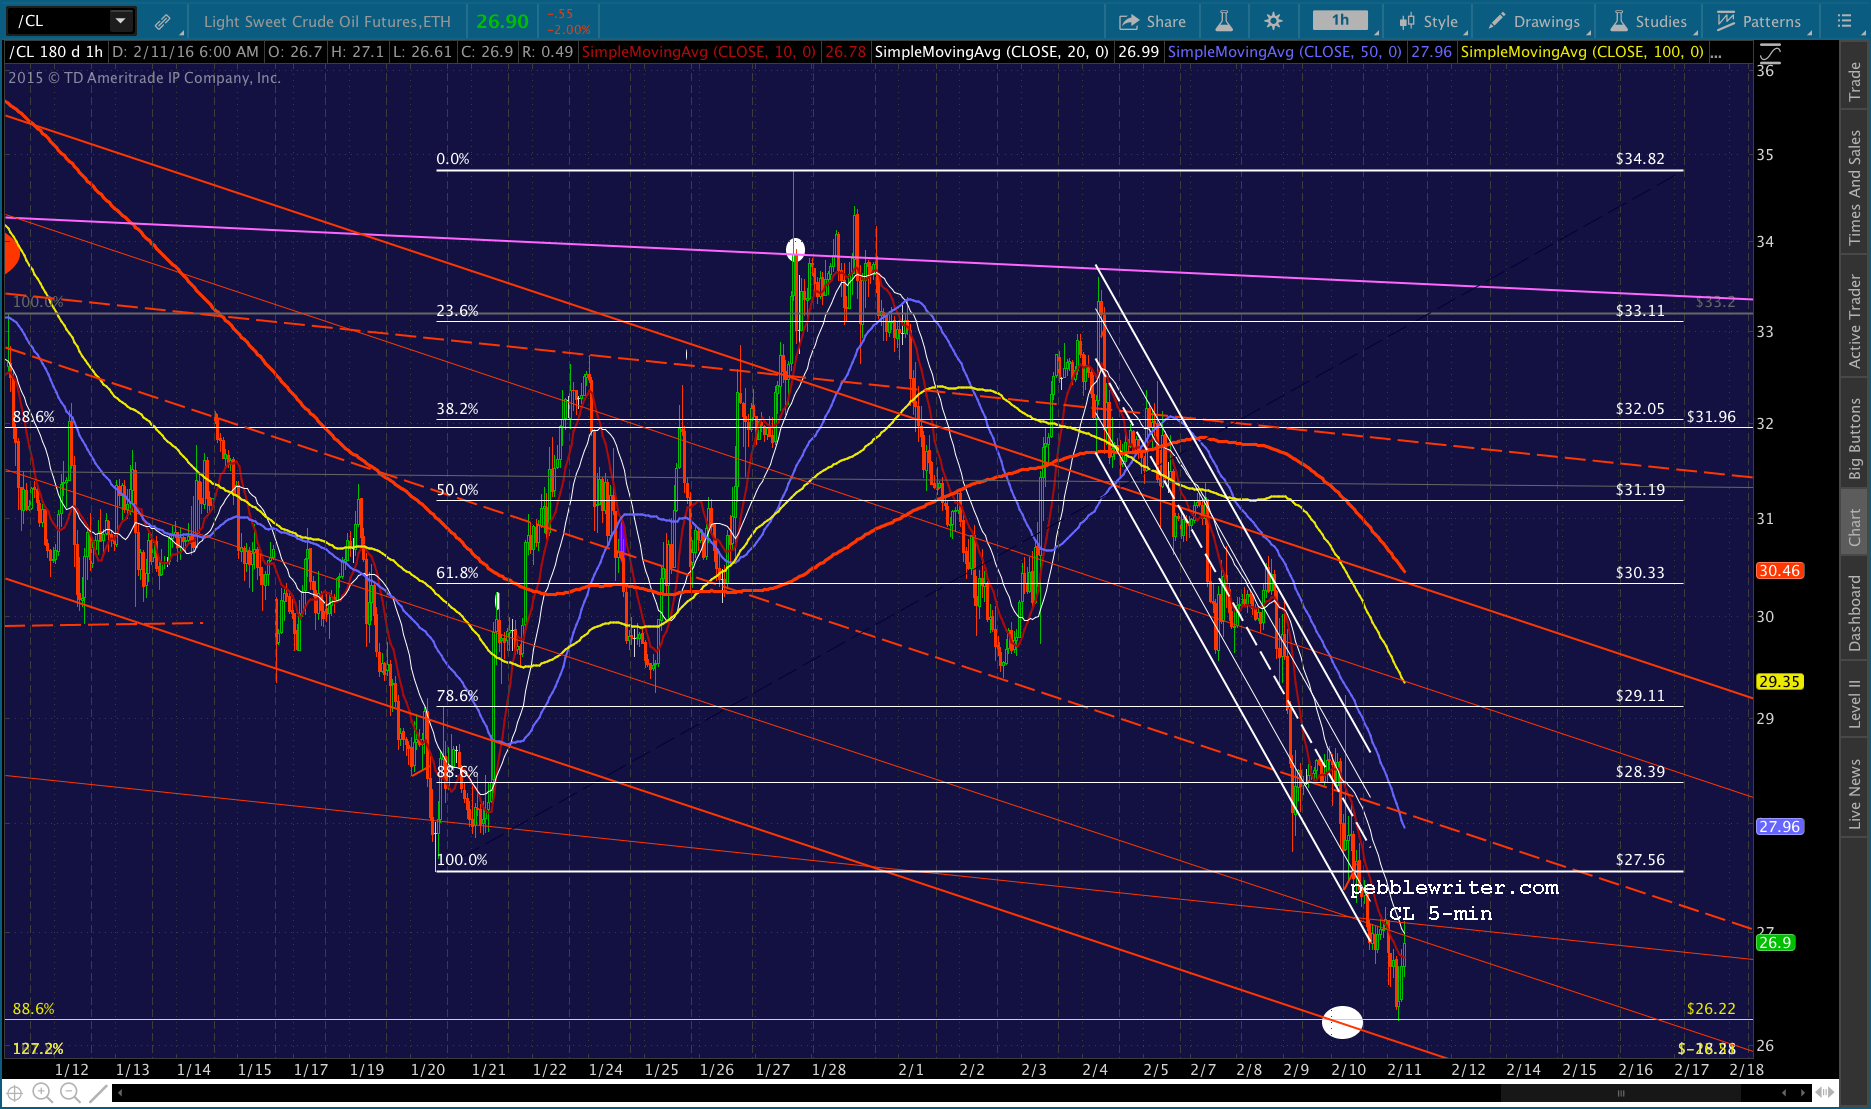
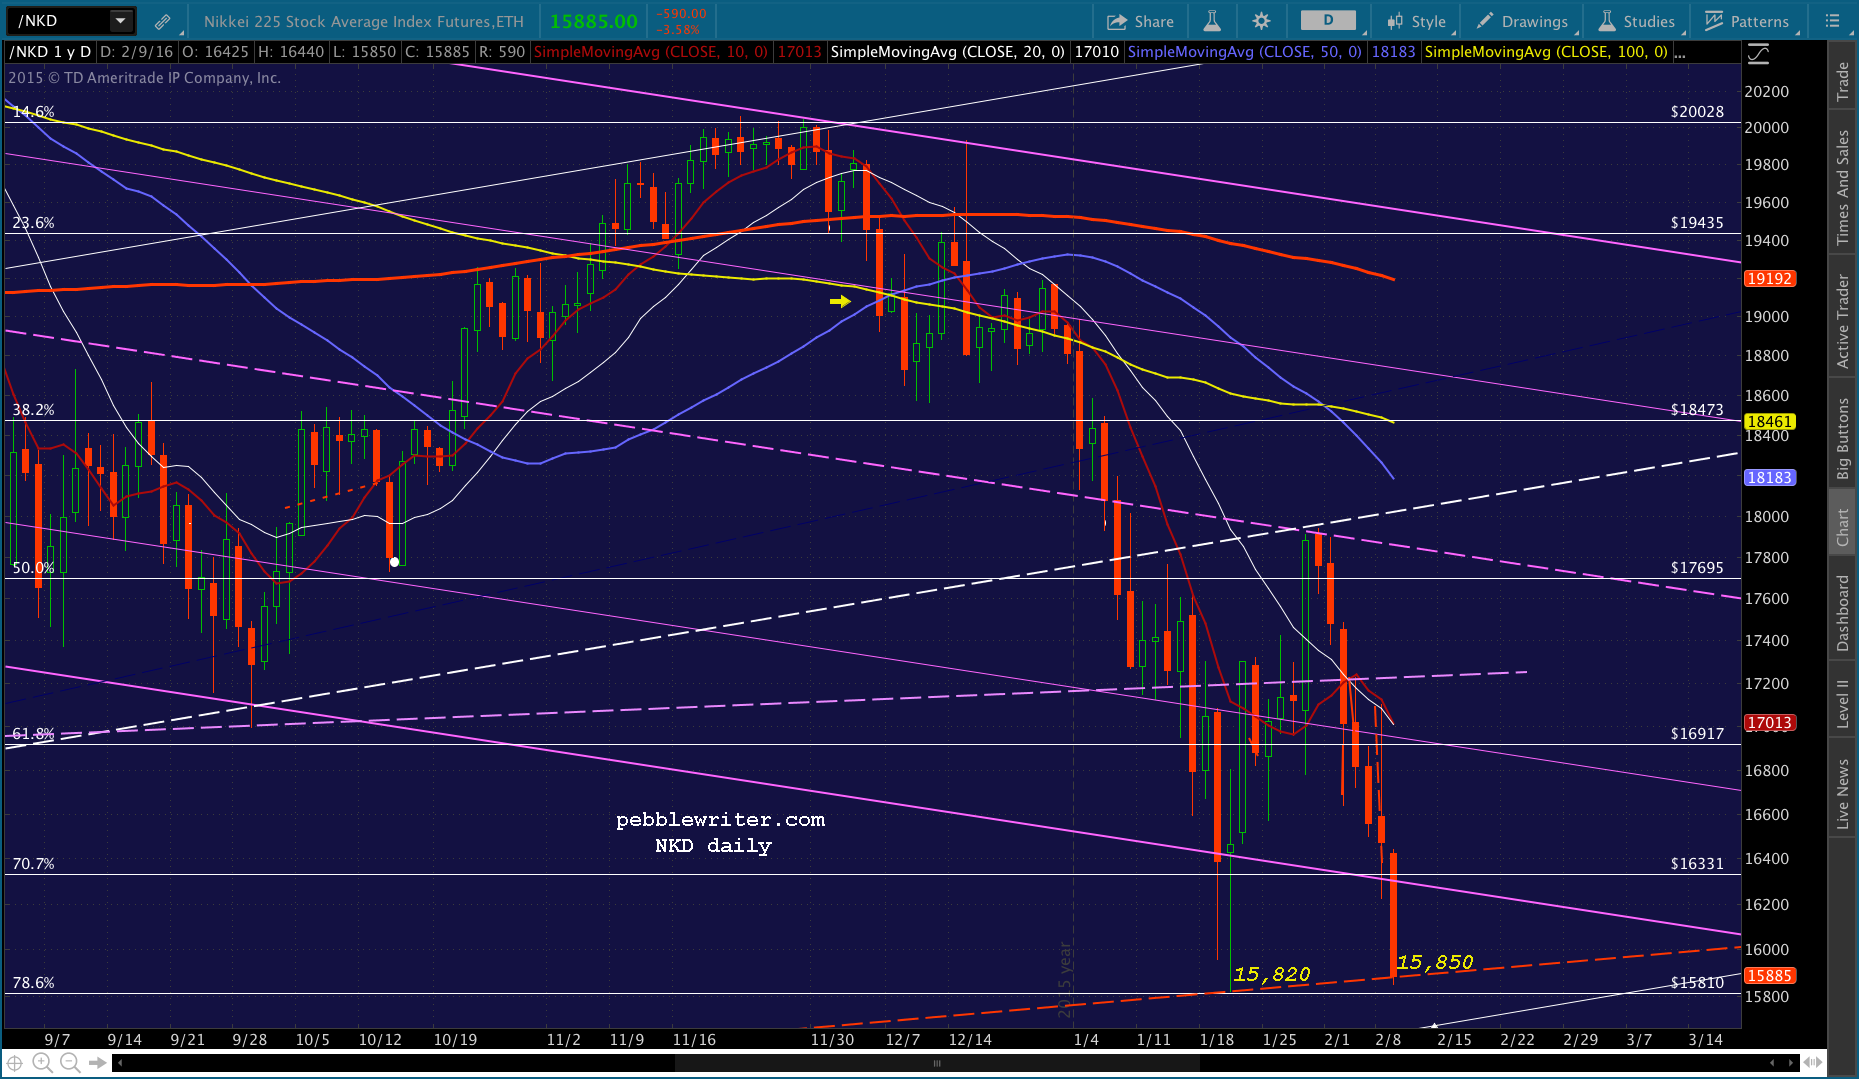
Last night, “sources” leaked that the BoJ would increased QQE — code for a higher USDJPY, which enables the yen carry trade to soldier on. Kuroda begrudgingly confirmed the reports this morning. USDJPY is up over 2% since Wednesday’s lows. And, Saudi Arabian Oil CEO Khalid Al-Falih confirmed that oil had overshot to the downside, and was due to rebound. CL is back in its falling red channel, having spurted 15% higher in the last two days. This is equivalent to a 285-pt rally in the S&P 500 or a 2,400-pt rally in the Dow.
Is it any wonder the futures are up over 30 points at this time? Central bankers won’t be able to toot their “the economy is good enough that it doesn’t need supporting anymore” horns. Oh, well. Credibility is overrated, anyway.
Last call for our year-end Celebratory Membership Special. If you’ve been trying to decide, tempus fugit. It’s $640.42 per year and guaranteed never to increase. After the close, annual memberships revert to the normal price of $1,750. To sign up, CLICK HERE.
* * * * *
Lots to talk about this morning. Yesterday, ES dropped below the H&S neckline we discussed the night before [see: The Only Charts That Matter], but rebounded above it by the close. SPX came close to making its way back to its neckline; but, in the end, it failed. So, technically, it’s been triggered.
We were mainly short throughout the session until reaching 1820, at which point we were testing the Oct 2014 lows. This turned into a stop-hunting exercise as I noted in the 10:09 update:
There’s an excellent chance they’re going to run some stops at 1820.66 before any serious bounce occurs.
SPX pushed below 1820.66 to 1812.29, where it then rebounded by 63.86 points before running into the top of the falling channel it’s been in since Dec 28.
The culprits in all this action were, as usual, CL and USDJPY. CL dropped through the bottom of the falling red channel before TPTB realized how damaging this was, and then rebounded by a massive 5.6% off its overnight lows. Naturally, it had rebounded to well above the channel bottom by the time the US markets closed.For it’s part, USDJPY dropped through the bottom of the large red channel during the night with little effect on futures — which are simple and cheap to prop up during after hours. But, when it plunged below the channel bottom during the trading session (yellow arrow) carry trade investors took notice and sold hand over fist until it rebounded.continued for members… (more…)
Note: Final 24 hours for our celebratory Membership Special. Annual memberships, normally $1,750, are being offered for only $640.42, less than $2/day for daily forecasts and live, intraday market commentary geared to helping you avoid and even profit from the volatility we’re seeing. For more details and to sign up, CLICK HERE.
* * * * *
I sat down to update the CL and GC charts tonight, but quickly realized there’s no point until the following pattern is resolved. How about it, central bankers? Are you ready to let the markets run where they will?
Because, ES’ Head & Shoulders Pattern below targets 1530 — another 17% lower. For anyone keeping track, that’s a 28% drop from last May’s highs. Today’s key level, 1837ish. A close below here would be quite bearish.
BTW, the only reason the above chart is where it is…? This chart: the USDJPY — which has gone nowhere for the past 14 months. It’s also perched on a precipice.
Put them together, and the relationship is unmistakable. Every time USDJPY dips to the bottom of the red channel (at the yellow arrows), ES takes a dive. In fact, the dives have been deeper with each successive dip.
SPX completed its own H&S Pattern last week [see: Are You Happy?], but hasn’t been able to rebound because it was waiting on ES to arrive at its own line in the sand.
So, come on, central bankers. We’re curious. Have you more tricks up your sleeves; or, are you finally ready to take the quotation marks off the “markets?”
Friday was another fun day, with our call to short at the open and take profits at 1858.83 accounting for 1.8% of our ultimate 2.73% gain on the day. We even got the close we had expected, at 1880.33.
Keep an eye on VIX just in case they go for a last minute monkey-hammering to get back to the H&S neckline at 1880 or so.
Today, it’s all about USDJPY which is either at or very near very important support. Will it awaken?
After USDJPY finally found a bottom at 75 in October 2011, it soared — providing much-needed firepower for stocks to embark on an unending rally via the transmission channel known as the yen carry trade.
By the time USDJPY had retraced 61.8% of its losses from 147 in 1998, SPX had almost doubled from its October 2011 lows. But, USDJPY had run out of firepower. We suspected it at the time, but wouldn’t know for sure until months later, the BoJ had found its happy place. USDJPY would trace in a range of 115-125 for the next year.Last week, it again reached the bottom of that range. And, as expected, it is enjoying a strong rebound. It’s been enough to send the futures as much as 32 points higher, and has even provided cover for CL — still languishing near 30.
We’re in the final days of our membership sale in celebration of a first year that exceeded all expectations [For details, CLICK HERE.] Annual memberships, normally $1,750, are being offered for only $640.42, less than $2/day for outstanding forecasts that allow you to avoid and even profit from the volatility we’re seeing. For details and to sign up now, CLICK HERE.
* * * * *
SPX nailed the upper end of our initial target range on Wednesday, and the bottom of it yesterday — both on a pop-and-drop as expected. But, I was disappointed not to have reached the overshoot target we discussed in yesterday morning’s post:
While 1887.87 was the upper end of our range, 1880 was the lower end…where the actual neckline of the huge H&S Pattern crosses. Even then, it’s not carved in stone. H&S Patterns often complete and then some before TPTB snap it back into place back above the neckline. So, the ultimate downside for this move, if it hasn’t registered already, could well come intraday at the white .886 at 1856.46…
After tagging 1880, we spent the next hour or so wondering whether or not another leg down would materialize and allow the 1856 tag. But, the algos took over, driven by CL, USDJPY and NKD. VIX and TNX even got into the act as TPTB saw an opportunity to reframe some bearish chart patterns.
Though we registered nearly a 3% gain on the day, it was somewhat disappointing to think that the market had resumed its role as a “market.” On the eve of OPEX, it seemed that 1856 would at least be postponed to Monday — which just goes to show how constant manipulation can warp our expectations.
What a difference a day — or, at least, new lows in USDJPY — makes. This morning, we will be well on our way to that next downside target courtesy of BoJ’s Kuroda who, when asked last night why he’s not propping up the market, replied “wait, I thought the Fed had that!”
The e-minis are off almost 50 points, and with 15 minutes to go aren’t exactly bouncing.
All this begs the question: “if/when we reach 1856, will the carnage end there?”
Yesterday was one of those days when everything just fell into place. SPX fell 2.5%, nailing the upper end of our target range — which enabled us to gain 3.2%. I’d almost forgotten how fun it is to trade when TPTB let the markets run. It’s also amazing how quickly even mainstream investors have turned bearish, despite the obvious and very strong support just around the corner from yesterday’s lows. Have central banks, IBs and hedgies really lost control of this heavily manipulated machine…or, is it just possible that they have a plan?
If you sailed into today’s session brimming with bullish optimism over the 20-pt gains in the futures, you probably didn’t have such a great day.
If, on the other hand, you came in with your eyes wide open, having just read our opening post, you’re no doubt grinning from ear to ear.
While a big CL and USDJPY inspired after-hours ramp job gives the impression that the danger is past, it’s not… we could see a replay — a pop and drop. SPX would reach the purple channel bottom at around 1948ish — a 10-pt gain from yesterday’s close.
We put on a short at 1948 (the high was 1950.33) at which point, we began setting downside targets including 1940, 1925, 1900 and, finally, our ultimate target of 1887.71, originally posted Monday in The Century in Review:
I’ll call the target 1882-1887 for now, and it could happen as soon as tomorrow.
The forecast chart posted on Monday…Here’s the same chart as of the close. BTW, today’s low was 1886.41.
The key will obviously be the neckline of this huge Head & Shoudlers Pattern — about 1880. If it’s breached — except for intraday — the bulls are in trouble. If not, rest assured TPTB are still firmly in control.
We don’t nail our targets every day, but it’s been a lot easier since TPTB aren’t tampering with the “markets” quite as much as usual. Dare we hope this is the new normal?
updated: Jan 15, 2016
If you’d like to explore how charting can help you avoid “really bad days” and have more great days, check out our membership special. We’re winding it down. For the next day or two, you can get a Charter Annual Membership — normally $1,750 — for a ridiculously low price of $640.24 (why?)
If you already signed up a few days ago, congratulations. You’ve probably already paid for your membership!
In our December update [see: Update on Bonds, Dec 3, 2015] we announced the arrival of 10-yr yields at an important level of overhead resistance. TNX had reached a trend line that dates all the way back to 2007 (23.08.) I noted at the time:
Remember, a retreat from this red TL from June 2007 means a correction. Pushing above it — which hasn’t happened since, well, ever — presumably means a rally.
Despite the best efforts of TPTB, TNX was unable to push through that TL. It even tested it twice more, but was unable to push through and, instead, broke through support several times over.
The latest was yesterday, when it broke through a short-term trend line (below, in purple) that’s only two weeks old.
While it bounced back above it by the close — helping to spur a 25-pt overnight ramp job in ES — it’s not quite done. And, yes, that means there’s more downside for stocks.
It’s de rigueur in movies nowadays. Something scary almost befalls our hero. He narrowly escapes, saying something like “wow, that was a close one!” Half a beat later, the really bad thing happens that he was too busy thanking his lucky stars to notice or prevent. The Final Destination franchise has made a mint off this device alone.
This is that moment in the “markets.” While a big CL and USDJPY inspired after-hours ramp job gives the impression that the danger is past, it’s not. On the other hand, the bad thing that’s coming probably isn’t as bad as some would have you believe.
We’ll start with CL’s big bounce off our downside target yesterday. It’s currently up 2.2%, which is mildly impressive. But, it hasn’t yet cleared the purple TL connecting the tops formed over the last week. Not exactly an all-clear sign.Likewise, USDJPY’s bounce off the .886 Fib is reassuring. But, wouldn’t it be more so if it could clear the midline of the falling white channel it’s been in since late November?Then, there’s stocks themselves. We nailed most of yesterday’s ebbs and flows, racking up a nice 3.35% gain on the day. But, ES is currently only back to the channel bottom that started the dramatic intraday swoon.
continued for members…
The way the futures are backing off their overnight highs, we could see a replay — a pop and drop. SPX would reach the purple channel bottom at around 1948ish — a 10-pt gain from yesterday’s close.It currently looks capable of breaking that with ease on the open. But, I’d be cautious about remaining long if ES, CL or USDJPY start to back off from the resistance in front of them.
UPDATE: 9:32 AM
SPX reached our 1948 target in the opening two minutes. I’d take a short position here at 1948.04 and see what develops. The initial target is the broken channel top around 1940-41, followed by the SMA cluster around 1927.USDJPY is breaking down through the channel midline……but, CL is ramping to try and compensate. So far, it’s a standoff. SPX is nudging higher on CL’s push, but ES hasn’t broken out or down — meaning it could go either way.UPDATE: 9:54 AM
Just reached our initial goal. I’d take profits here at 1941.43 and go to cash while we wait to see whether or not it pushes through or bounces.UPDATE: 10:04 AM
Looks like the bounce might be over… I’d short if it pushes through the channel top… …or ES through the neckline of a little H&S targeting 1918.UPDATE: 10:15 AM
Could be a headfake, but ES is pushing below the neckline as SPX dips below the SMA5 20. I’d hazard a short position with tight stops here at 1939.63.UPDATE: 10:20 AM
Now, it’s USDJPY coming to the rescue, trying to prevent SPX from dipping into negative territory. If it pops through the purple midline, it might be able to.CL is slipping down toward rising wedge support.UPDATE: 10:31 AM
Oops! According to Zerohedge, it’s the biggest 2-week gas inventory build on record.There’s SMA5 support at 1930.77 and 1926.59. But, the better target is ES 1918 (about SPX 1925 — where nothing special is happening anytime soon.) To reach any of those, USDJPY will probably need to break back through the white midline support.
UPDATE: 10:37 AM
Getting there, but USDJPY bounced on that midline mentioned above.
Note that CL is back below the red channel bottom at the moment — even backtested it.
UPDATE: 10:57 AM
Do you think maybe they’re trying to prop this sucker up? Someone sure hit the panic button. ES isn’t due to tag 1918 until closer to 11:30, so we’re probably going to get more backtesting before that final drop.
UPDATE: 11:22 AM
Well, they got it back to green for the euro close. But, ES and CL have backtested some pretty good resistance. So, ideally, the rest of the drop should commence pretty soon. The one possible hitch is that SPX is back above the SMA5 10 and 20, which can be a powerful algo crutch. For now, I’m still looking for ES 1918 — about SPX 1924-25.
UPDATE: 11:35 AM
The one handy thing about this delay is that SPX 1924 can now more easily align with the rising white TL off Monday’s lows. Depending on when it happens, it could range from 1922 (12:00) to 1925 (1:55, at the red SMA5 200.)
UPDATE: 11:58 AM
They got a little out of sync. But ES just tagged the red TL at 1918 exactly, while SPX reached the SMA5 200. It could obviously go lower, but I think I’ll take profits here at 1926.32 and wait and see. It should be safe to go long here, but USDJPY isn’t bouncing at all, and we’ve got important Fibs just below. Besides, the falling SMA5’s will catch down with SPX at 1930ish, which IMO isn’t enough upside to justify a trade.UPDATE: 12:45 PM
SPX didn’t stop at the white TL, and ES didn’t stop at the red .786. USDJPY is bouncing somewhat, but not very aggressively. And, CL looks confused — as am I. I’d try a long position here at 1921.97, but be very cautious. Lots of overhead resistance if the bounce isn’t strong.UPDATE: 12:50 PM
Don’t like the way this is shaking out. I think we’re in for more at least a few more points downside. Shorting here at 1922.03 on ES’ weakness. Be cautious, as ES could be aiming for its .886 at 1910.4, which doesn’t offer much downside.UPDATE: 1:00 PM
SPX just reached its .886, which should produce a bounce of some sort. But, it hasn’t quite reached a backtest of the broken white channel, so it could drop to 1908.25ish. If it doesn’t stop at the backtest, SPX is aiming for the falling red channel midline next.USDJPY suggesting the downside isn’t done.Ditto for NKD.UPDATE: 1:13 PM
I think we’re going to bounce up to the SMA5 10 or even 200. I’d close the short here at 1920.19 and go to cash. If ES is heading for 1908.25, then I’m giving up 3.75 or so (SPX 2016ish). But, if it breaks out, we’d be underwater pretty quickly.UPDATE: 1:24 PM
ES just backtested the broken white channel, so I’d try a long position here if USDJPY were bouncing. But, it’s dropping, so I can only assume they’re aiming for SPX 1914.35, to run some stops, or lower. Back to short with tight stops.UPDATE: 1:30 PM
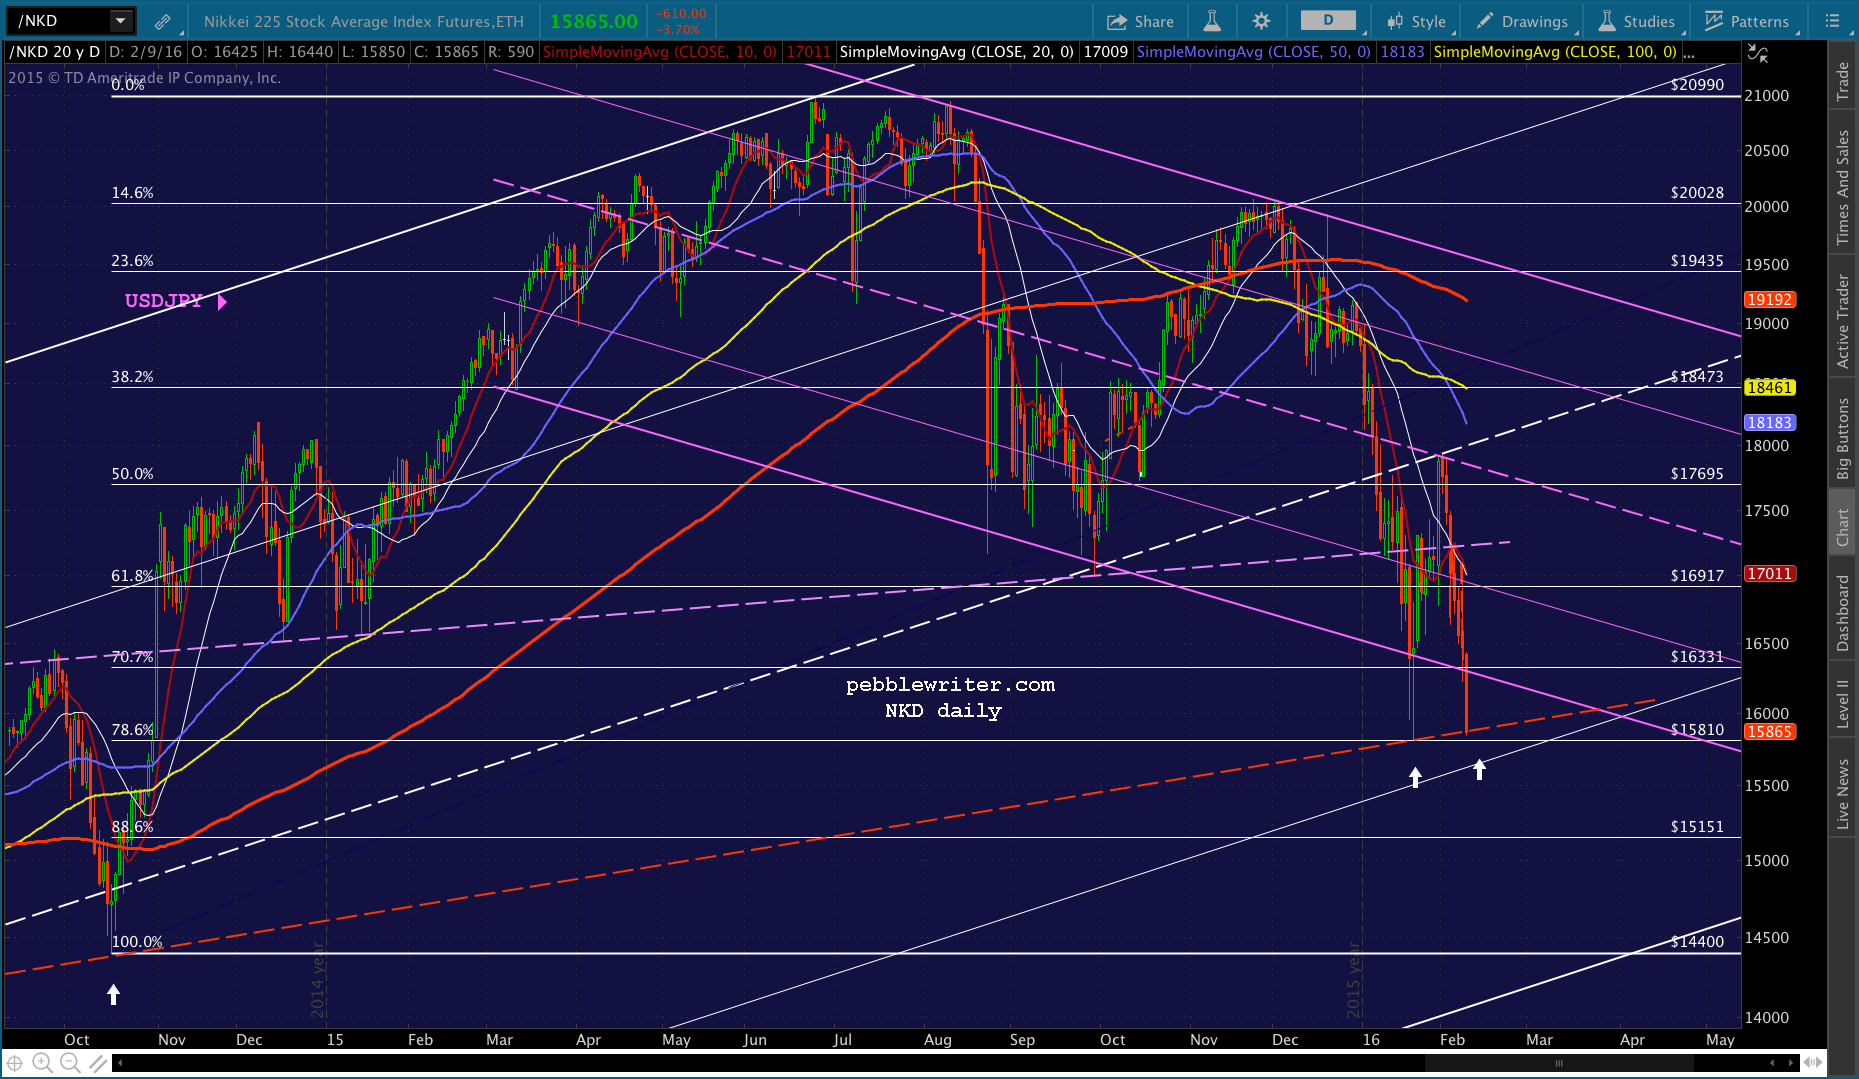
NKD just reached that white TL of support. Would be neat if it just dropped through. But, will probably bounce — perhaps after SPX breaches 1914.35?If SPX does dip below 1914.35, keep a close eye on NKD. If it starts spiking like crazy, this was just a stop run. If it drops further, then there’s more downside to 1911.64, 1906.71 or 1900.
UPDATE: 1:40 PM
Just reached the .786 at 1911.64. first bounce opportunity. But, I think USDJPY is going to test the purple channel bottom.UPDATE: 1:46 PM
I don’t expect it to happen today, but note that we’re no longer all that far from our 1882-1887 target as posted Monday in The Century in Review.UPDATE: 1:51 PM
Next downside target – the .886 at 1906.71. It’s also the .886 of the purple ES chart. Should get a bounce here – perhaps up to SMA5 10 now at 1914. Worth a shot at a long position here at 1906.69 for those 8+ points.I don’t see it as anything more than a potential bounce, and fully expect to test 1900 before the session’s done.
UPDATE: 1:59 PM
Bounce isn’t going anywhere. Back to short at 1907.45 for 1900.UPDATE: 2:19 PM
Next target down. If it doesn’t bounce here at 1900 (another stop run opportunity) then we should get our 1887 target by the close. I’ll try a long position here at 1901.03, but with tight stops.UPDATE: 2:31 PM
Looks like we’re heading lower. Back to short here at 1901.95. Looks like we’re going for all the marbles. Next stop should be 1887.71.UPDATE: 2:37 PM
Here’s another one of those potentially big bounces that shouldn’t amount to much, but could here at the red 1.618. Should still target 1887.71, but I’d go to cash with very tight stops here at 1891.34.It could go as high as a backtest of the red midline at around 1898.25ish.
UPDATE: 2:40 PM
Thanks to USDJPY, getting another crack at 1887. Back to short at 1893.8.UPDATE: 2:45 PM
Reached 1887.71. I show the actual channel bottom at 1883.4, but this is definitely close enough. Back to cash here at 1887.21.I would expect a nice rebound here, but that last 4 points could prove problematic in the very near term. If you go long, which is probably okay, just use tight stops.
If the past few weeks is any indication, it’ll bounce around like crazy for the next hour, closing at or near the low for the day, which I’m assuming is 1880-1883. We’ve had a nice day, so I’m going to stretch my legs.
UPDATE: 2:58 PM
Final stretch. If it’s going to reverse down to 1883, this is the place. I’d try a short position here with tight stops, but call it quits if it pushes above the midline.
Note that NKD is bouncing pretty nicely off a .886, and USDJPY is backtesting its channel bottom. Watch both of these like a hawk if you try shorting here.
UPDATE: 3:06 PM
No dice. Back to cash for the day. Turning off my monitors till the close so I’m not tempted to spoil a perfect day!
As we discussed in yesterday’s The Century in Review, a very big picture look at SPX, we are rapidly approaching another one of those lines in the sand where stocks will either rebound or face significant additional losses.
The mechanisms by which previous swoons have been halted have, instead, been egging on the bears. Can this “market” be saved, or is it about to roll over?