

In our December 1 update on DX [Is DX Really Breaking Out?] I (somewhat cynically) suggested that DX’s rise above a key Fib level was just another scheme to convince investors that the markets were doing just fine.
TPTB have done their best to convince the investment world that higher rates are just around the corner — even as signs of a faltering global economy continue to stack up. Ramping the dollar up past a natural reversal point is just one more way to support that meme.
As the FOMC dates approach, keep an eye on DX. A sudden plunge below the .886 would be an excellent way of detecting that investors aren’t buying the story.
Since Dec 1 (the yellow arrow, below) DX has plummeted, forcing USDJPY and stocks lower as “investors” abandoned the yen carry trade. It got a momentary reprieve (the white arrow) when the FOMC raised rates on Dec 16. But, since then, it’s been all downhill until today — where it has nearly reached our next downside target. Clearly, the dollar’s performance is critical to stocks. What next, then, from the world’s reserve currency?
continued for members…Note that SPX has taken DX’s fall on the chin. This is practically a mirror image of the USDJPY v SPX chart I post so often. With SPX having recently completed and confirmed a large H&S Pattern targeting 1605 — a 13% drop from current levels at 1850 — the pressure will build to support DX at the .618 Fib at 95.607. It’s a very clear backtest of the broken gray channel, and works as a tag on the bottom of the rising red channel.
Whether or not TPTB support it there could be asked of many indices and currencies at this time. Just this morning, I posted a chart showing NKD is testing a key TL dating back to 2013 for the 6th time.
I’m pretty sure that if DX drops back into the gray channel thanks, perhaps, to the growing awareness that another rate hike isn’t very likely, we’ll see even more pressure on stocks. The really serious support is the red channel midline currently around 92.52 — last August’s lows (not to mention June’s, May’s and February’s.)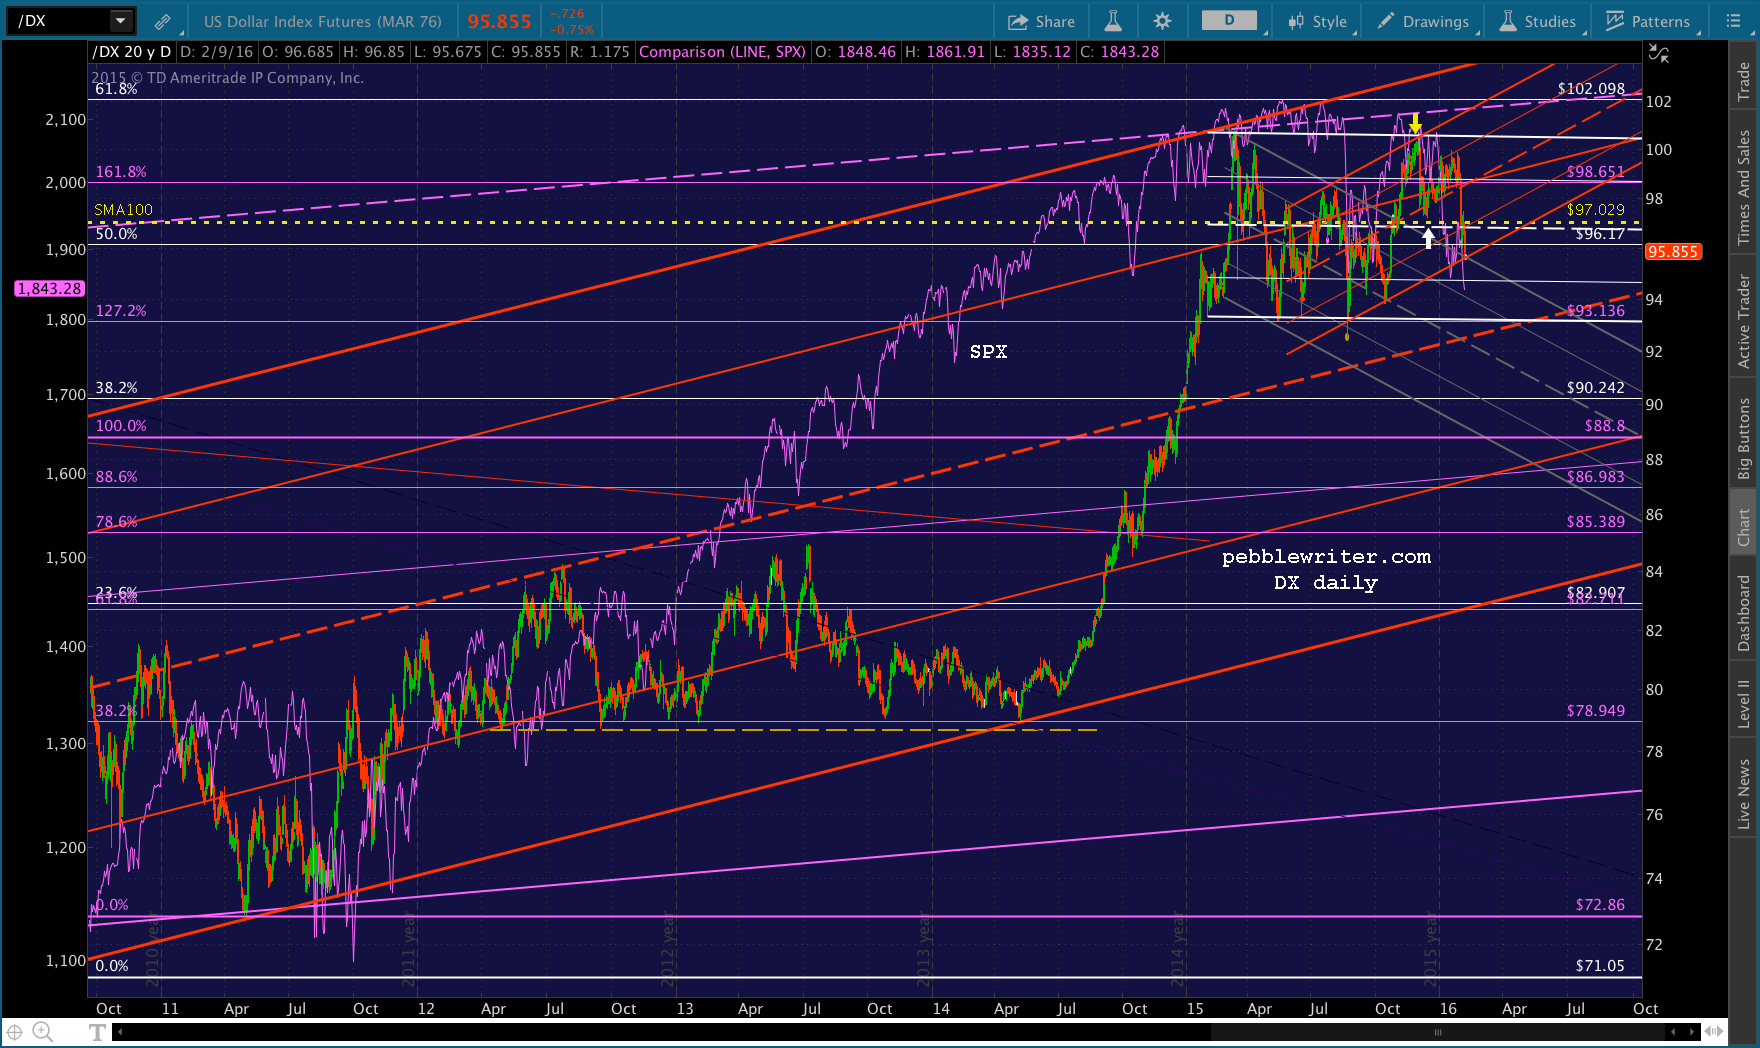 Consider this test by DX just one more line in the sand — along with SPX and ES’s H&S necklines, NKD’s 2013 trend line and TNX’s channel bottom — that will determine whether or not the worst is over.