

Final 24 hours…subscribe to pebblewriter.com and enter the code “Black Friday” in the space provided for a cool 68% savings off the first year of a regular Annual Membership — only about $2/day!
Better yet, lock in your savings with a Charter Annual Membership. For about $2.60/day, your price is guaranteed to never increase.
Either way, it’s a great way to save big while enjoying the best market forecasting available. Happy Holidays from pebblewriter.com!
* * * * *
Ever since DX completed its Bat Pattern on Nov 18, it has been established a series of higher highs and higher lows. Given that the lows were rising faster than the highs, it formed a rising wedge, seen in red below.  It was significant, because it not only enabled DX to finally close above its .886 (ever since the 27th,) it kept stocks on the rise even as USDJPY faltered.
So, it was with great interest that we watched DX’s rising wedge break down last night. It was confirmed by both the yen and euro, in that it was accompanied by a rapid plunge in USDJPY and spike in EURUSD.
But, look closely at where its decline stopped, and you’ll see that DX has, so far at least, merely backtested the broken .886. Will the Fib level hold, or is there more downside to come? And, what does this tell us about the Fed’s widely-anticipated rate rise?
continued for members…
First, note that we can overlay a rising channel on the rising wedge. It takes the aftermath of the (broken) rising purple channel and channels it upward – albeit at a milder pace.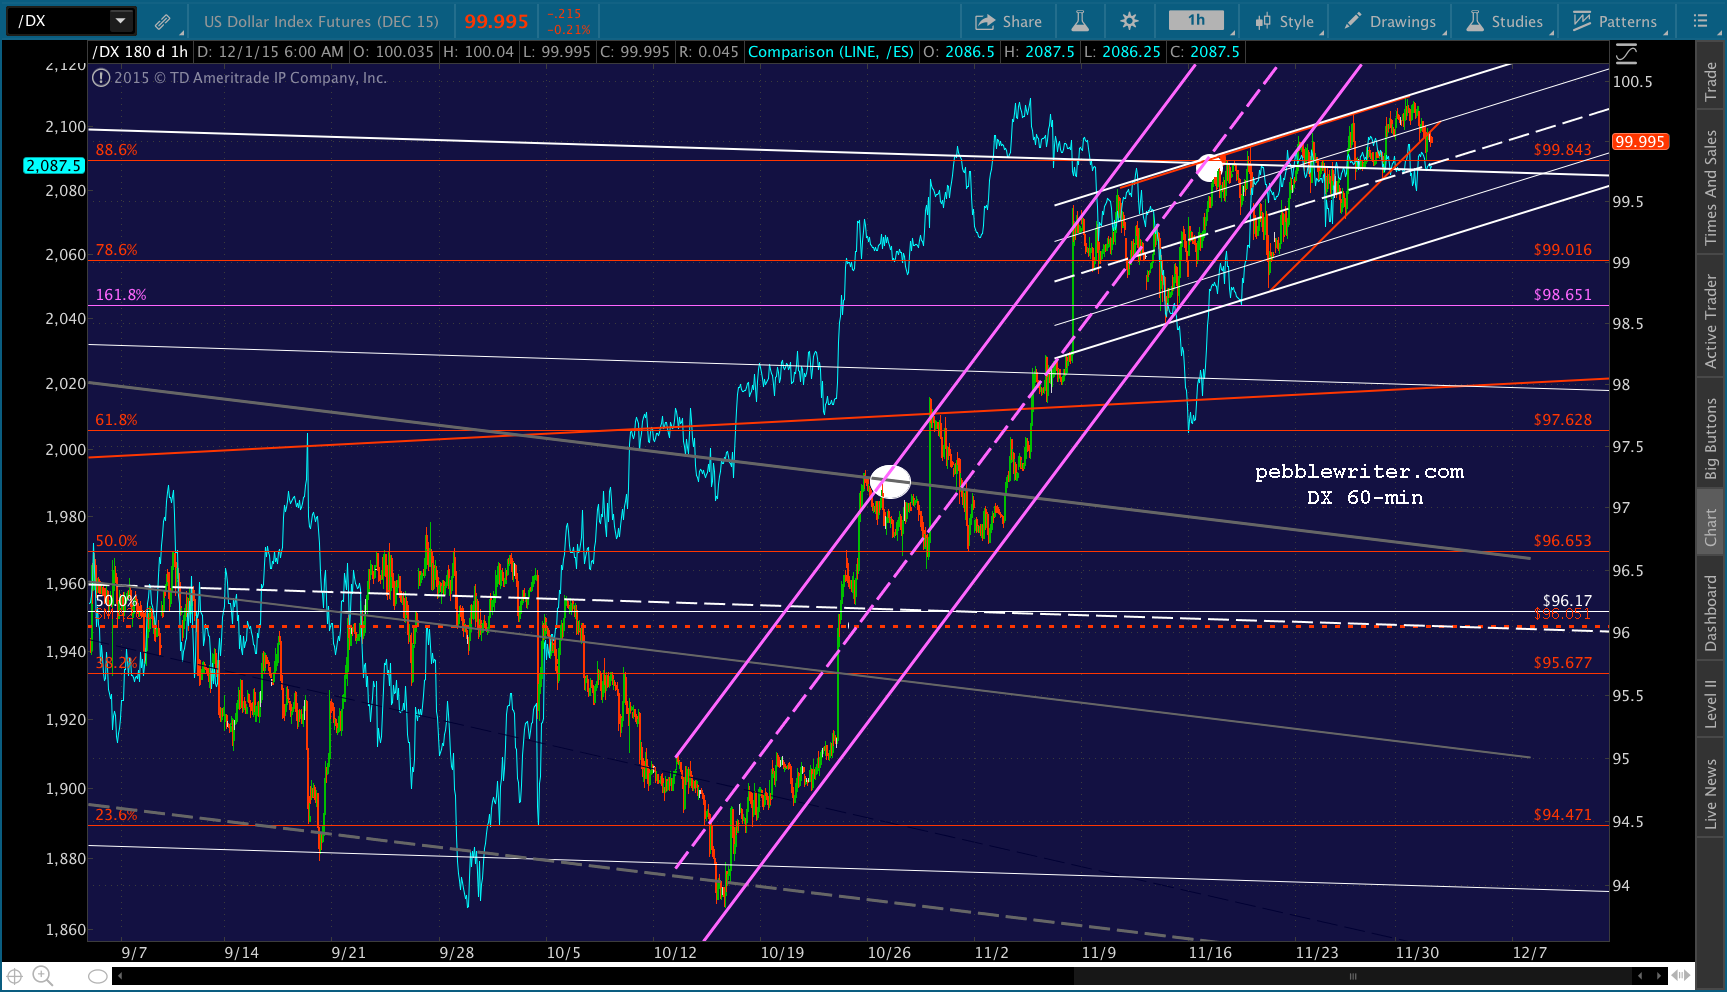 While it’s not as convincing as it might be, the rise above the .886 makes a statement — especially if the backtest is successful.
TPTB have done their best to convince the investment world that higher rates are just around the corner — even as signs of a faltering global economy continue to stack up. Ramping the dollar up past a natural reversal point is just one more way to support that meme.
As the FOMC dates approach, keep an eye on DX. A sudden plunge below the .886 would be an excellent way of detecting that investors aren’t buying the story.
* * * * *
Given the high degree of currency manipulation going on the past 36 hours, I’m going to forsake my usual play-by-play in order focus on getting other indices up to date. I’ll also be posting our November results, which look pretty good so far.
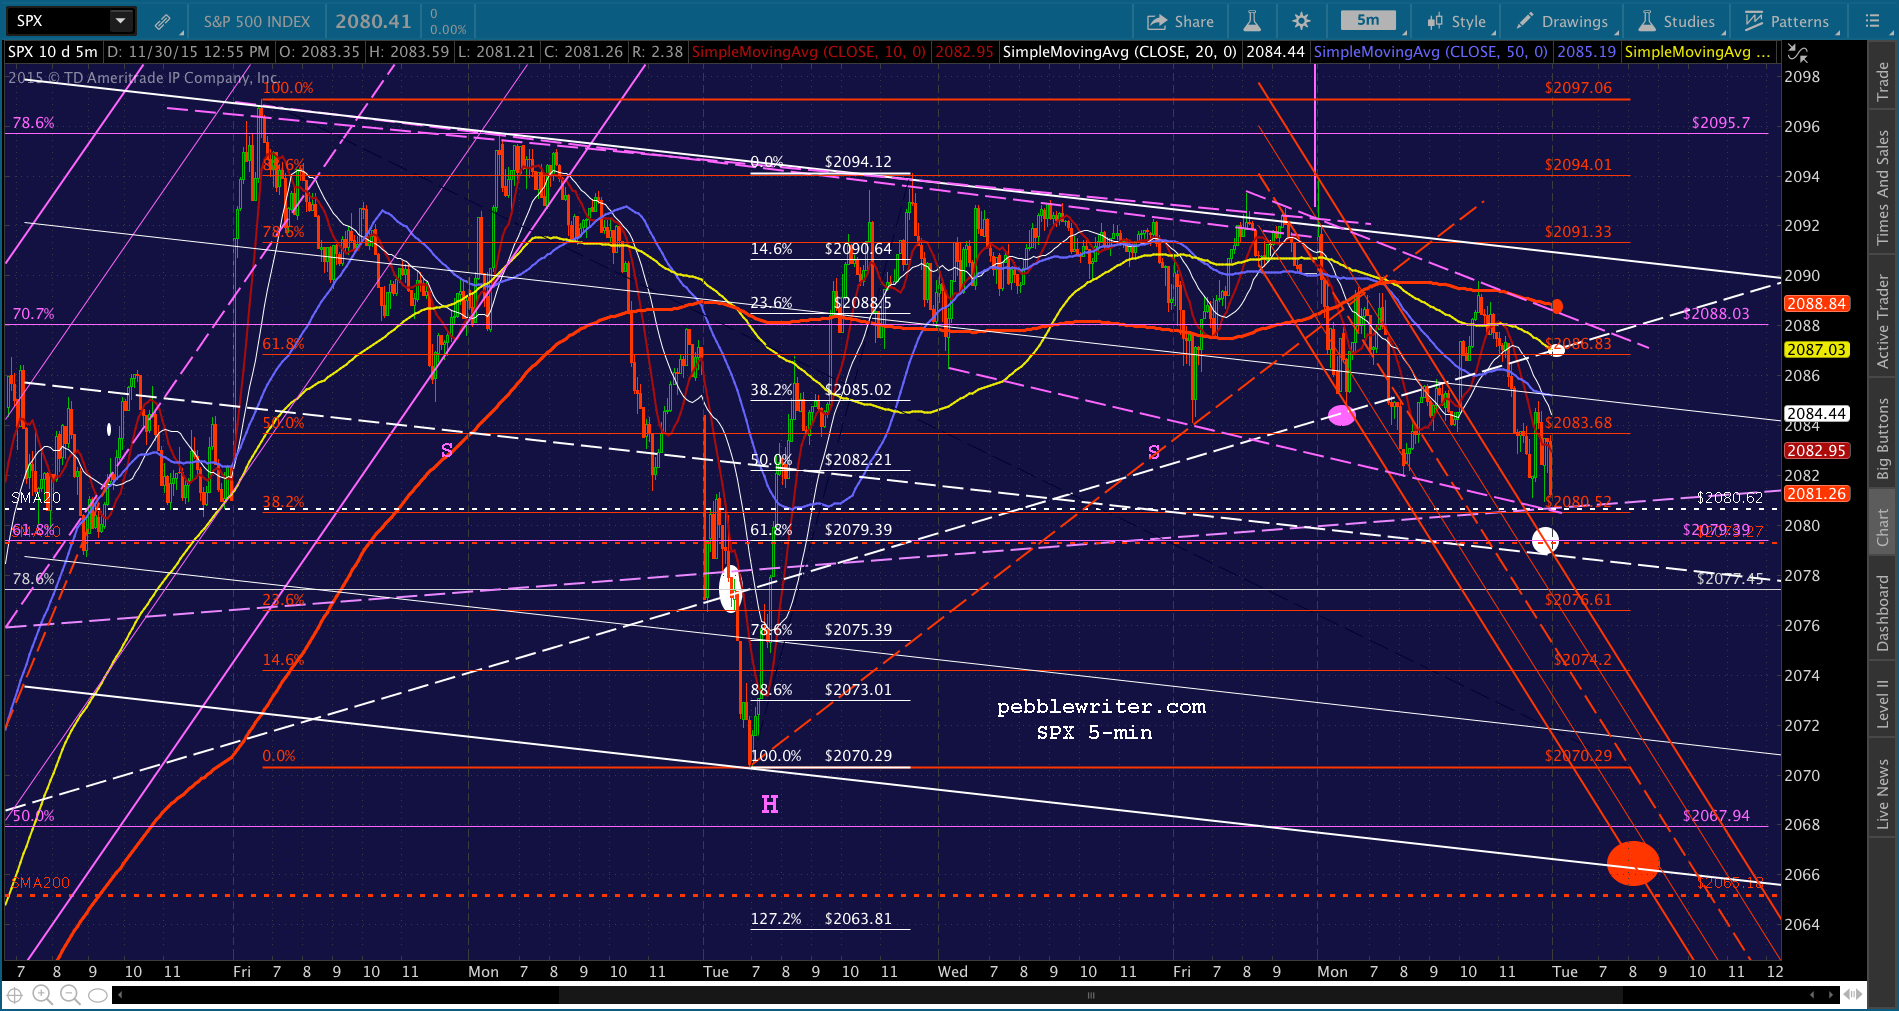
Once I’ve made some headway, I’ll check back in. In the meantime, here’s a quick look at SPX. Note that our efforts to each the SMA20 were finally realized — but, by the SMA20 coming to the index instead of the other way around.
Upside targets include a backtest of the white channel midline at the red .618 of 2086.83 or the purple TL off Friday’s highs at around 2088. The closest downside target is the white .618 (and red .382) at 2079ish.
 CL broke down overnight, but is in the midst of a huge backtest. Will it surprise anyone if it suddenly pops back above the channel bottom?
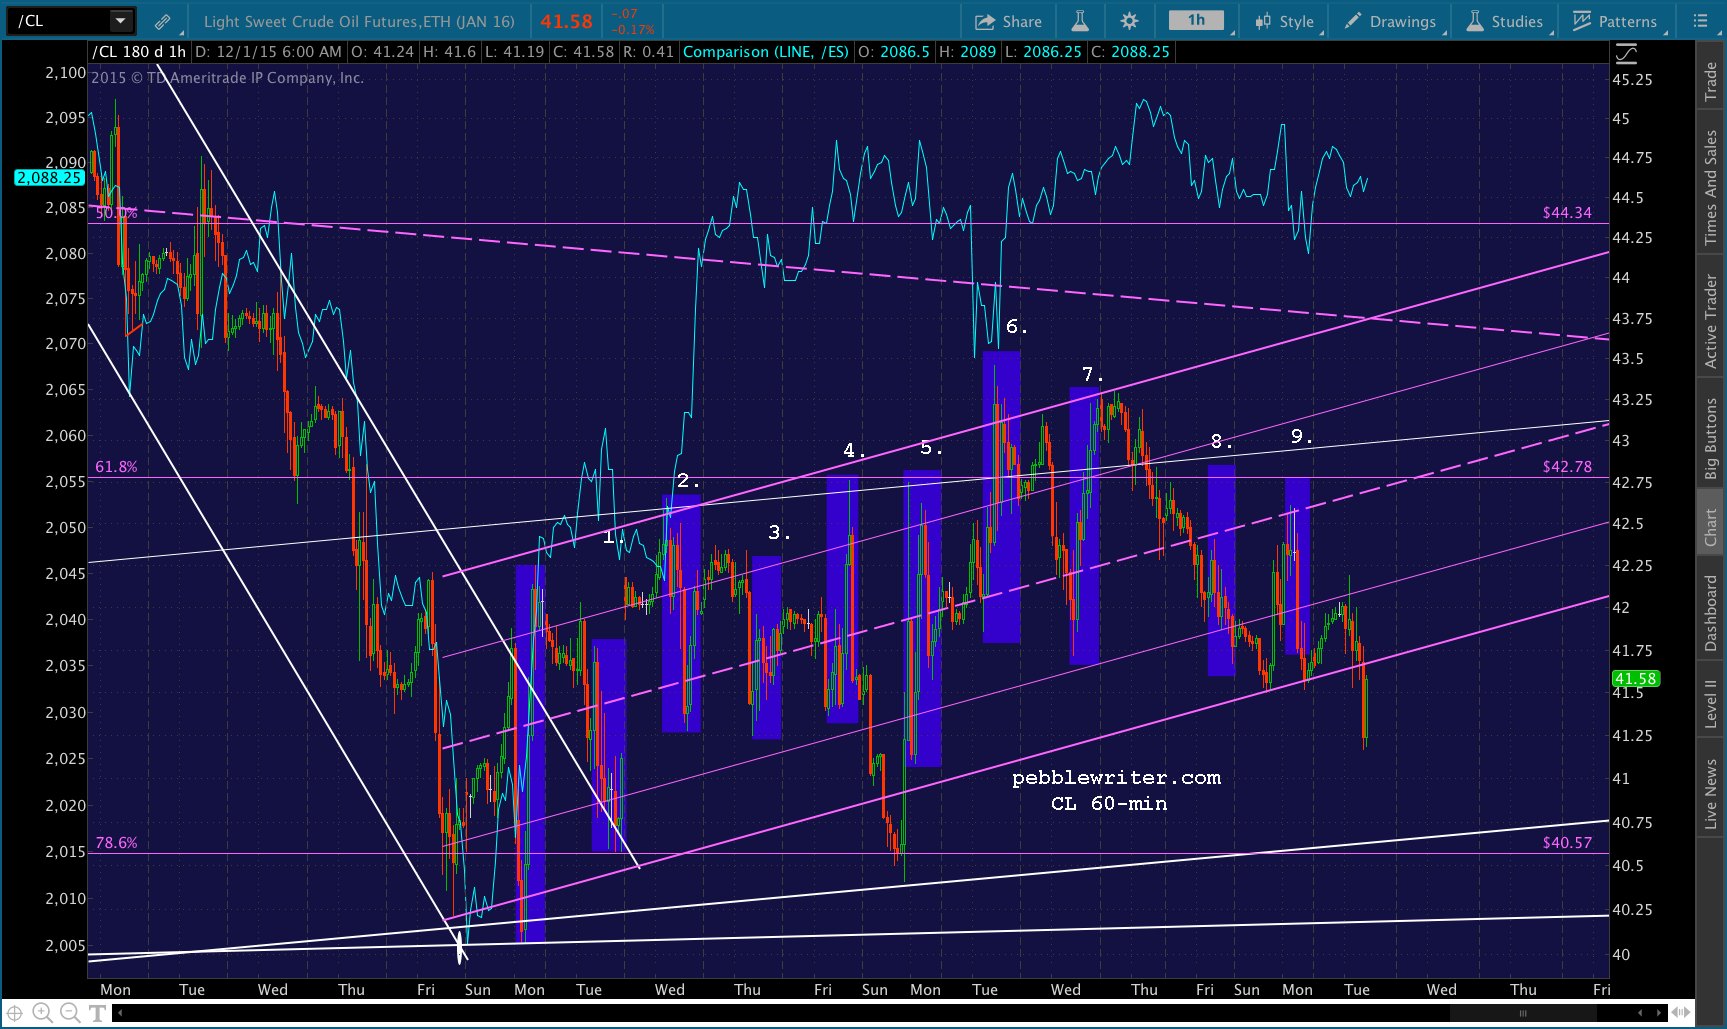 And, USDJPY — which plunged after market hours yesterday — is suddenly in the pink again. Again, no surprise — all part of the ratcheting exercise which has become so common.
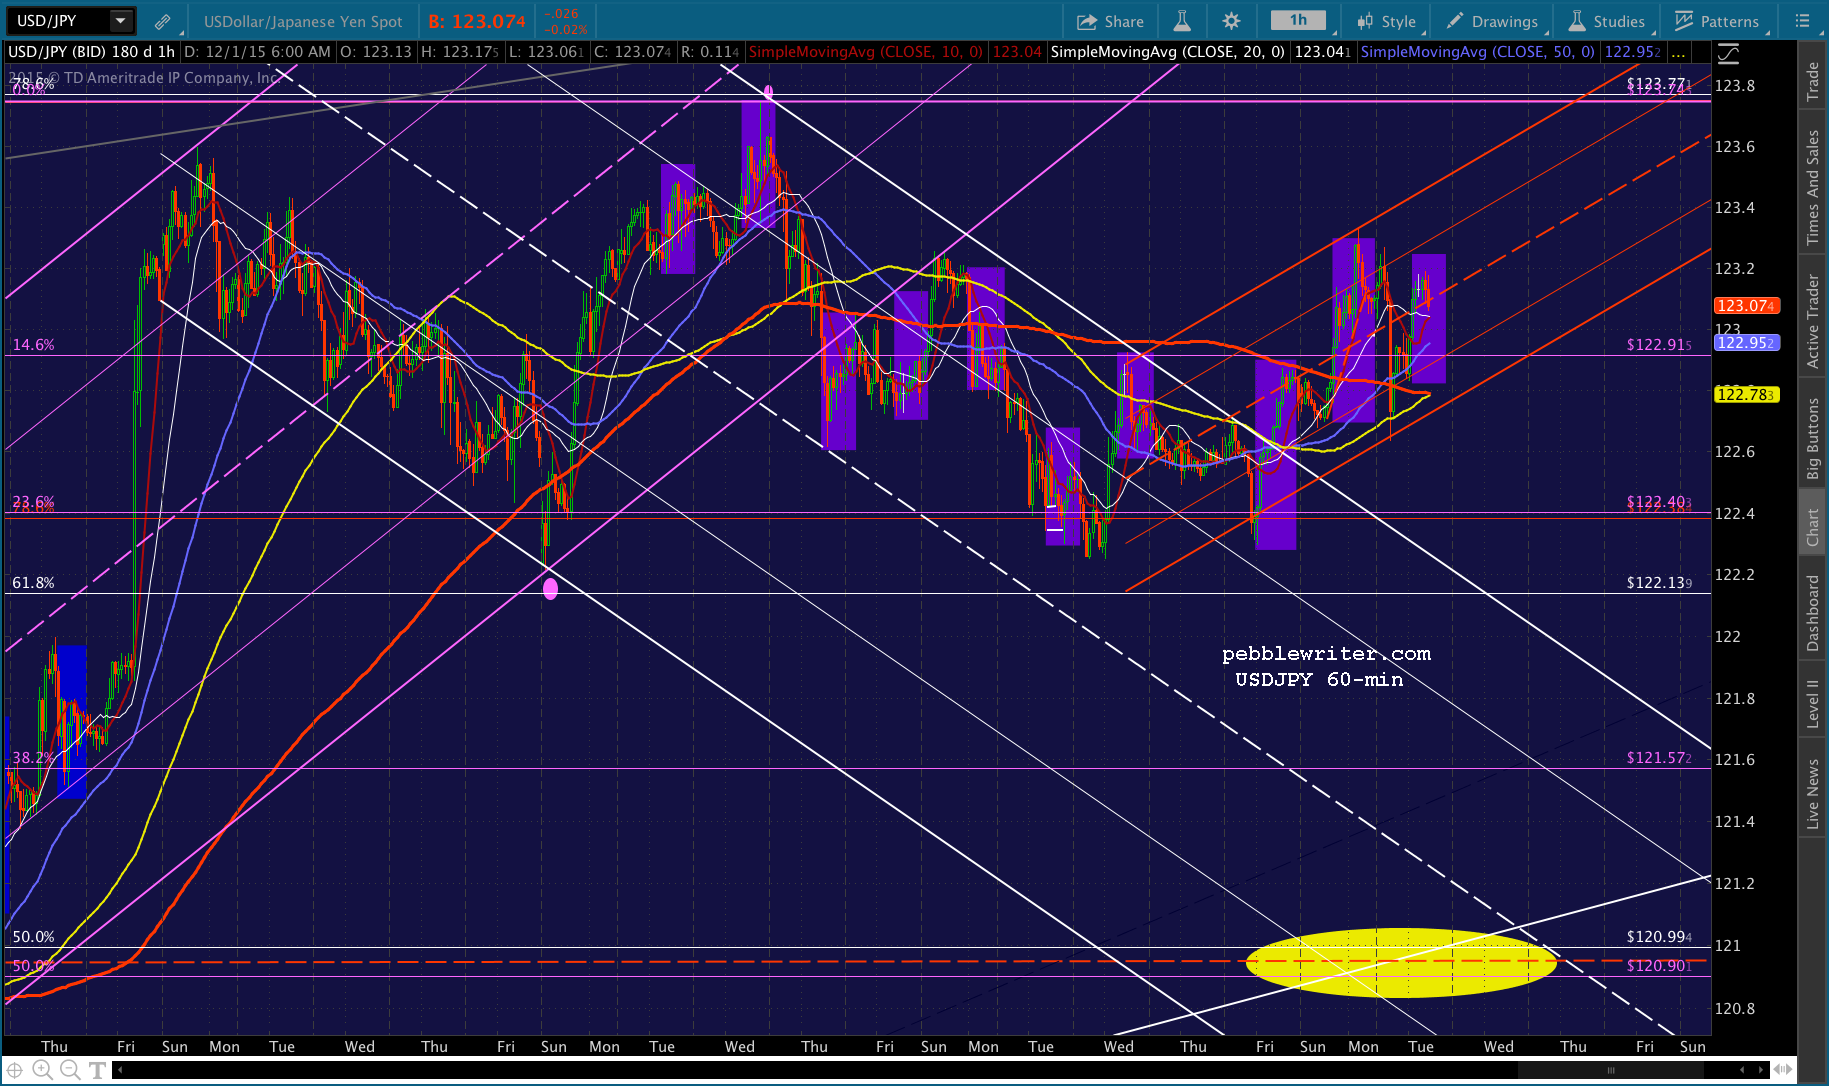 GLTA.
GLTA.
UPDATE: 3:00 PM
DX has found a floor – at least for now. 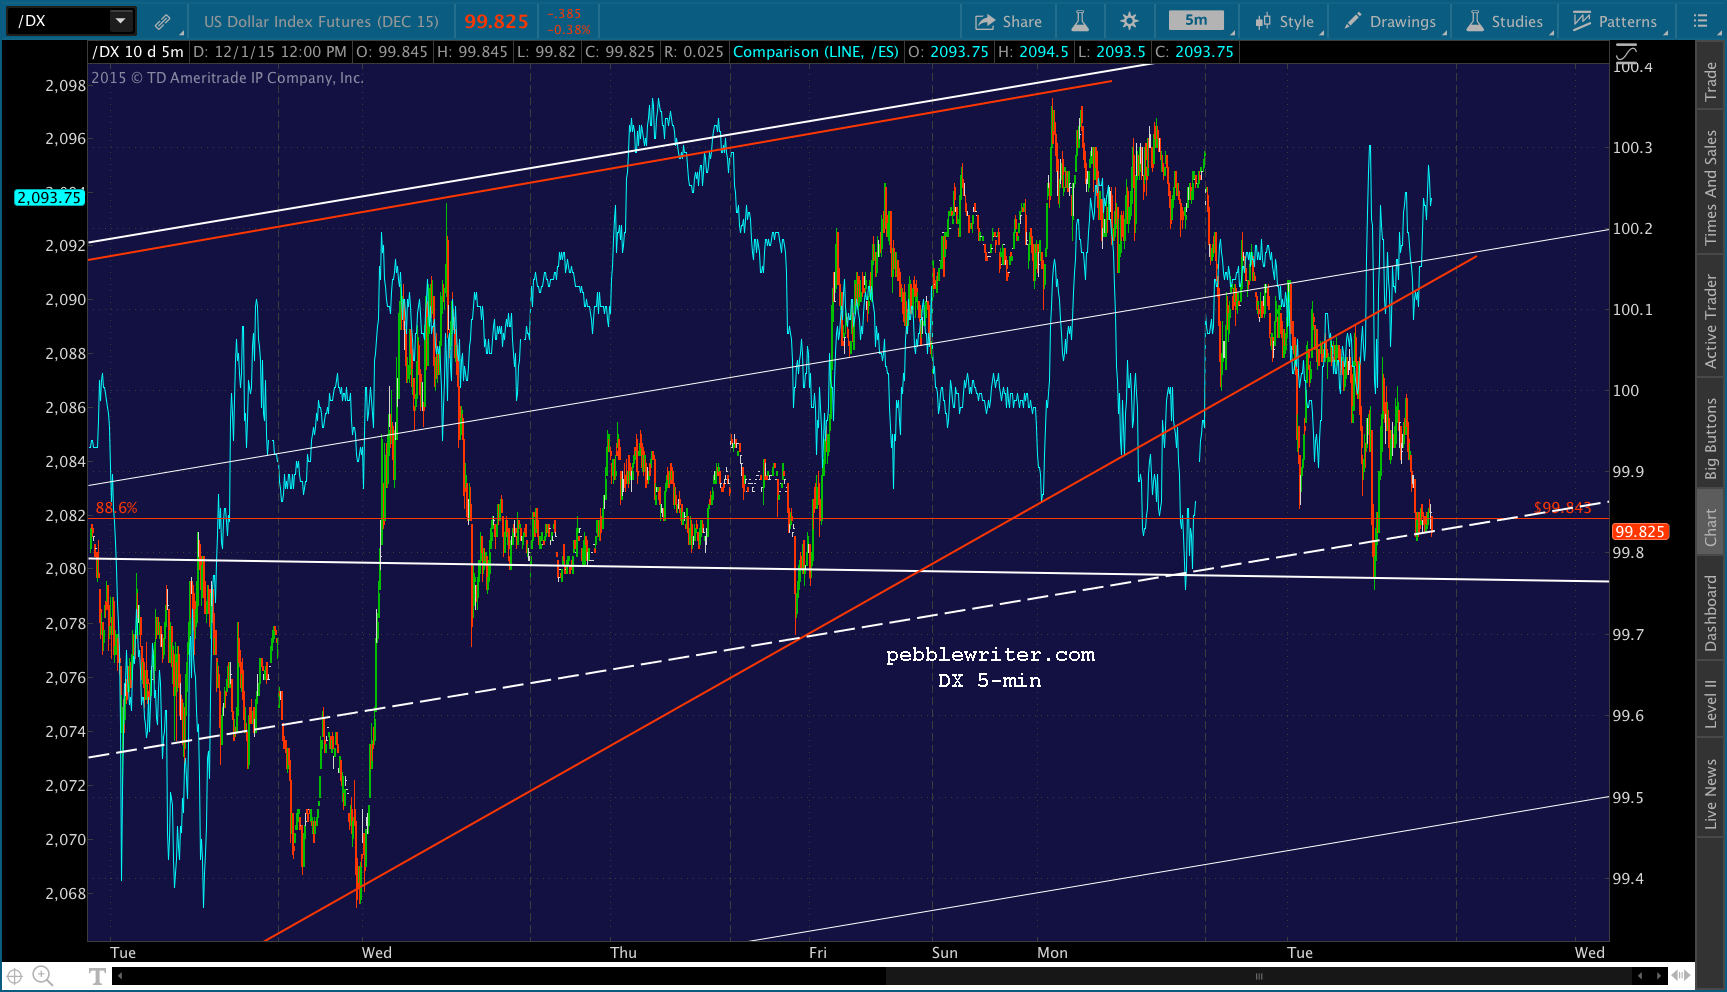 At the same time, CL is hanging onto the purple channel bottom.
 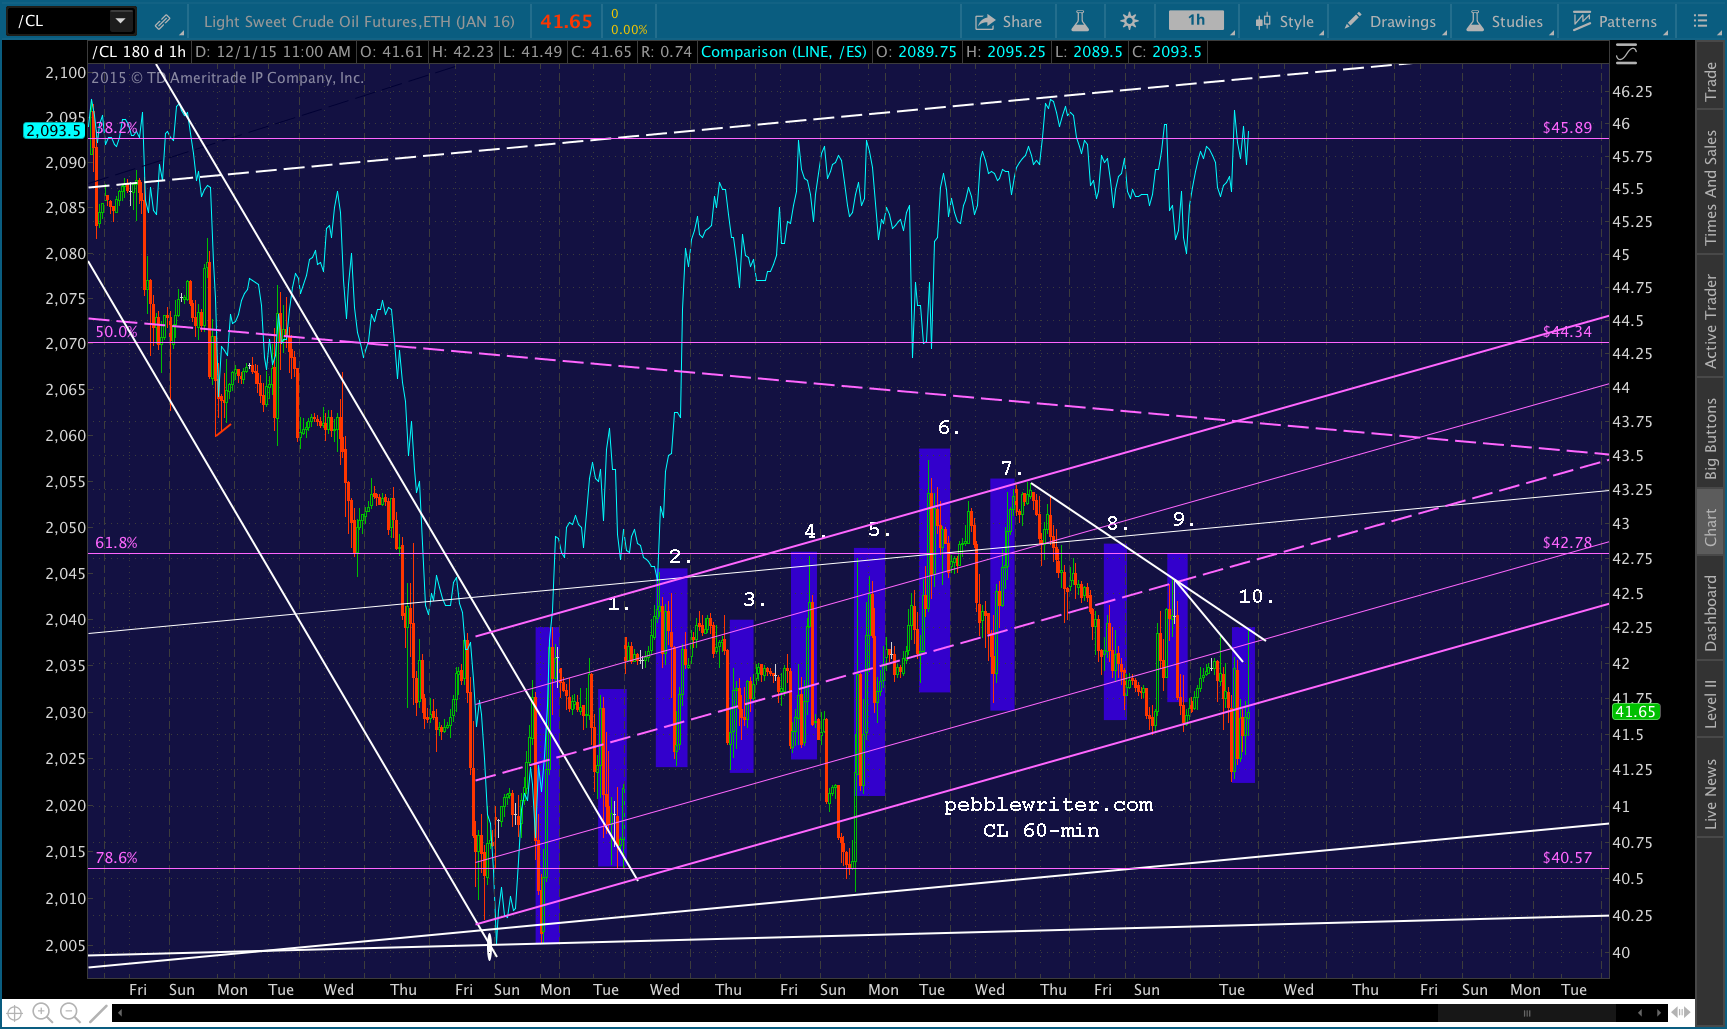 And, USDJPY is clinging to its white channel bottom.
 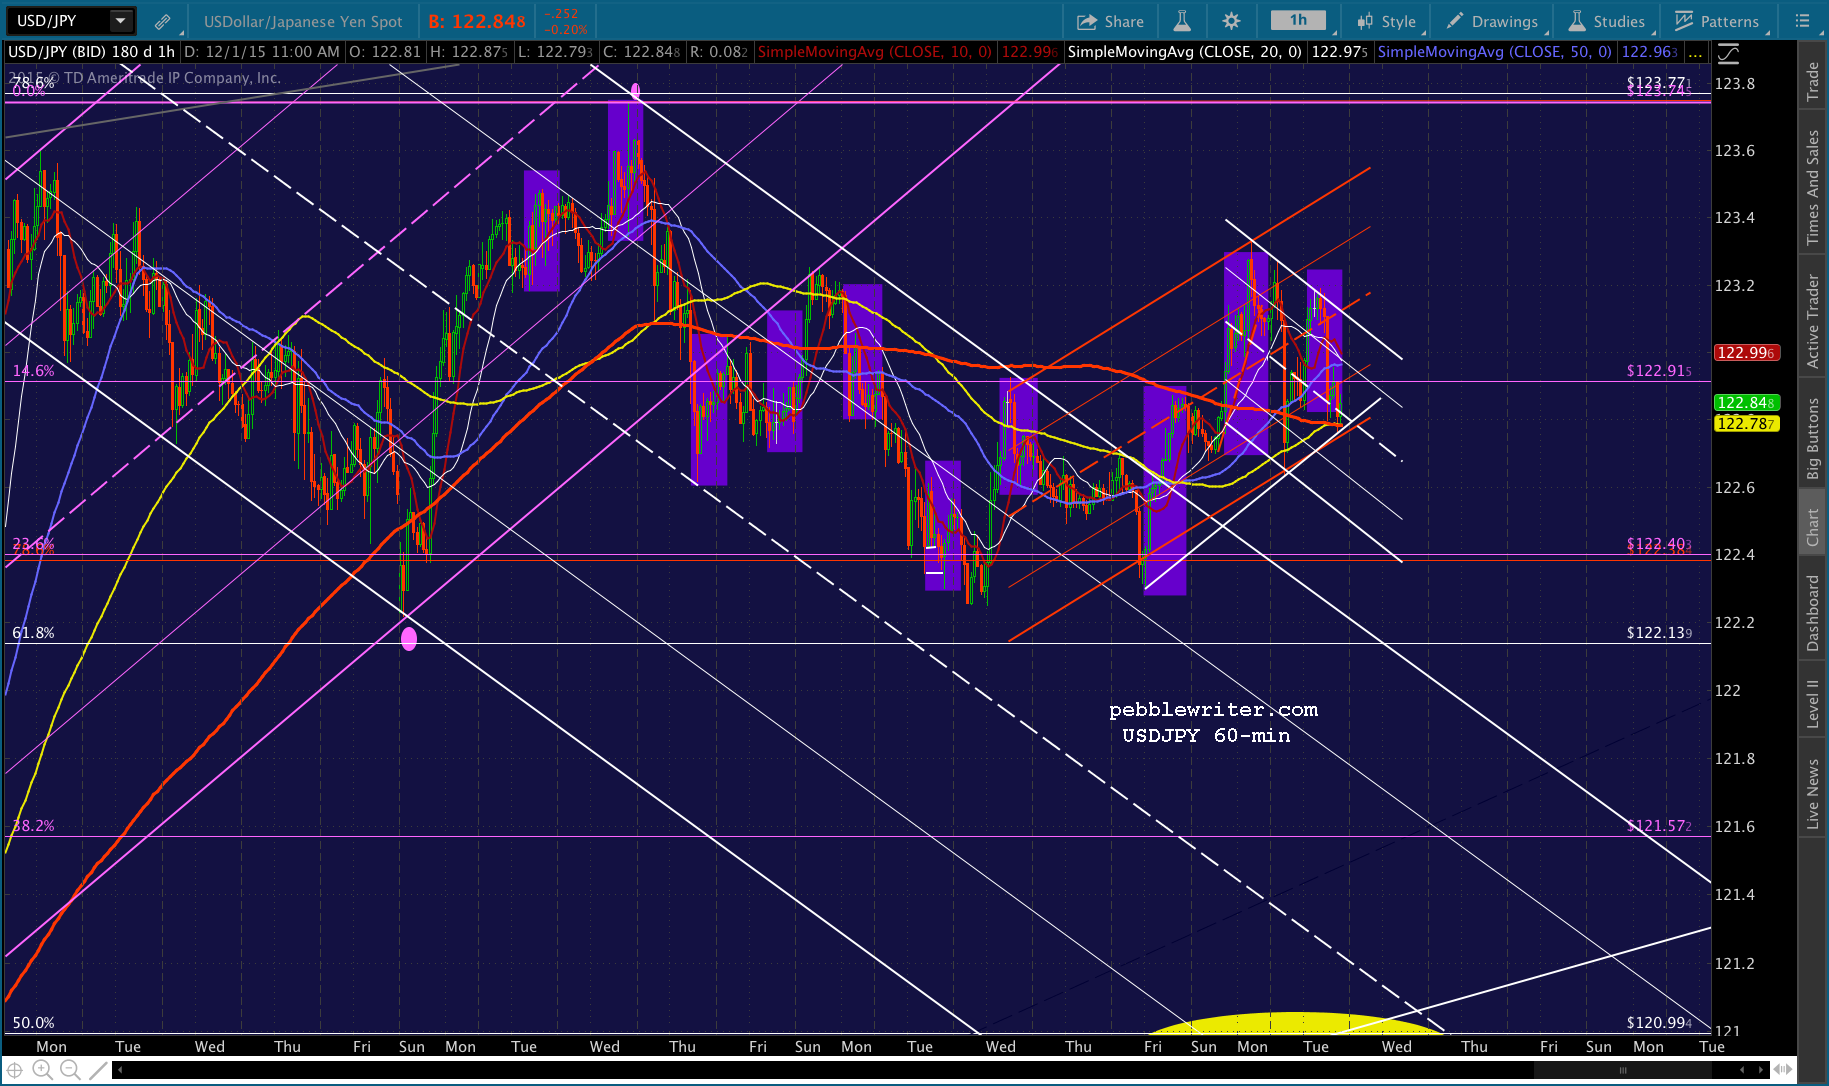 The whole thing looks about as sturdy as a house of cards. But, for now, the charts indicate SPX will move higher, possibly to the IH&S target at 2113-2116.
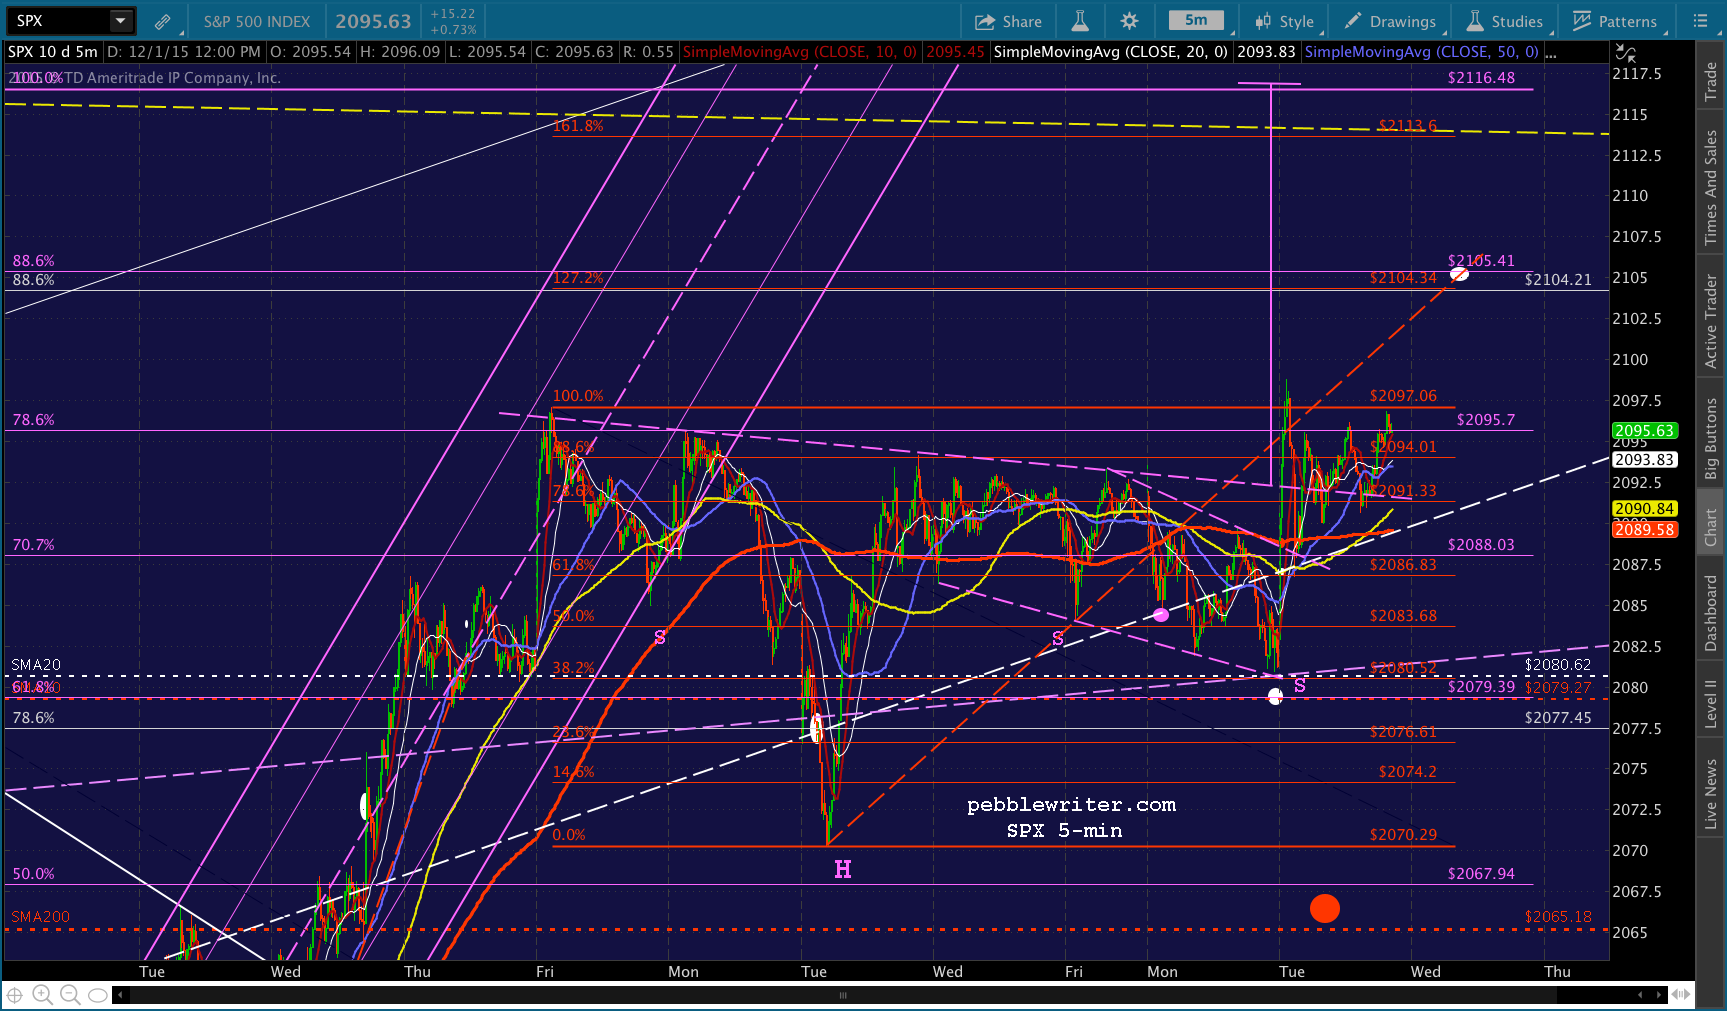
One other chart I’ve been watching: TNX. It has channel and moving average support here, so should support higher stock prices. Any drop through support, however, could spell trouble for equities.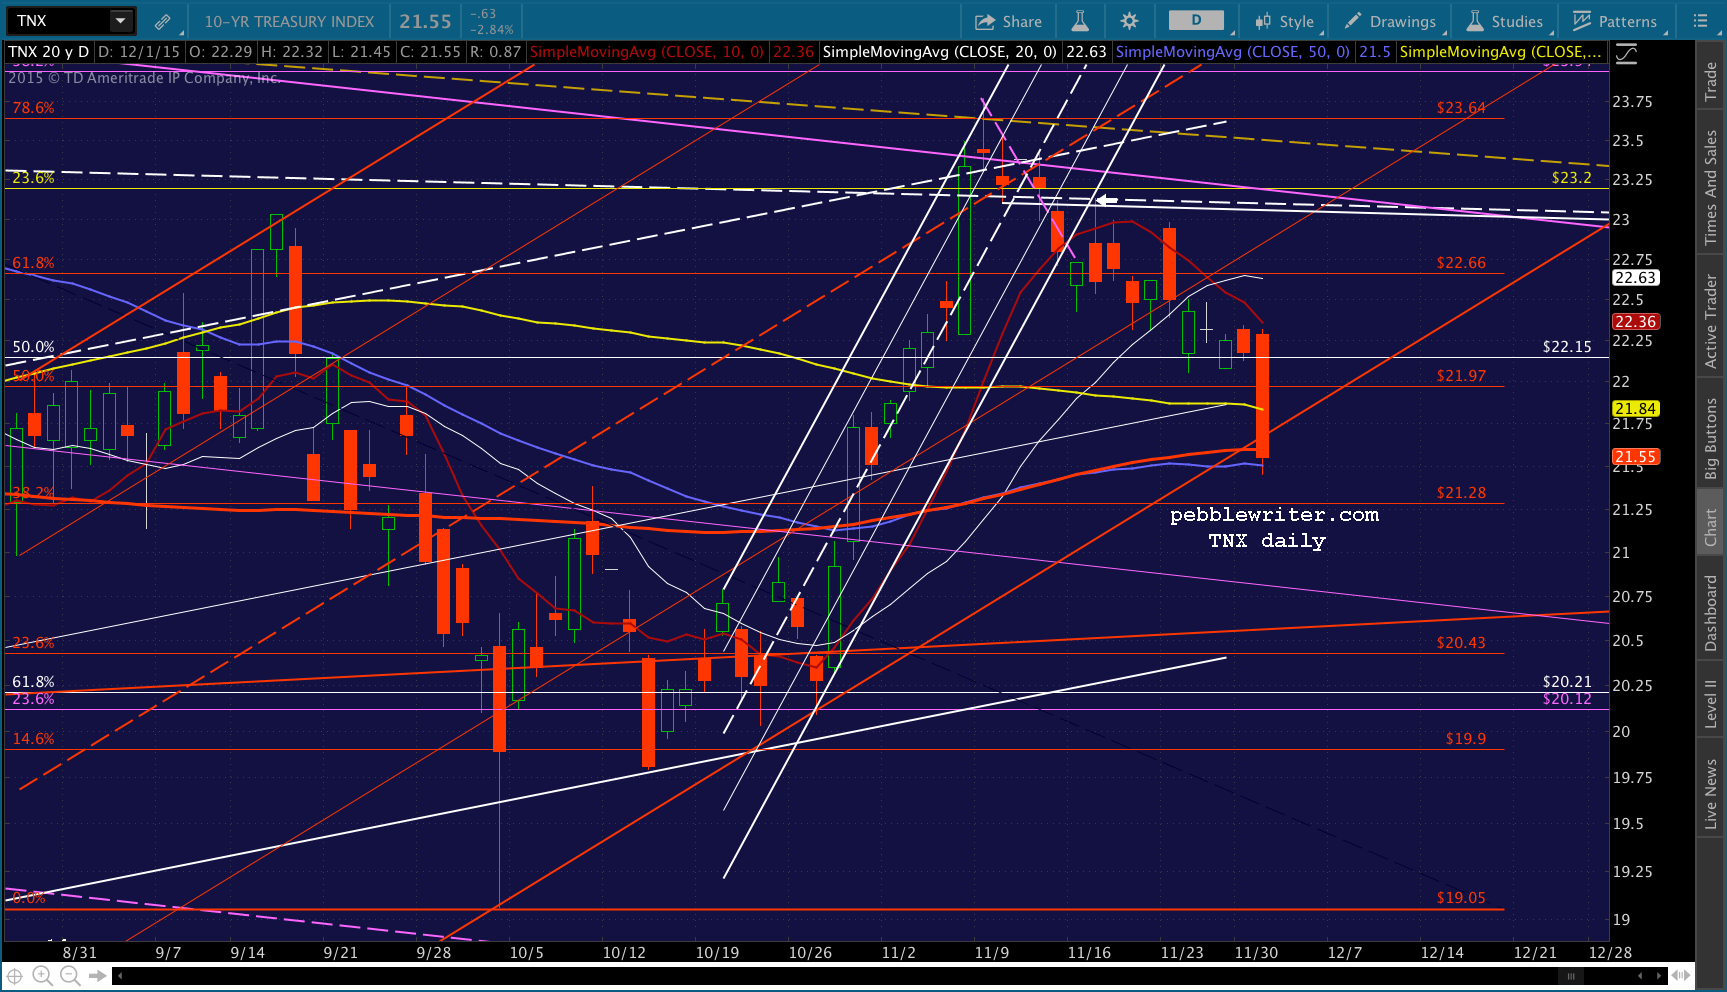 And, with all the CB speakers lined up this week, it could go either way. Bottom line, I’d be a scalper this week. Like this morning, I’d look for chances to earn 7-10 points and generally stay in cash overnight.
Comments
2 responses to “Is DX Really Breaking Out?”
hey pb what do u think of this market today
hi PB, have you take a look at bonds? Rate hike leak?