

Ten days ago, we outlined the predicament the market masters were in as a result of the yen’s strength [see: The Only Charts That Matter.] We maintained, then, that the BoJ needed to get USDJPY back above the bottom of the red channel bottom dating back to 2014 in order to save stocks.
Last night’s venture into NIRP for a very small portion of Japan’s debt burden managed to get USDJPY up off the channel bottom. But, gauging from the futures’ lethargic reaction, investors are underwhelmed. Note that the last time Kuroda et al levitated USDJPY, ES rebounded by 161 points, 117 of it in the first 24 hours. This time — an unimpressive 52 points.
Yes, USDJPY is back above the critical .618 Fib at 120.11. But, note that it stopped at the red channel midline, right where we can expect it to reverse. While TPTB are certain to pile into stocks today to endorse Kuroda’s brilliance, the reality is that we’ve seen this movie before. And, we didn’t like the ending.
The reality it that the yen carry trade [what’s this?] is fueled by the prospect of a continually cheapening yen — not one that flip flops about 120.11 for years on end.
If yen carry trade investors aren’t convinced that the USDJPY is ultimately headed higher, they won’t pile back into stocks. They’ll play the bounce, for sure.
But, a sustained rally isn’t in the cards unless Kuroda & Co. do something more dramatic than follow the ECB down the path of failed central planning policies.
continued for members…USDJPY is barely clinging to the red midline.  And, futures’ rally has been fueled just as much by another overnight CL levitation. It’s currently backtesting the broken purple channel, but will likely continue climbing up the bottom of this channel all the way to new interim highs (34.9) around the close.
 ES has failed to even hold the IH&S neckline.
 Look for SPX to push for the purple neckline at the .886 of 1920 today or Monday. Though the initial push will likely be limitecd to the .786 at 1908.35.
 UPDATE: 9:42 AM
SPX just reached our initial target at 1908.35. I’d take profits here at 1908.12 and wait for proof that it can head higher. Note that ES is still stuck in its Pennant Pattern.
 UPDATE: 9:49 AM
USDJPY is pushing higher to lever ES and SPX up past resistance — specifically ES Pennant.. Back to long here at 1908.36 for a push up to the purple neckline around 1916 and, if that breaks, the .886 at 1920.56.

 UPDATE: 10:06 AM
Look for SPX to backtest the .786 and let the SMA5 10 catch up. I’d revert to short here at 1915.04 for a drop to 1908.35 or so. UPDATE: 10:12 AM
That was premature. It got up to the neckline, allowing the SMA5 10 to slip up past the .786. So, the backtest isn’t likely to be very significant unless it waits here for the SMA5 20 to come along in 15-20 minutes. I’ll be looking for a entry point to go to cash again. UPDATE: 10:19 AM
Not getting any help from the algos. My hunch is that it’ll fall back any minute, but I don’t want to get stuck if it suddenly spurts up to 1920+ on a breakout. Back to cash here at 1917.05. UPDATE: 11:40 AM
No one can find the kill switch for the algos this morning. Reminds me of: https://www.youtube.com/watch?v=2N3gyhgHhe8
Wondering if it’ll happen when the SMA5 50 (blue) comes along at 1908…
 CL has dipped all the way back down to backtest the broken red channel, will slip into it if need be.
 USDJPY is back below the red midline.
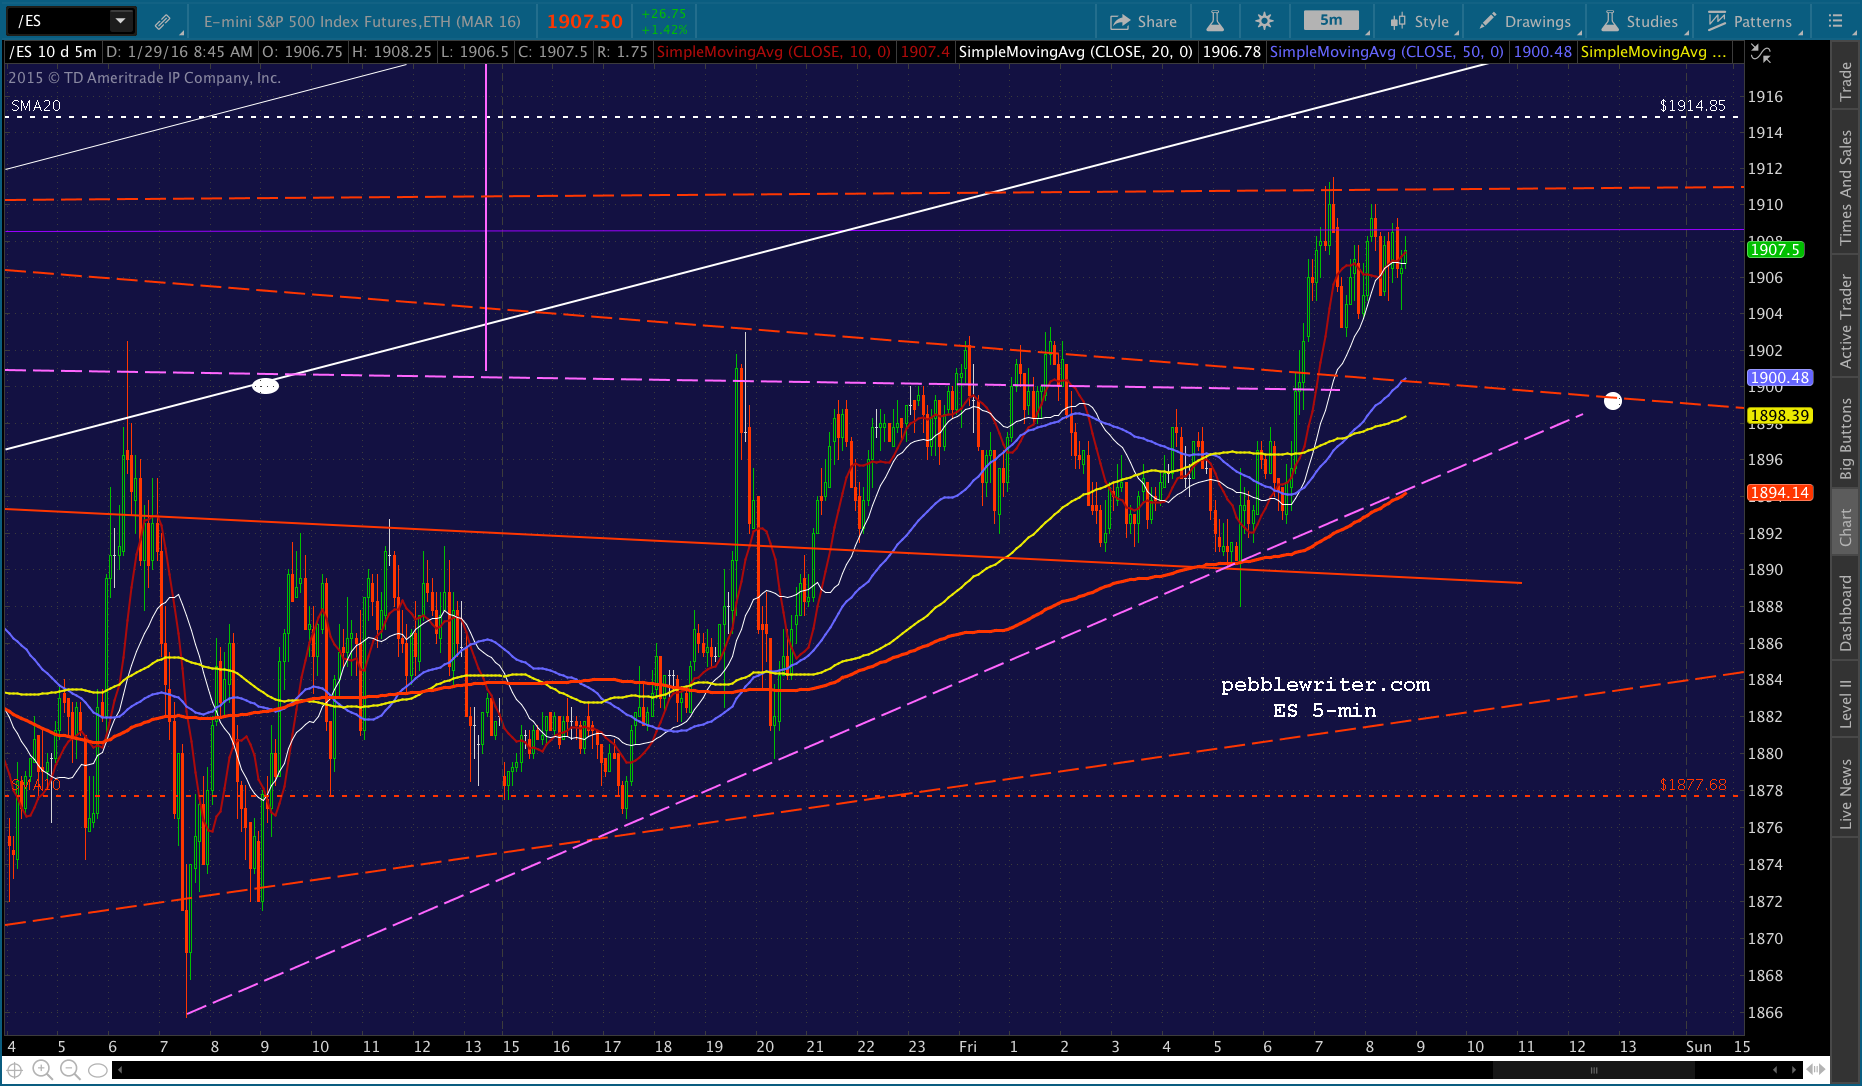
 ES suggests it could be a long, drifting day punctuated by a last hour surge.
 UPDATE: 11:54 AM
CL just spiked off the red channel top, so SPX suddenly shot up to our 1920.56 target and ES to its SMA 20. I wouldn’t chase it, but I would short it with tight stops. I’d give it about 2 points wiggle room, as ES’ SMA 20 is that far above current prices (1915.75.) Both USDJPY and CL’s moves look unfinished.

 UPDATE: 12:22 PM
ES has tested the SMA20 and backtested the rising white channel bottom. It’s supposed to drop back here.  But, CL has pushed back into the rising white channel midline that it should have backtested.
 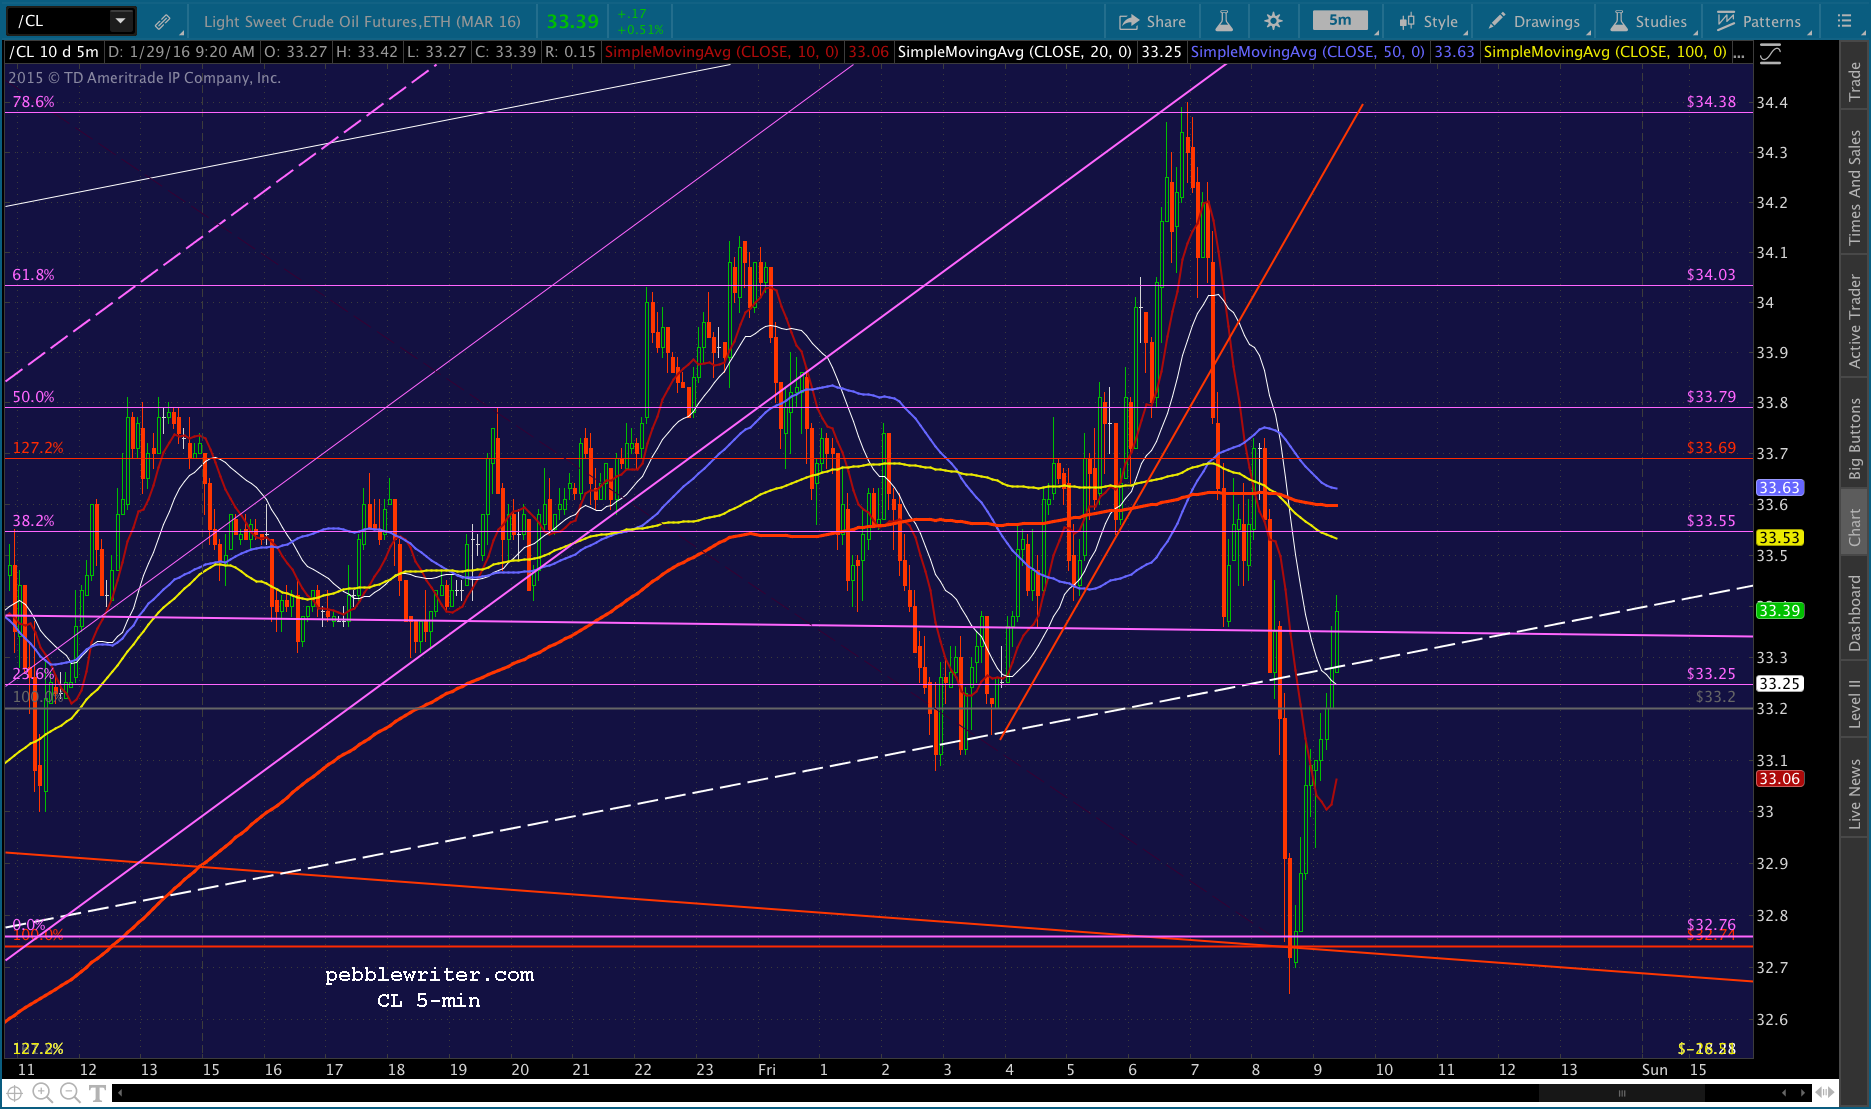 USDJPY, which started all this nonsense, is going nowhere — and, doing so below the red channel midline. Seems to me it doesn’t intend to push above it anytime soon.
UPDATE: 1:16 PM
My apologies for the delay. TOS just crashed on me. Totally unresponsive. And, it froze my computer in the process. Just had to reboot everything. After all this time, I’m bailing on the short position. I think it’ll head down to 1920, but can’t be very sure at this point. This has been a painfully unproductive way to spend the afternoon, but I’ve gained a little insight.
First, never short on a day when a central bank announces an enhancement to their QE unless the “market” first breaks down below support. This sounds fairly obvious, I know. But, the fact is if the Fed, ECB or BoJ isn’t supporting the move, it’s got downside potential. Otherwise, they are, and it doesn’t.
Second, the algos are paying strict attention to the Nikkei futures — tick for tick. When NKD tests the SMA5 10, SPX does. Ditto for the SMA5 20. And, if NKD drops through one of those short-term SMAs, you can bet they’re aiming for a particular backtest. Once it’s reached, NKD quickly rebounds and is on its way.
And, it takes ridiculously little effort. Because stocks are tied so tightly to their every twitch, the volume involved in making it happen is laughably small. Here’s NKD’s action since yesterday afternoon. Look how many contracts it took to push NKD below the red TL to 17880 — and how few it took to get it back on track. At any given time, there are perhaps 5-10 contracts on either side of the spread — no match at all for someone with even a little bit of money and a hankering to push prices around a bit. And, to think, just this morning I was reading on Zerohedge about an imminent crash.
 And, this ties into the last point: the algos are alive and well. Whatever chart patterns might indicate, when the volume is low and central banks or anyone else with a few bucks want to push things around, you’d better believe they can. The only exception is when something big happens quickly, and doesn’t allow them time to get in front of it.
There’s a good example right here. CL just reversed off a TL from the top… …and, USDJPY broke down below short-term SMAs. It looks like it’d headed right for our downside target posted hours ago — but, at the gentlest rate of decline imaginable.
  Surely, SPX would at least backtest the .886 right here, right? It’s barely budged. NKD is staying put, so SPX has, too.
I’ll try shorting here at 1930.37 just for grins, and we’ll see how low it goes — if at all. The SMA5 20 is way down at 1927.06. If we’re real lucky, maybe we’ll get a SMA5 50 tag at 1922.  UPDATE: 3:12 PM
USDJPY is dropping below the presumed TL of support towards our actual target… …but, CL is threatening to break out of a triangle…
 …and, NKD is actually pushing higher, closing in on last night’s highs.
  So, SPX is also moving higher. The very strong hint is that the short position be closed before something really bad happens — which probably means it’s finally about to drop.
  But, there’s just as good a chance that USDJPY lightly skims the bottom of our red channel and, together with CL, drives SPX up to above 1934.47 to run some stops.
None of it makes sense. It’s as bogus as hell. But, it’s how the algos are destroying what’s left of the markets. I’d close the short position here, BTW.
UPDATE: 3:34 PM
NKD should push above its former highs, so look for SPX to do the same. Didn’t take much volume… Once SPX exceeds 1934.47, look for the meltup to really get underway.
 UPDATE: 3:57 PM
Panic buying and stop running… There’s a new IH&S target that actually makes sense from a Fib standpoint. Now, USDJPY can finally come on down and tag its SMA5 200.
  CL’s triangle can break down.
 And, NKD can conveniently backtest its former highs.
Comments
3 responses to “BoJ Underwhelms”
I think your EOD chart on Wednesday was spot on, just too early. Guess we now know which path SPX chose.
now we know why usdjpy was so resilient the past few days.. seems that they already decided on NIRP..
Usually how long does it take to reverse such a move pebble?
Don’t get me wrong. Just because this move is fabricated completely out of currency manipulation disguised as economic policy, it won’t necessarily collapse. The BoJ was almost solely responsible for the rally ever since Oct 2011. This is truly an abomination. But, I don’t expect them to reverse course any time soon. Unlike the Fed, whose reputation is on the line, the BoJ/GPIF has 15% of Japan’s GDP tied up in stocks. As discussed months ago in Japan’s Equity Trap, they can’t afford to walk away. https://pebblewriter.com/japans-equity-trap/