

Lots of charts updated yesterday: CL, COMP, AUDUSD and DJIA. I hope to finish several more today.
SPX melted up all day, yesterday, to the tune of CL and a late surge by USDJPY — tag teaming stocks higher. We finally had a reversal where expected, and SPX dropped to backtest the H&S neckline its been working so hard to avoid playing out.
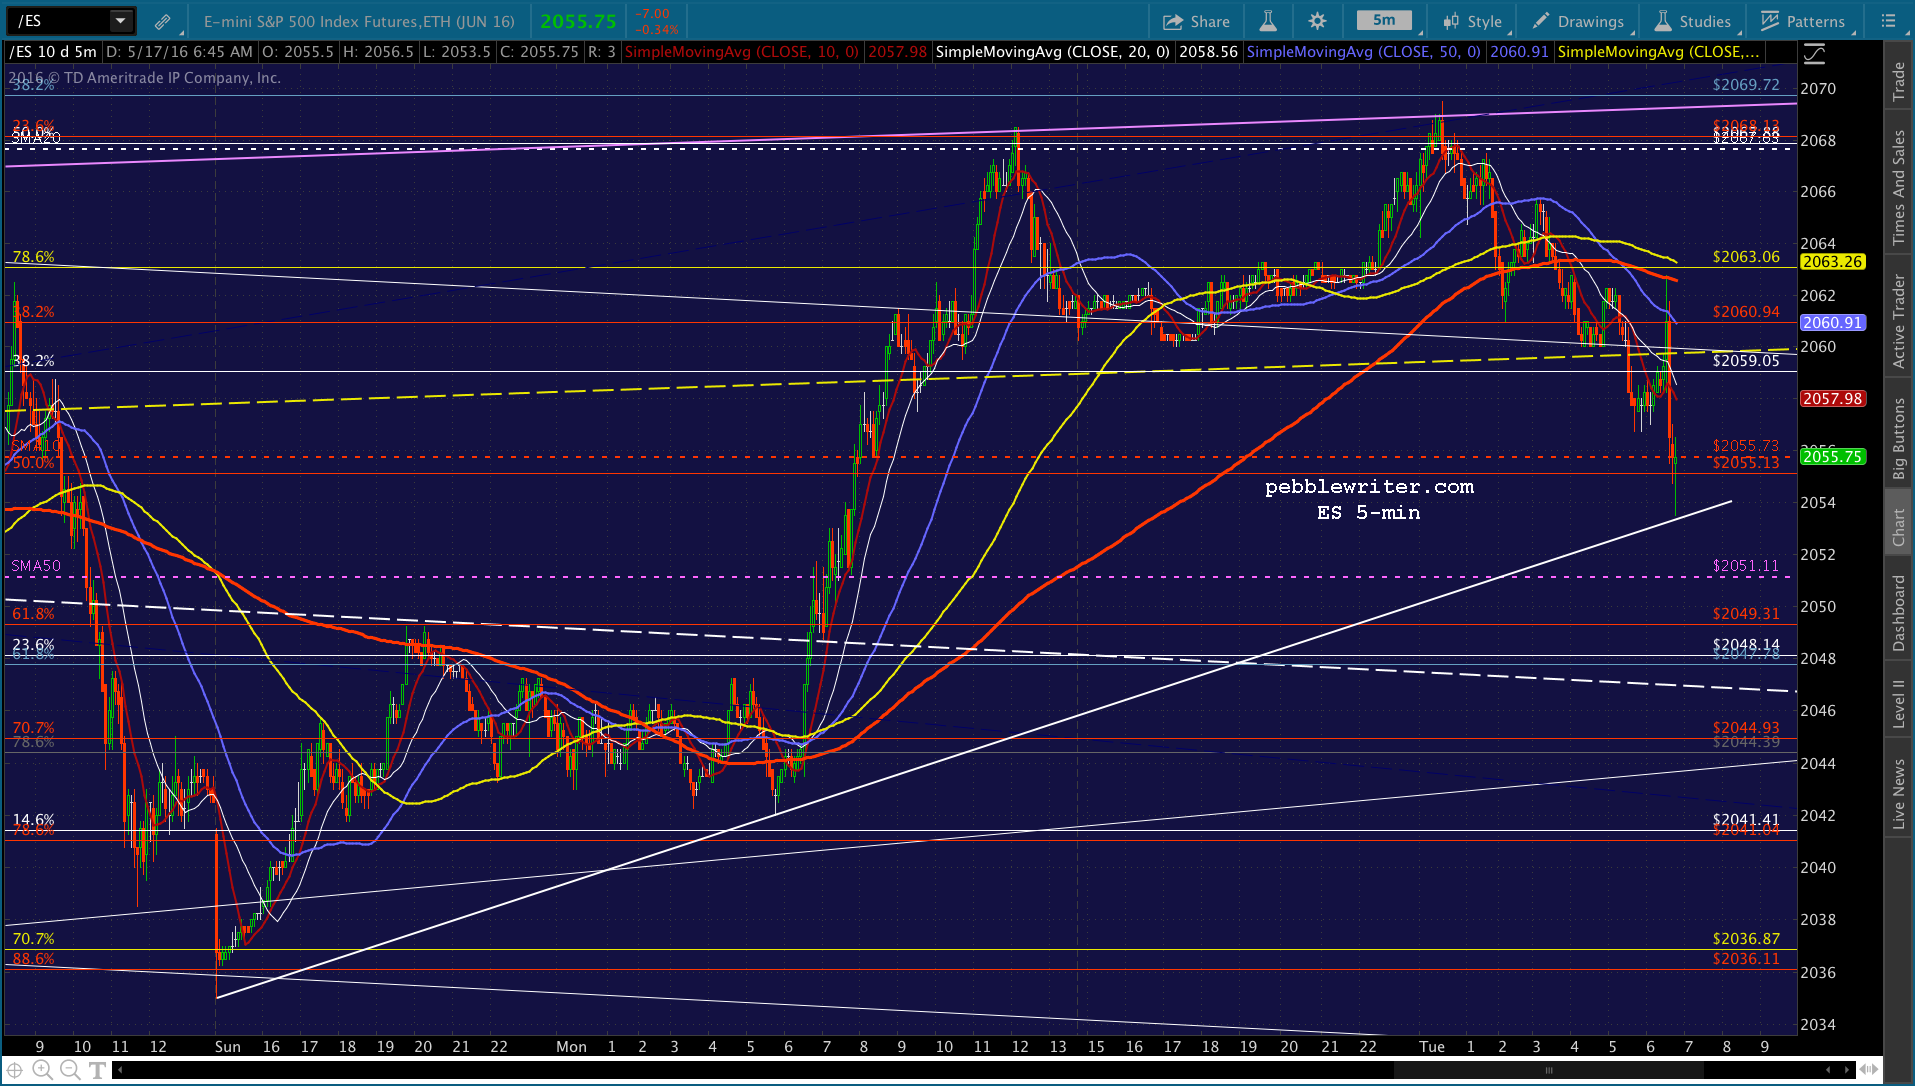
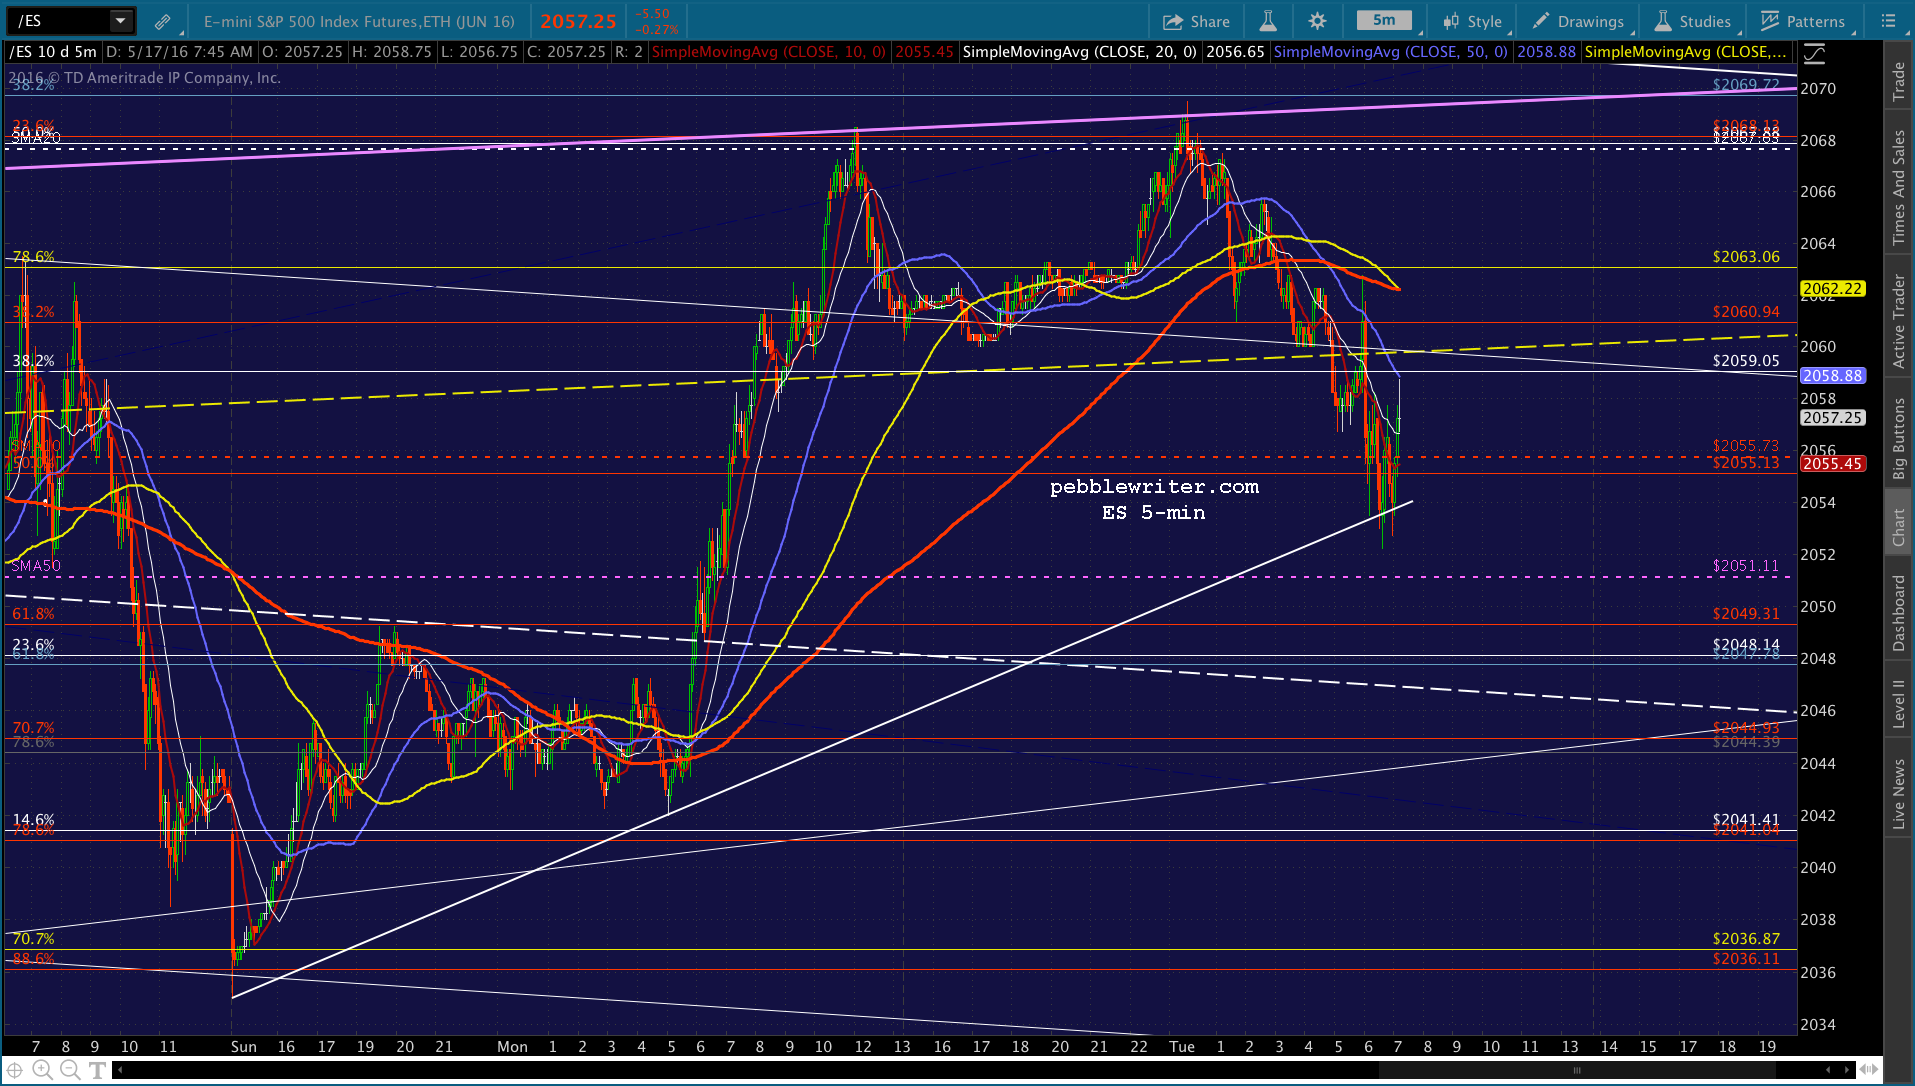
It appears, from the futures’ action, we’ll get a shot at the IH&S discussed near the end of yesterday’s session.
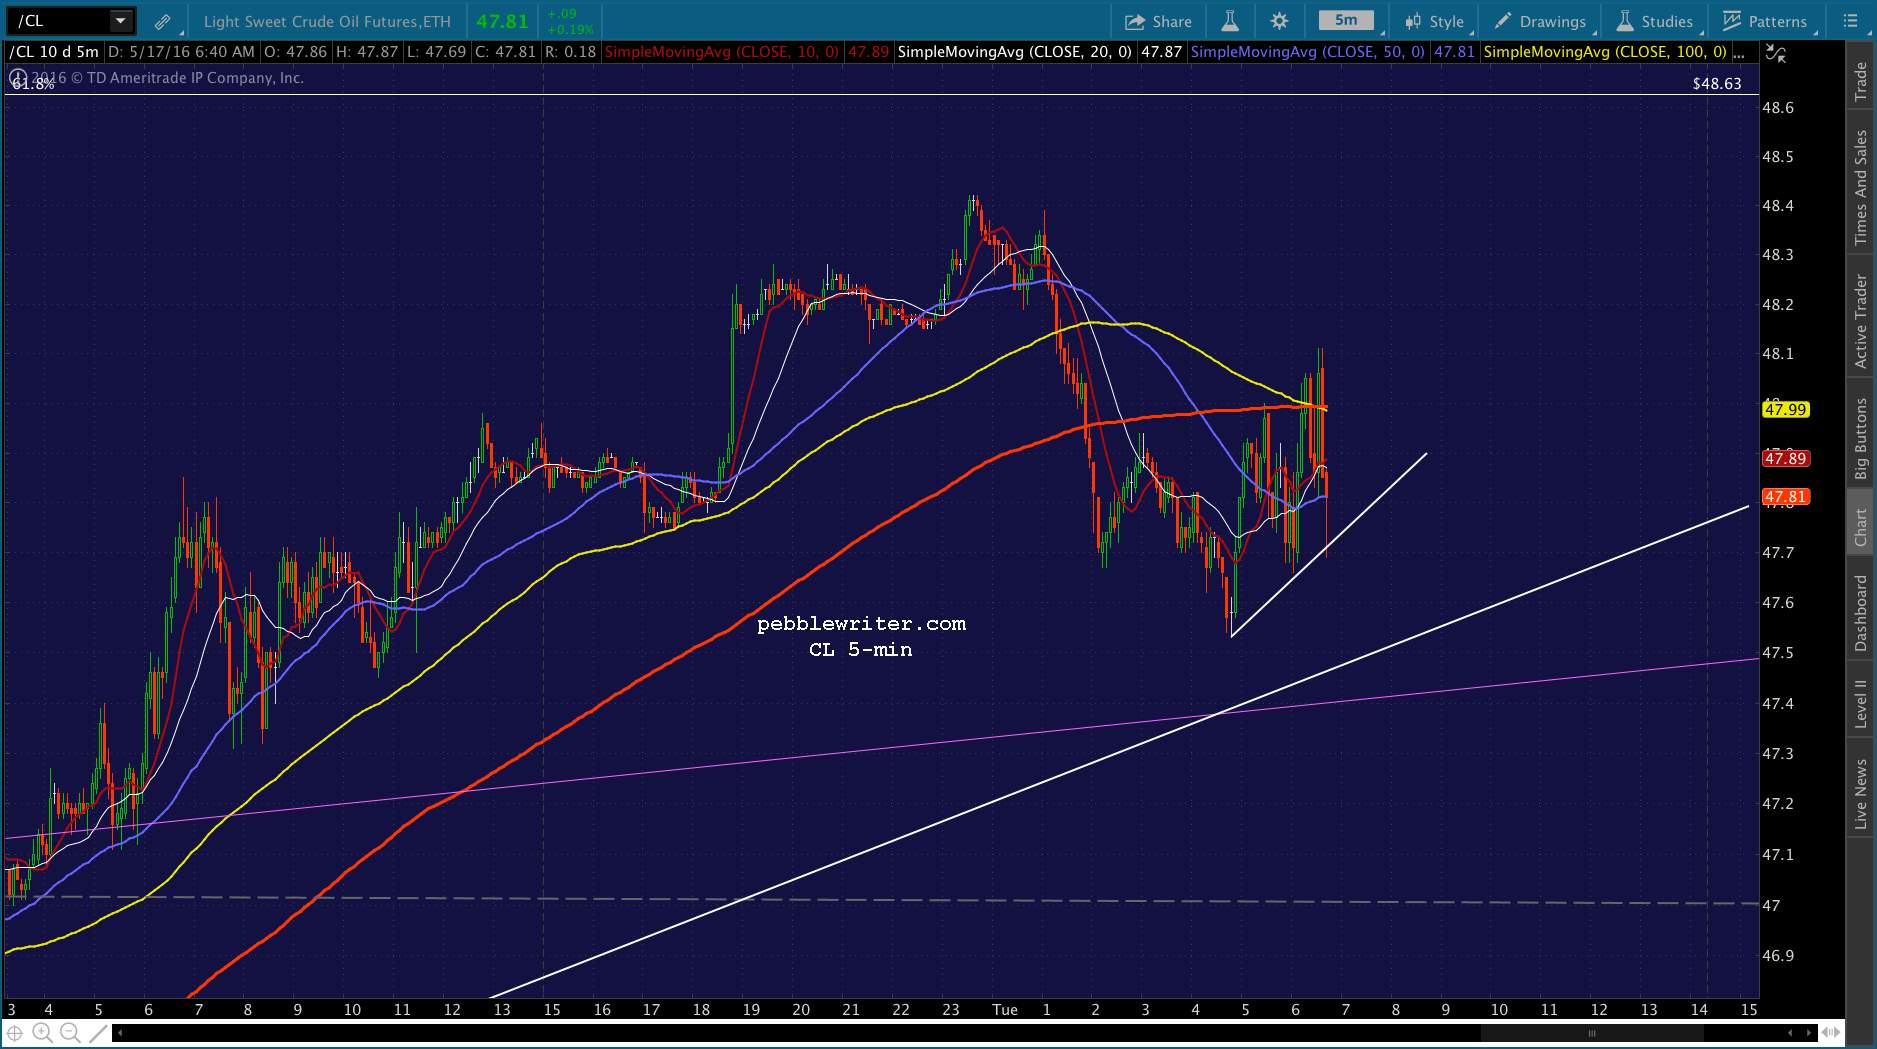
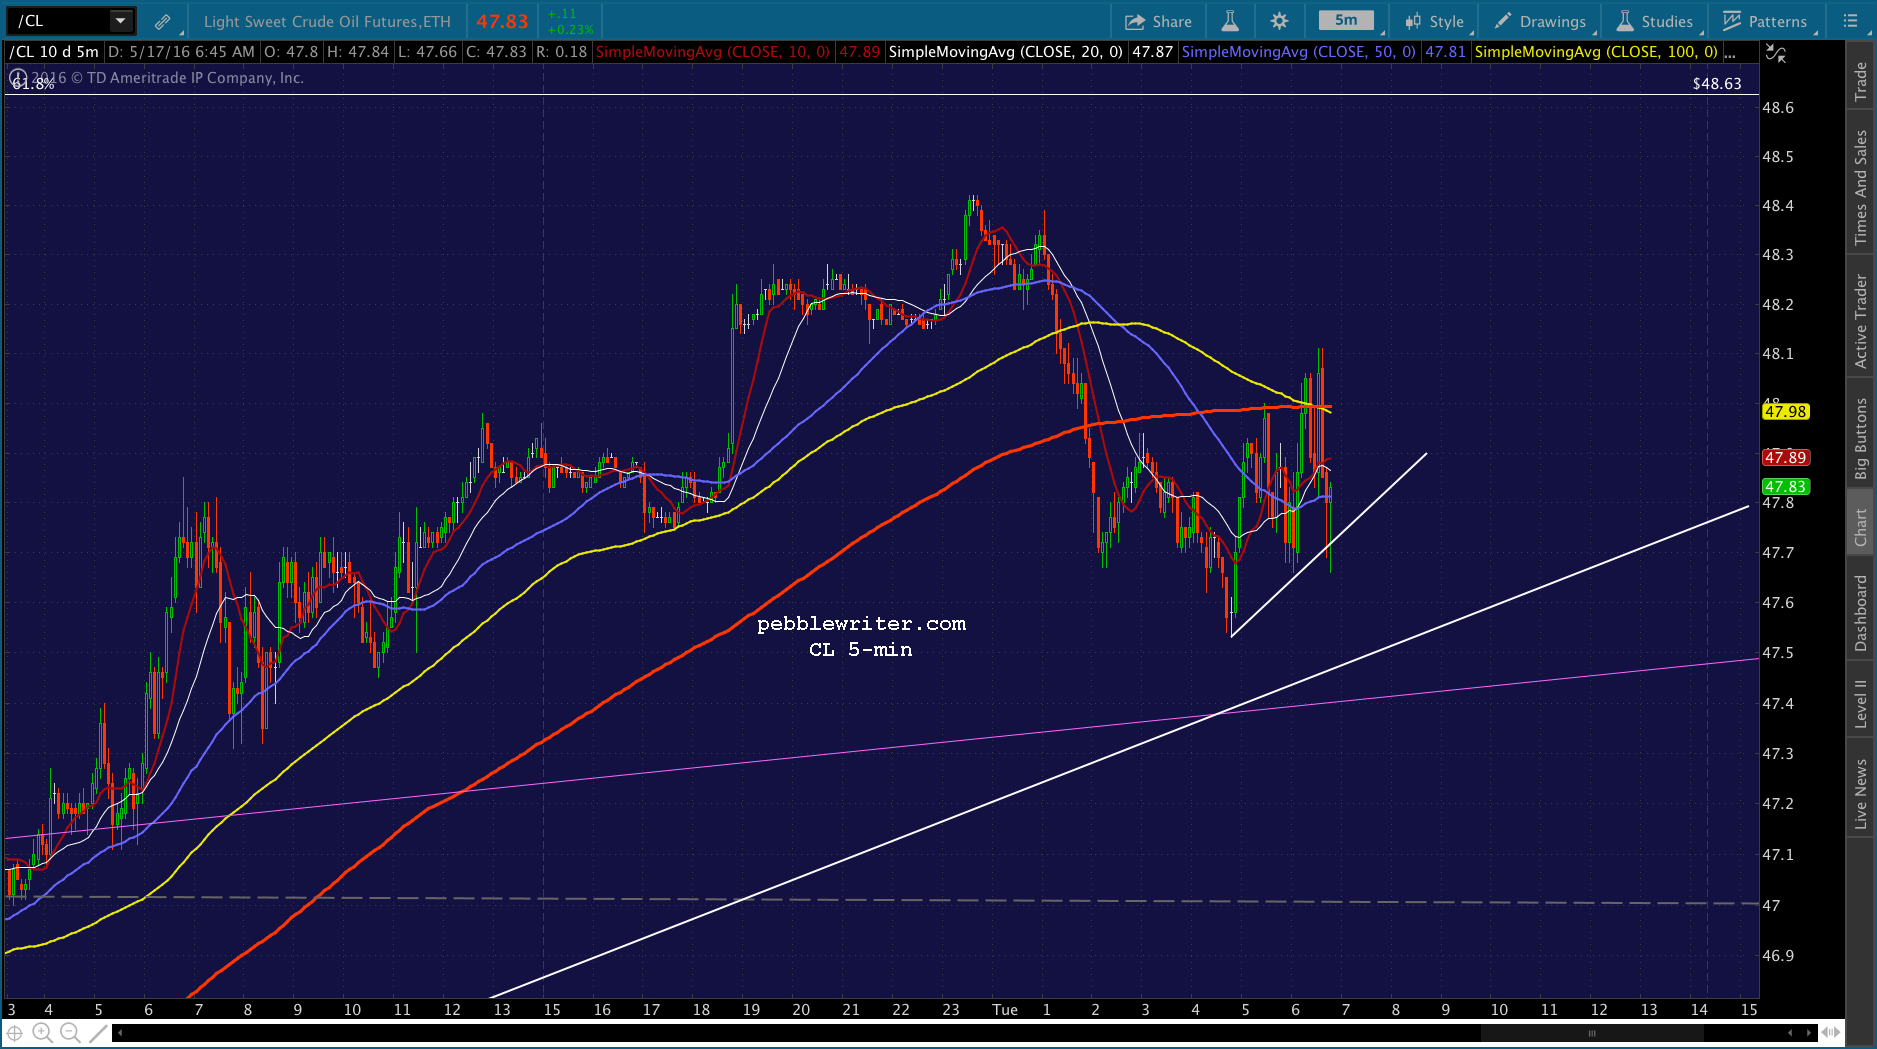
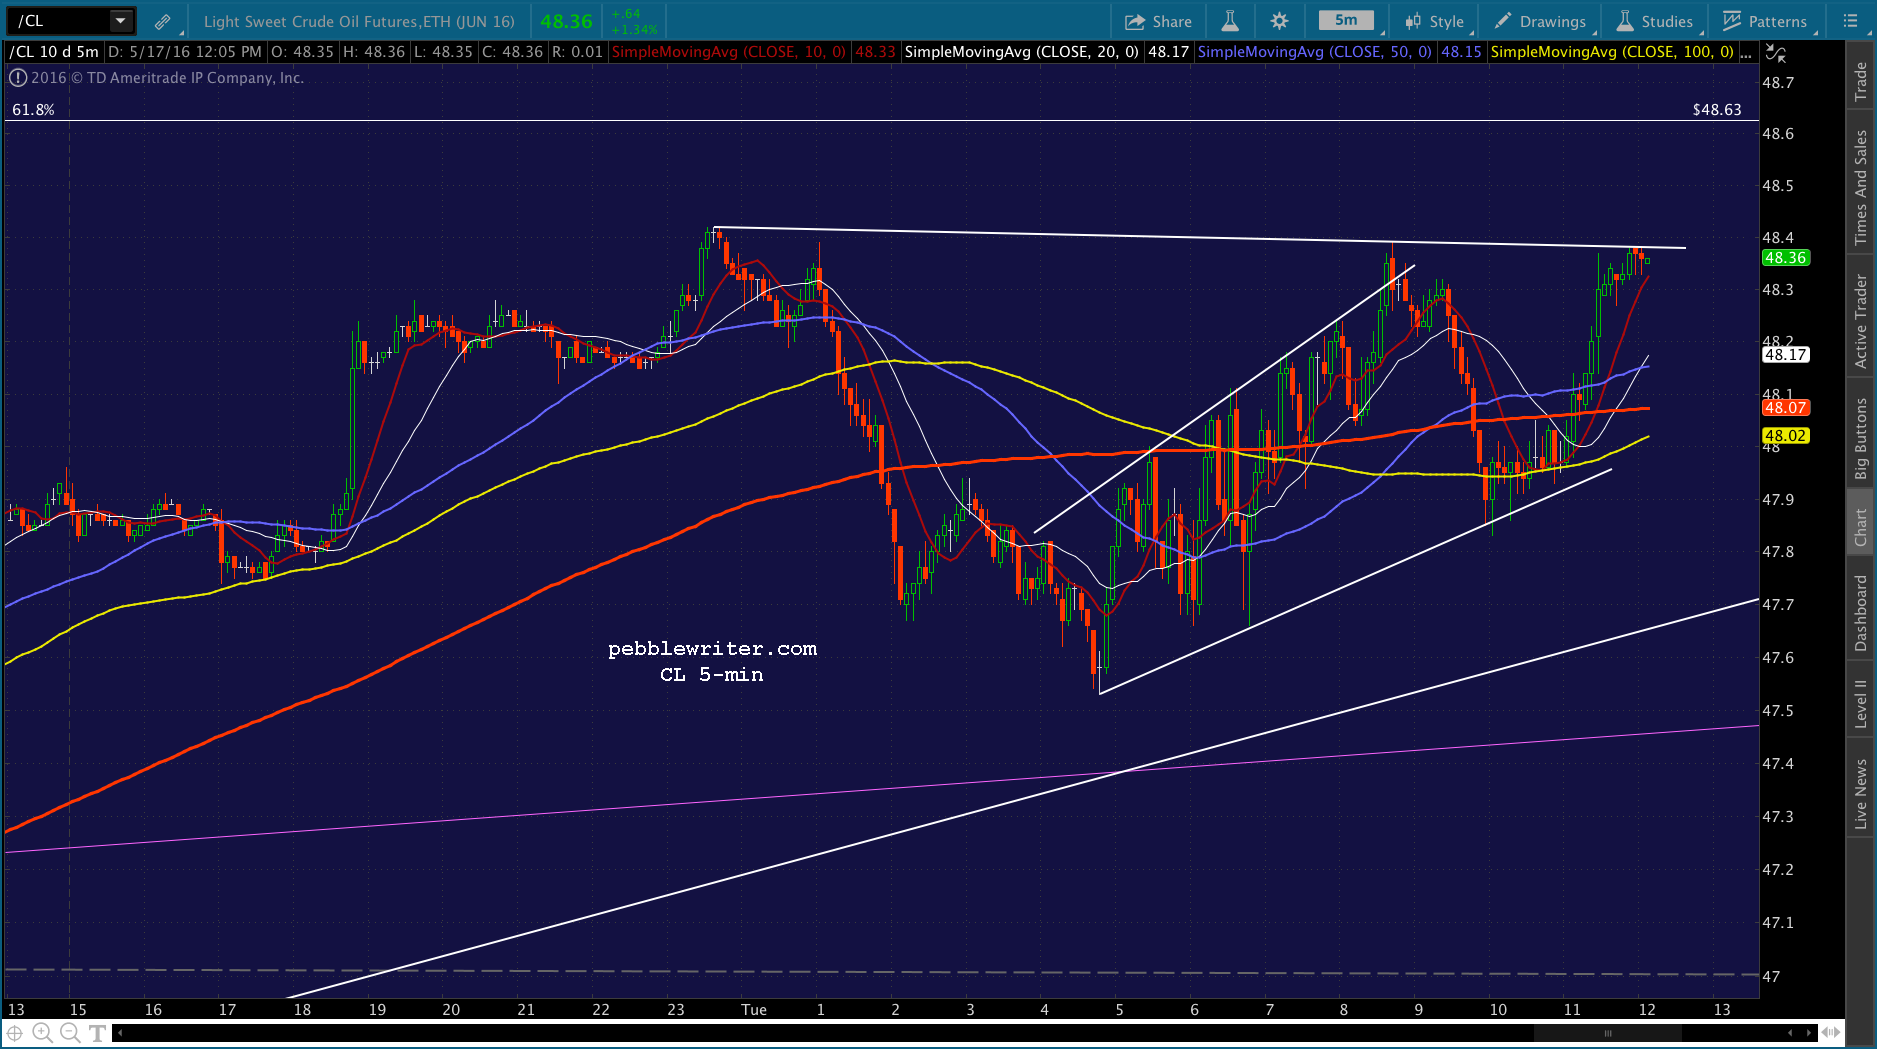
USDJPY has been all over the map lately, but still owes us a reaction to the latest .618. continued for members…While, CL remains a hair’s breath below its own .618.
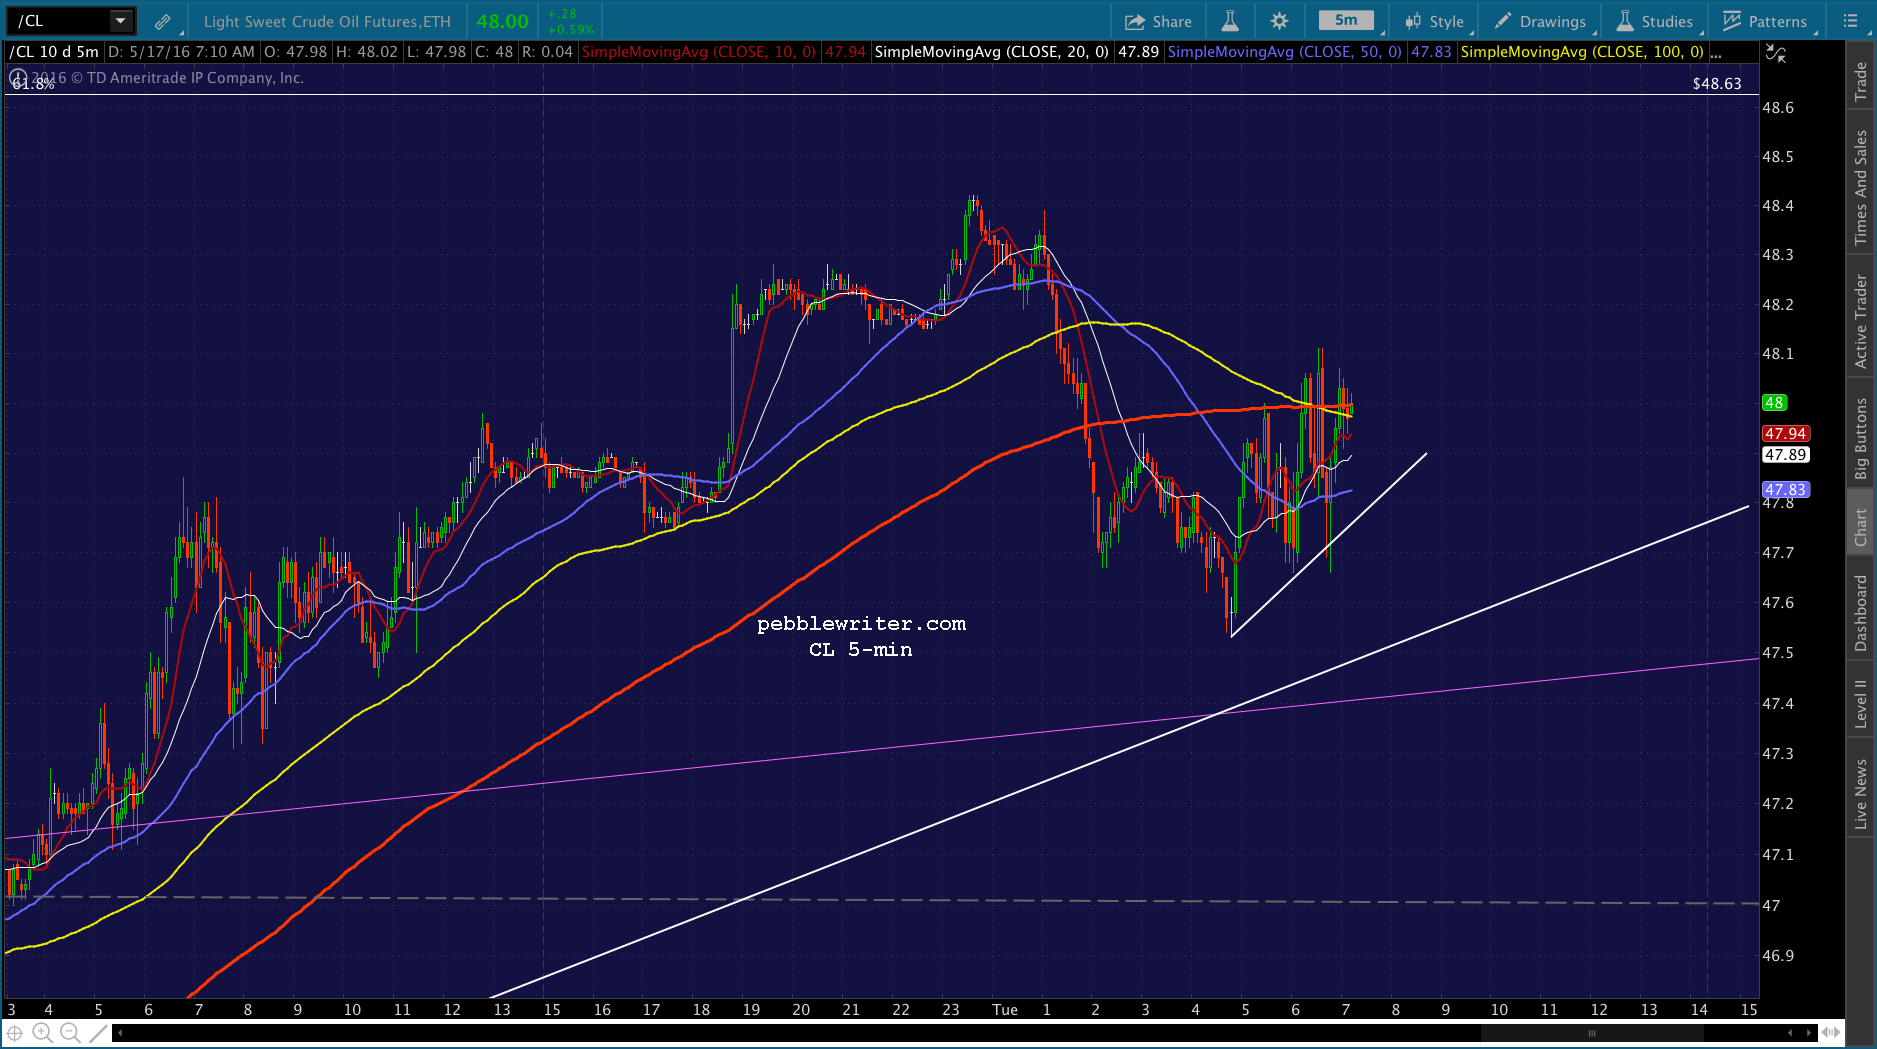
 It remains slightly below, I imagine, so that it can push up to/through it during market hours in order to have a greater effect.
 SPX appears likely to dip down below the neckline as expected, potentially putting in a nice right shoulder (2060ish) for an IH&S that targets 28 points higher, roughly 2100. Whether it gets there or not will depend on what CL and USDJPY do after reaching their .618s.

 UPDATE: 9:42 AM
That should do it for the right shoulder. I’d take profits on yesterday’s short and try a tentative long position here. Note that ES just backtested its SMA10, but not a TL connecting recent lows. So, keep your stops tight. UPDATE: 9:45 AM
Right back to short as CL is dipping further.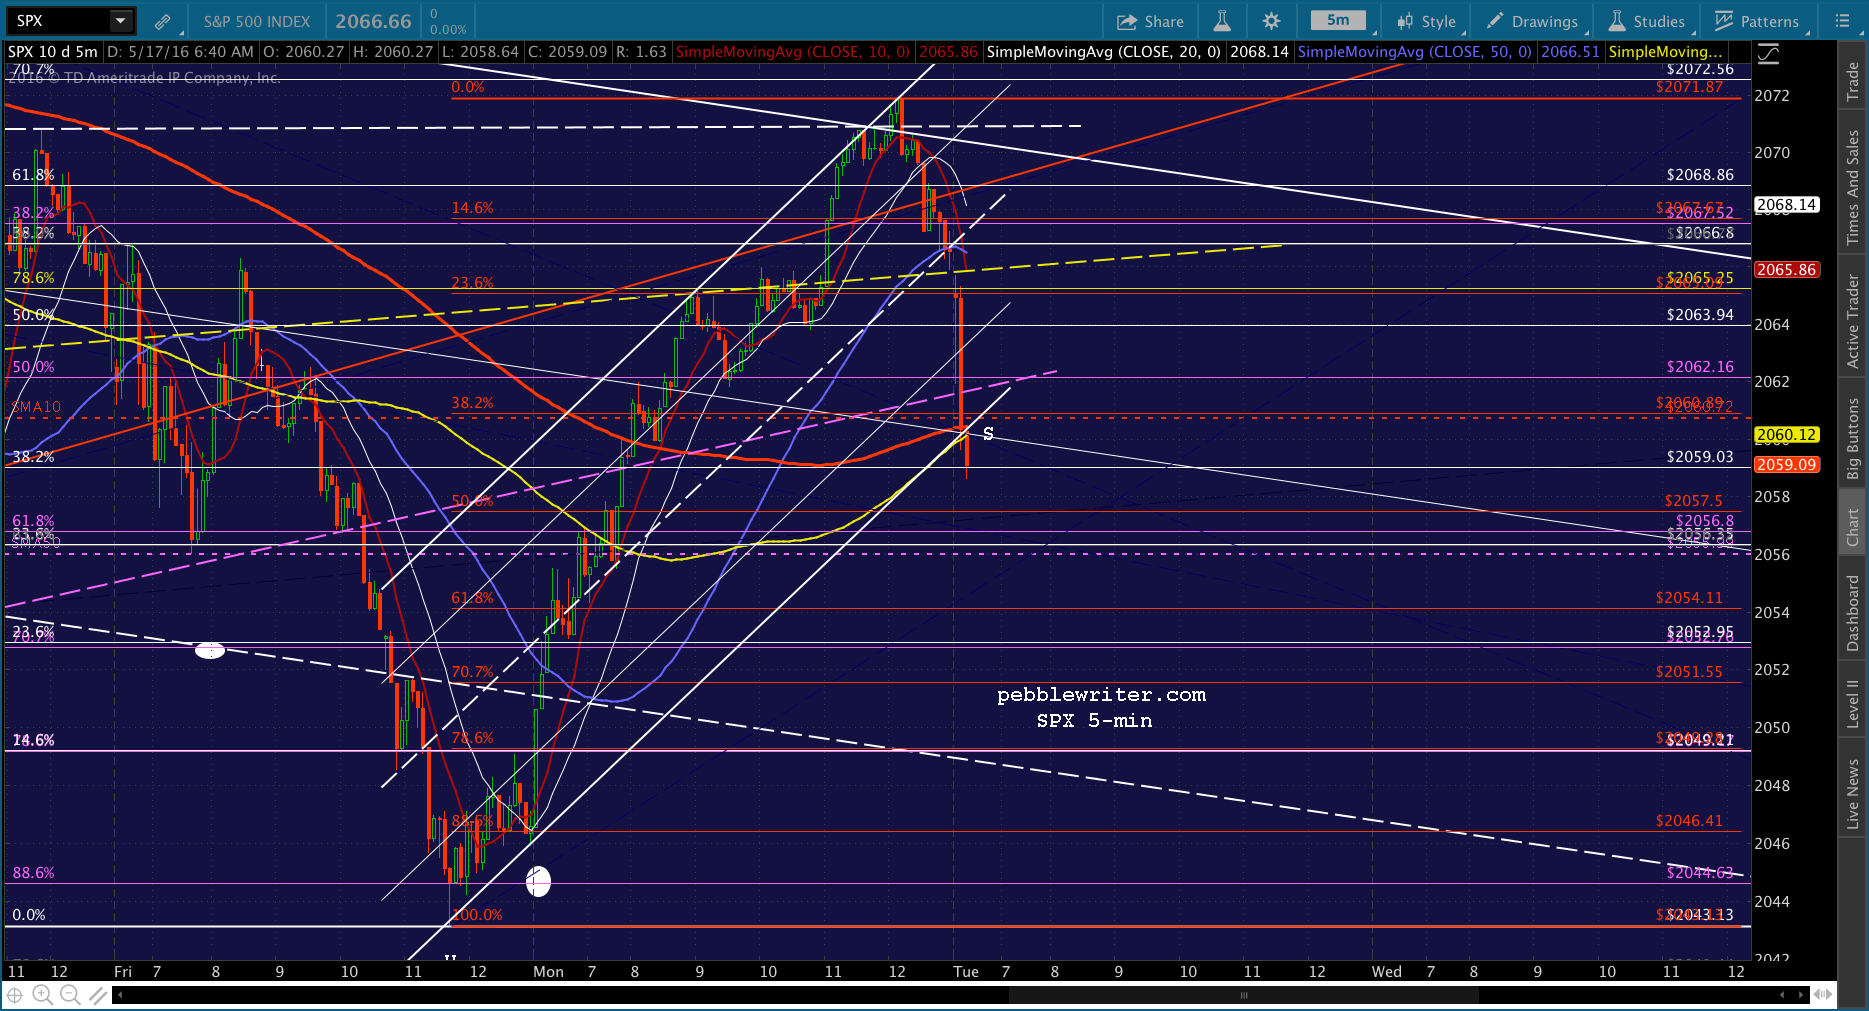
 UPDATE: 9:47 AM
Sorry, that was a head fake to get ES down to its TL. Back to long with an initial target of 2060, followed by the purple TL at 2062 and the neckline up at 2066.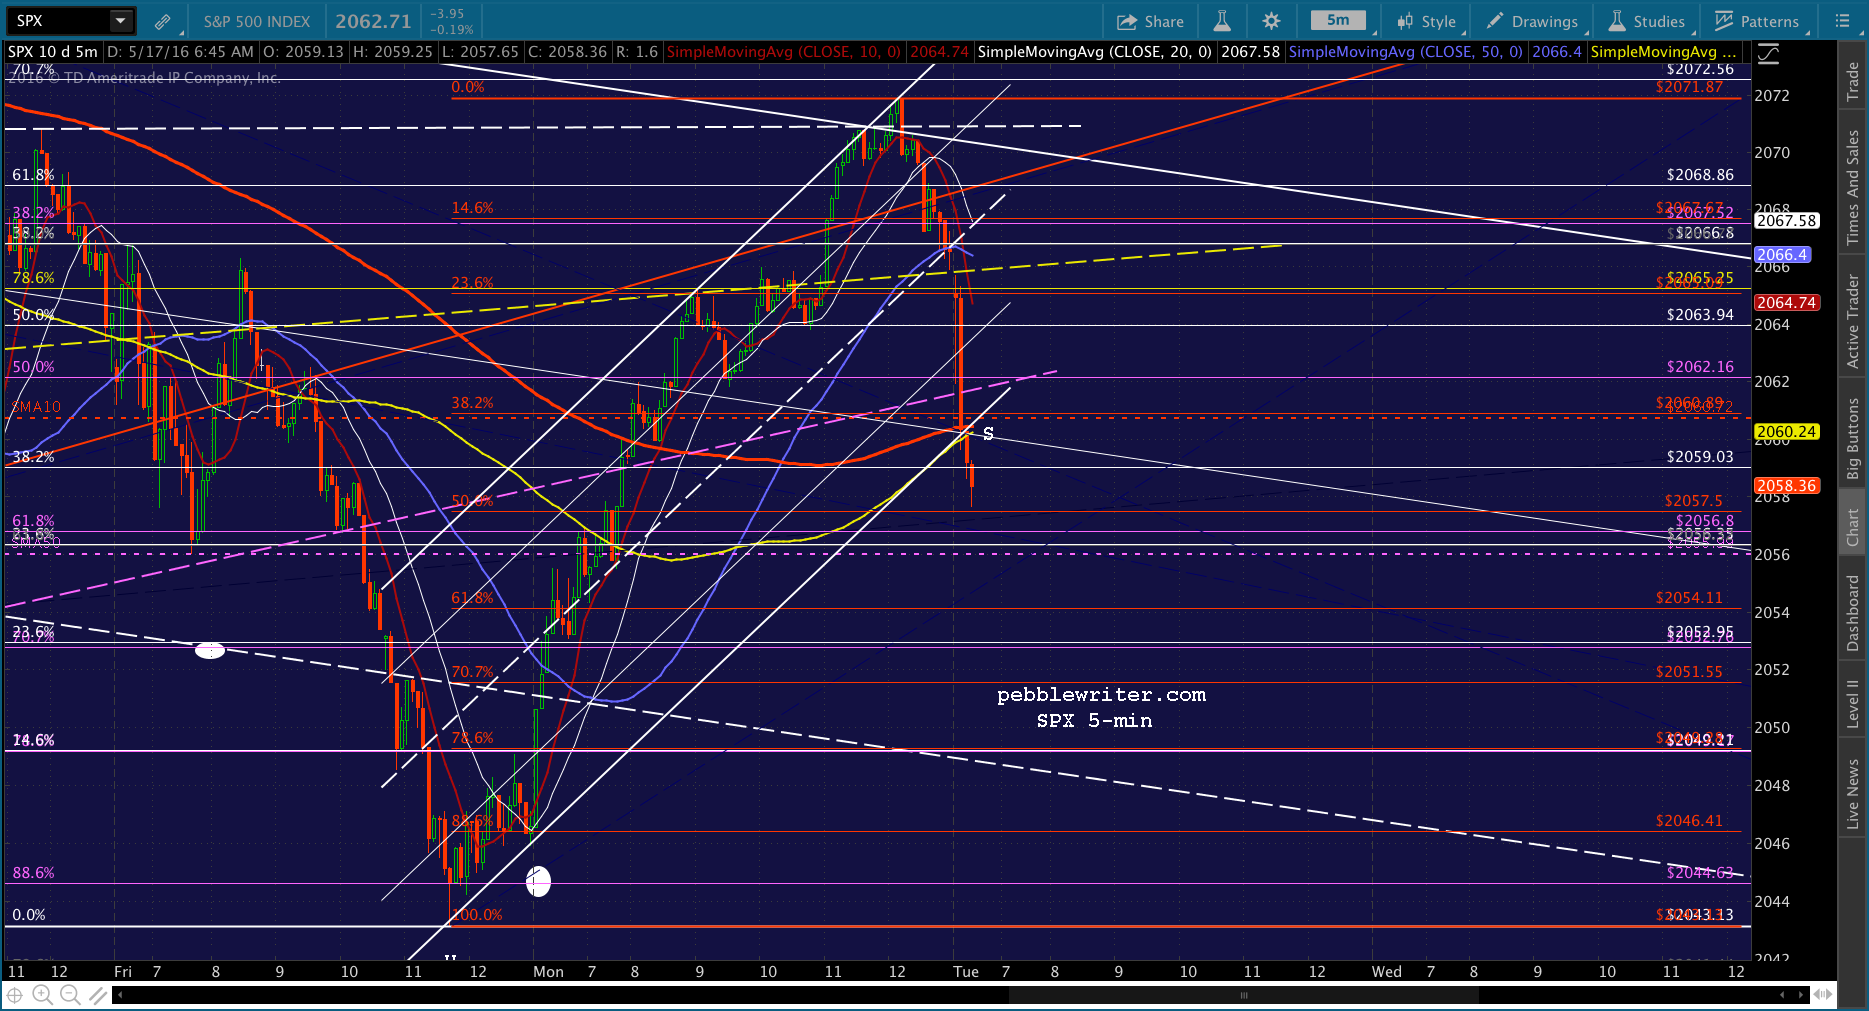
 Though, a bounce will be tough unless USDJPY stops tumbling.
 UPDATE: 10:00 AM
Not excited about USDJPY’s action here. Looks like we might be heading lower. If it dips below the white .236 channel line, I’d be back to short for the red .618 at SPX 2054.11. ES is also looking gimpy here.

 UPDATE: 10:07 AM
Seems pretty clear the downside isn’t done. Moving to cash until it’s clearer whether this is fine-tuning or something more. It could be the SMA5 50 at 2056, or the .618 at 2054.11. Either way, CL isn’t participating, and USDJPY is being very coy about dropping through that channel line to the channel bottom at 108.54.

 UPDATE: 10:14 AM
SPX just tagged the SMA50. Should get a bounce up to the SMA5 200 at 2061 or the purple TL as the SMA5 20 crosses at 2062ish.. Worth a stab at a long here with tight stops. ES continues to act very lethargic and is barely bouncing back above the TL. Note that it has not reached its own SMA50.  UPDATE: 10:21 AM
There’s the SMA5 200. I’d take profits here and revert to cash — only because ES could still be eyeing its SMA50 and CL seems to be heading back down. But, we’ve seen these meltups to the SMA5 20 happen over and over again. My best guess is ES tags 2051.11 as SPX tags 2054.11, but can’t be sure.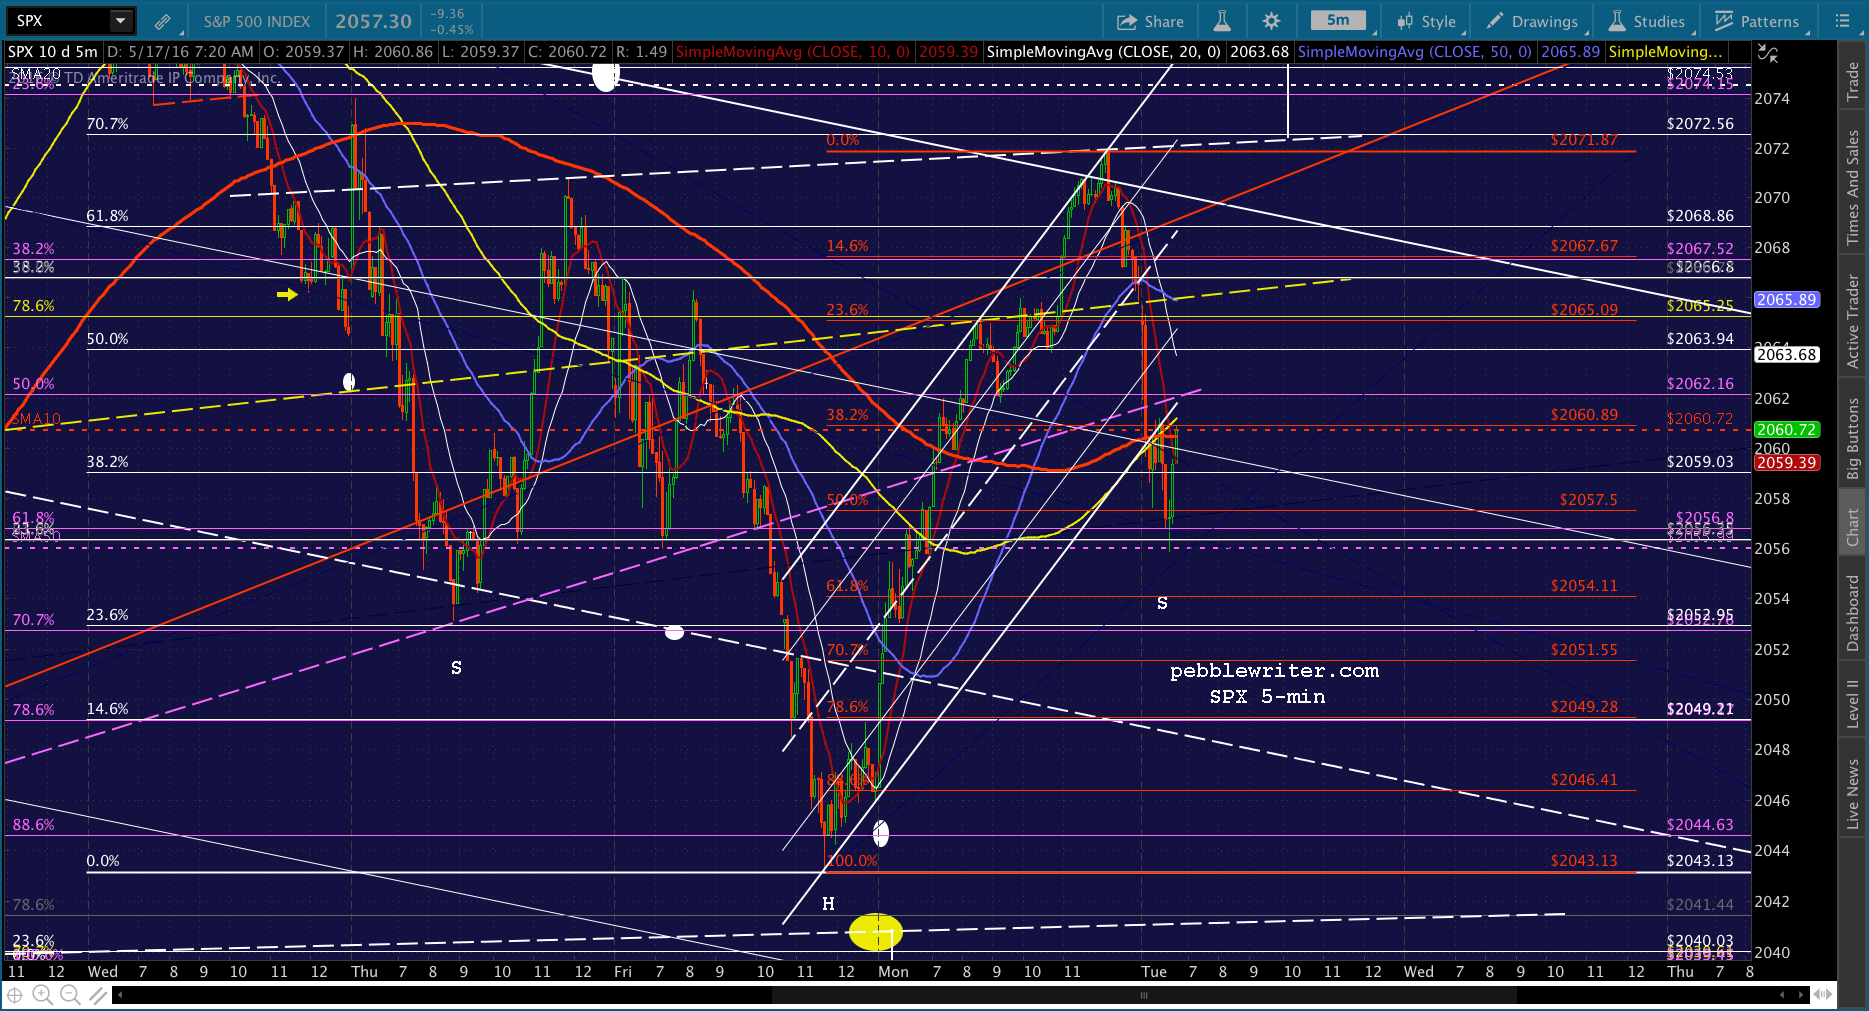 Note that NKD has backtested its TL.
  CL’s in a little megaphone pattern.
  And, USDJPY is holding above the .236 line still. Note that the SMA20 stands in the way of the channel bottom. I only see the channel bottom coming into play if stocks really start swooning — say, below the .618 or even the falling white channel midline.
  If SPX reverses strongly at 2054, I’d want to see USDJPY bouncing hard off the white channel line. FWIW, 2054 makes for a much more symmetrical right shoulder for the IH&S.
UPDATE: 10:46 AM
Just tagged the SMA5 20 as ES tagged its SMA5 50. If it’s going to reverse down to the .618, this should be the place. Back to short here, with tight stops. If it doesn’t reverse, probably looking at yellow neckline again.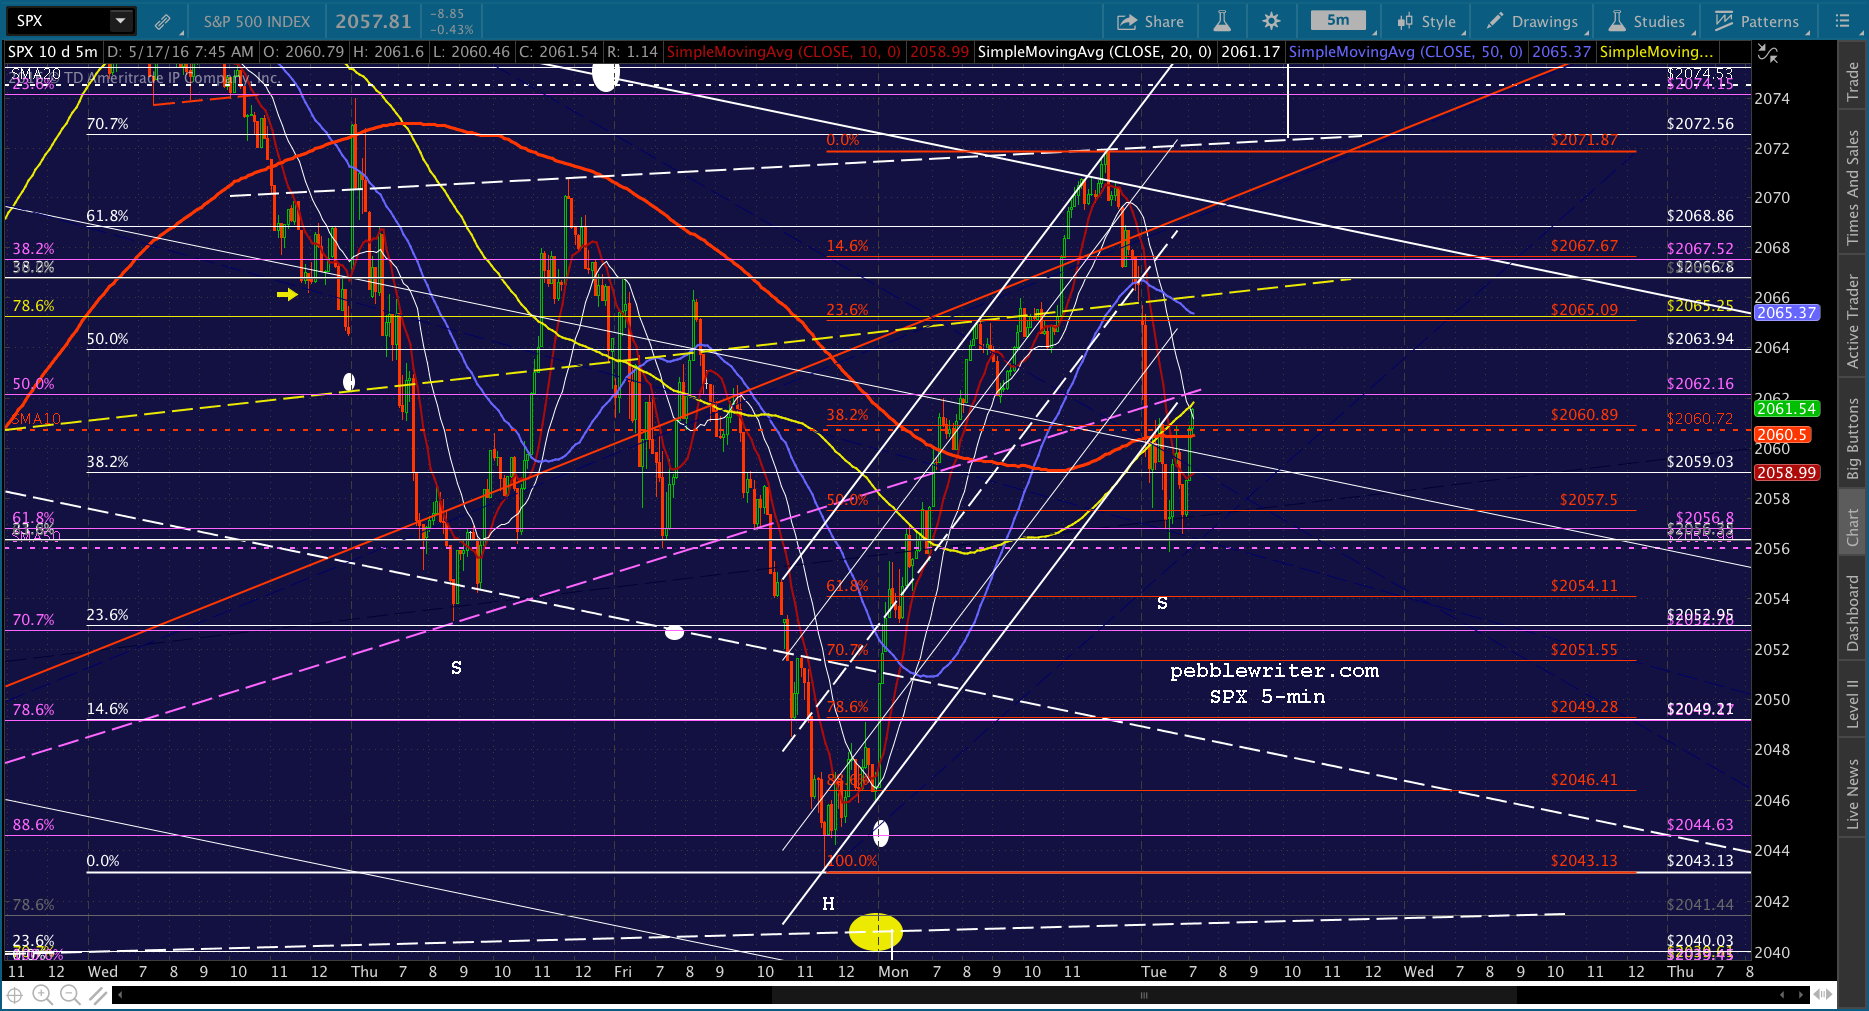
 UPDATE: 11:17 AM
Giving up on the short here, as the SMA5 200 got leapfrogged and is being backtested. I still think we get there, but now it’s not so sure, and it could take a while. UPDATE: 11:27 AM
Taking another stab at it with the euro close coming up. Back to short.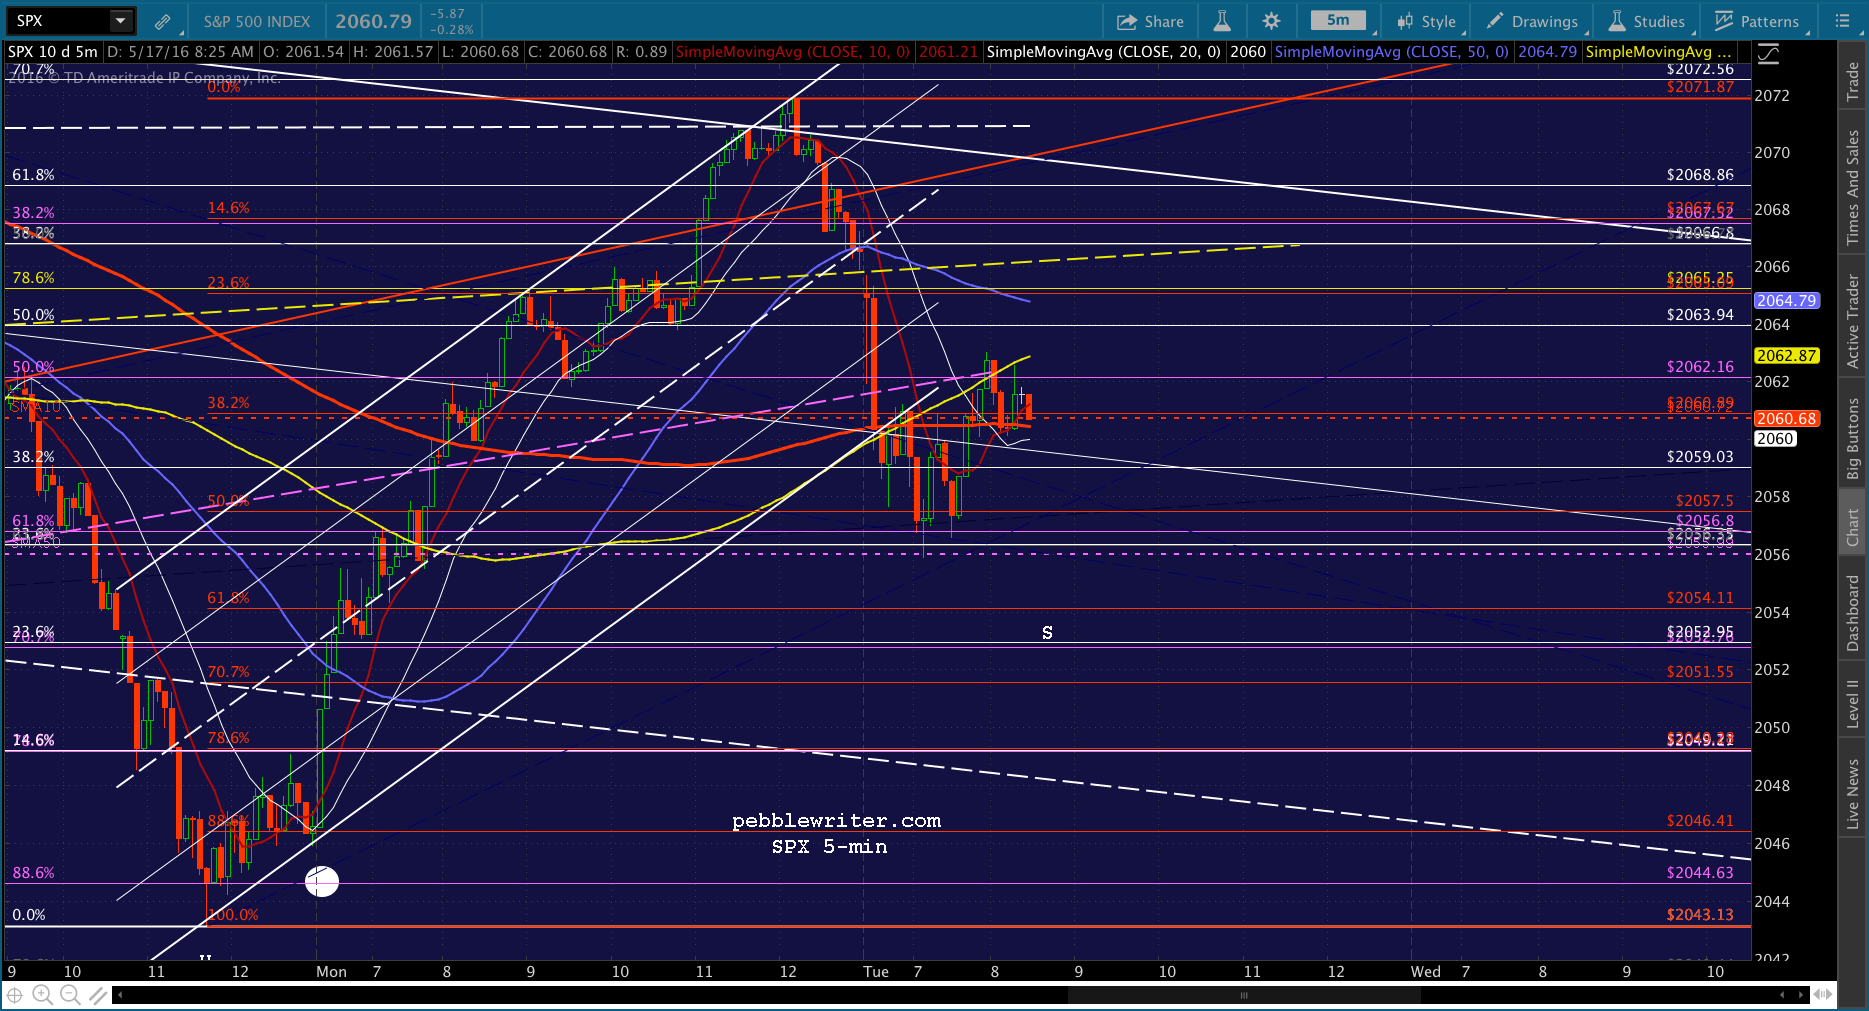
 UPDATE: 11:55 AM
Slipping a little higher, but I think it’s mostly delaying the next leg down. Looking at the USDJPY, it seems to be about 2 ET. I’d cut the short loose here, or be prepared to ride it out for another couple of points higher. I have to step away for a few…
 UPDATE: 1:20 PM
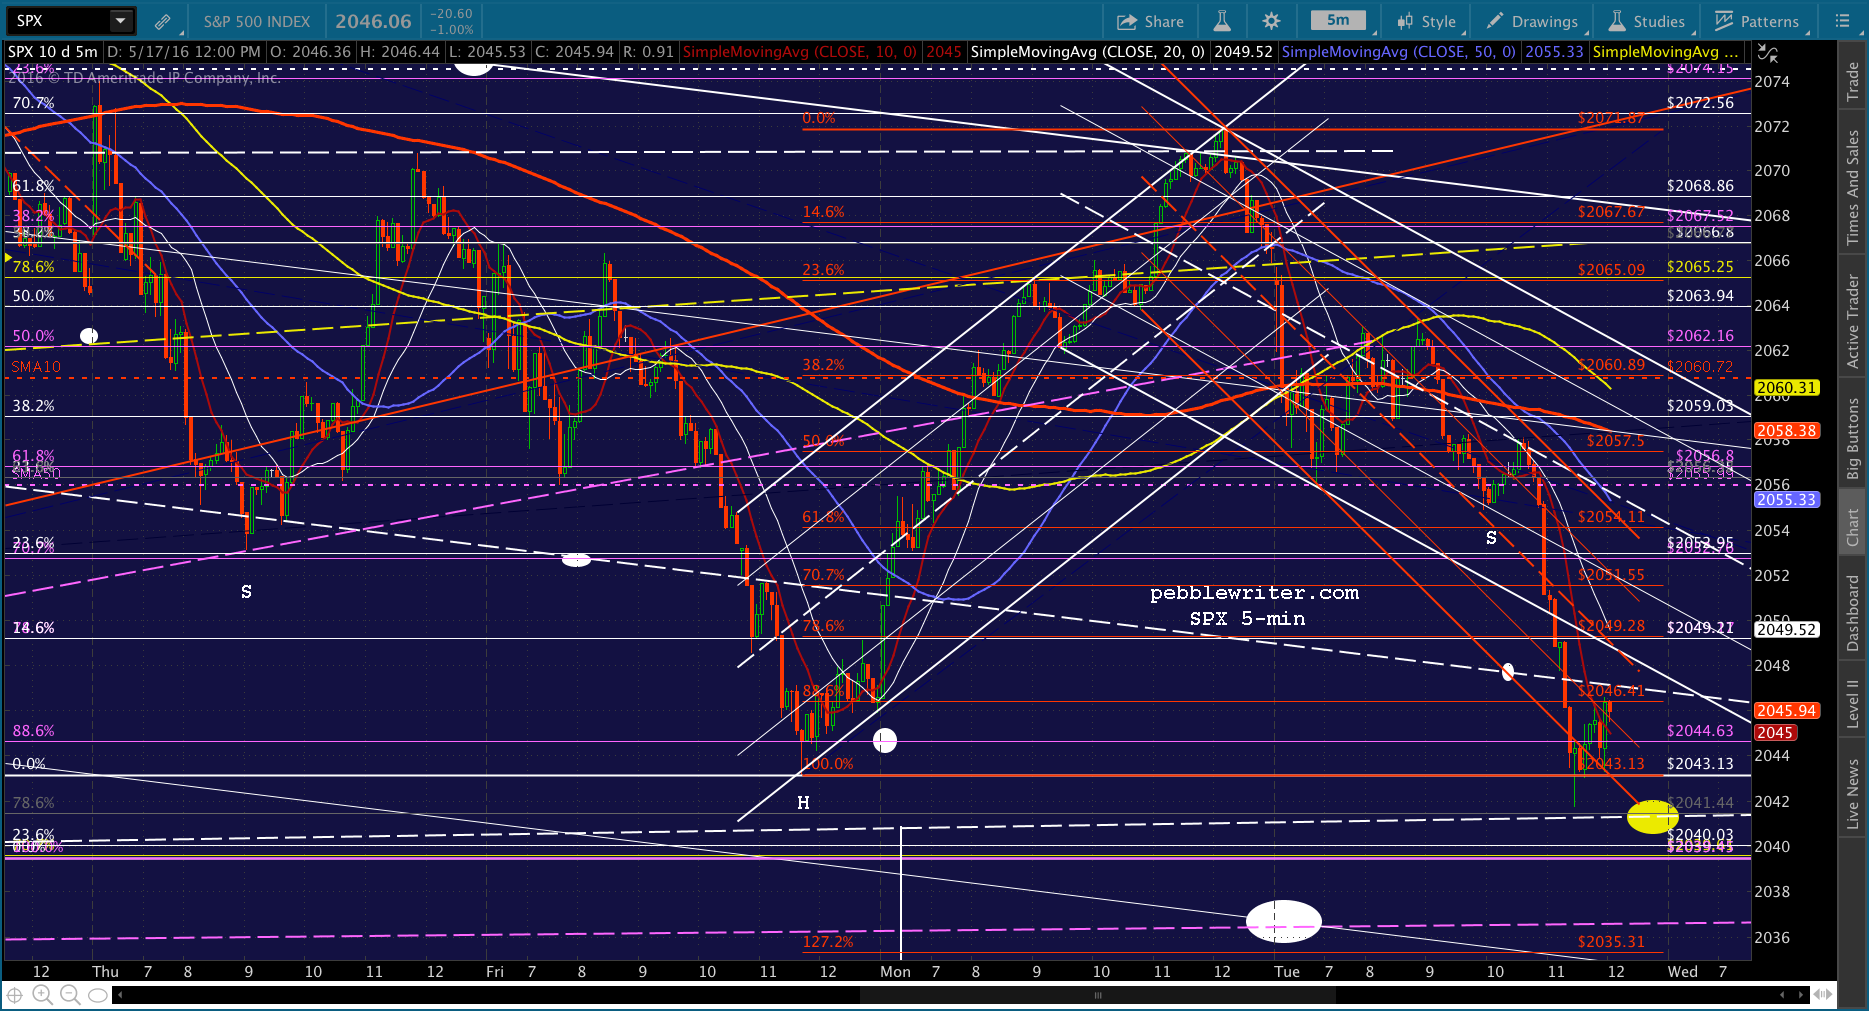
SPX getting close to the .618. Note that if it doesn’t hold, then the .786 or white midline look good. And, if it dips any lower, we could get to the white neckline that almost got tagged Friday 2041.40ish.) Of course, if that happens, then the IH&S would be killed.
And, that’s actually looking more likely now. They could have tagged the .618 hours ago when it lined up with a channel bottom. Now, it would be out in the middle of nowhere, chartwise, with much flimsier support. In other words, this delay increases the odds of a deeper drop here. 


UPDATE: 2:03 PM
If the white channel is THE channel, then the decline is done. If the red, then there’s still 9 points to go. 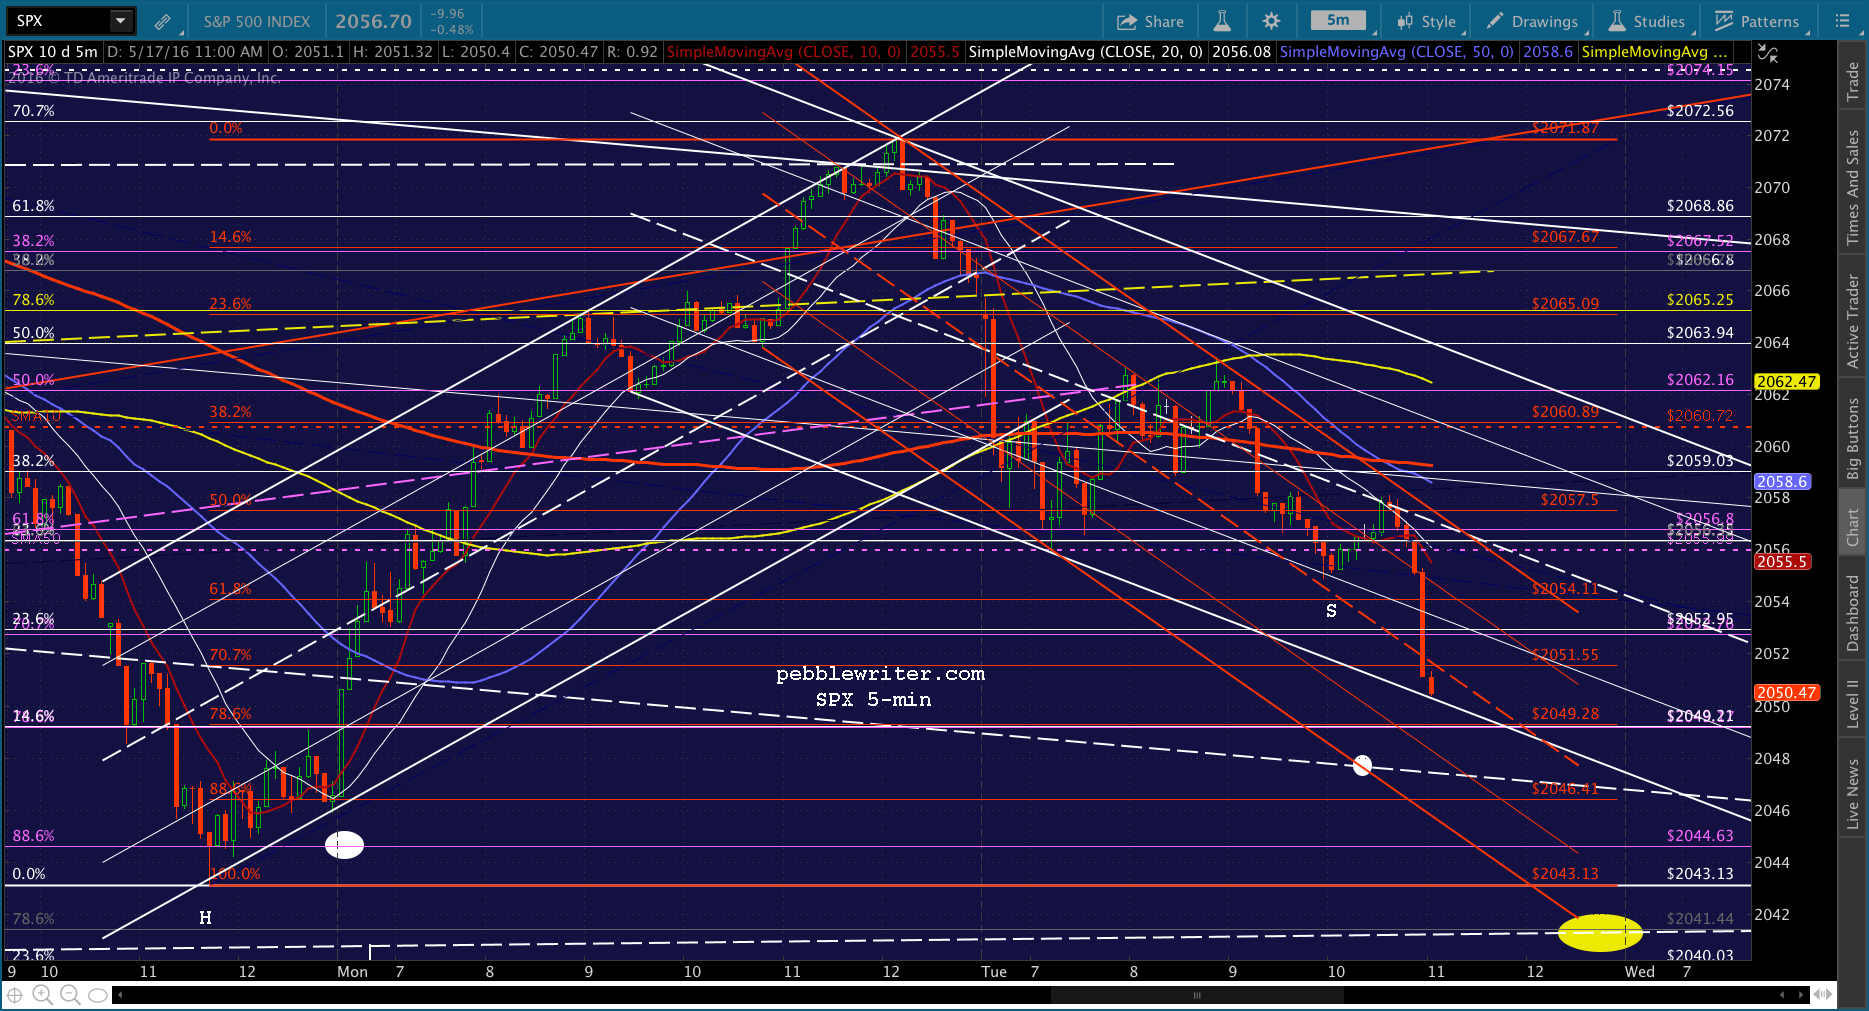 ES suggests this could be it, as it’s also ES’ falling white channel midline. Should know very shortly.
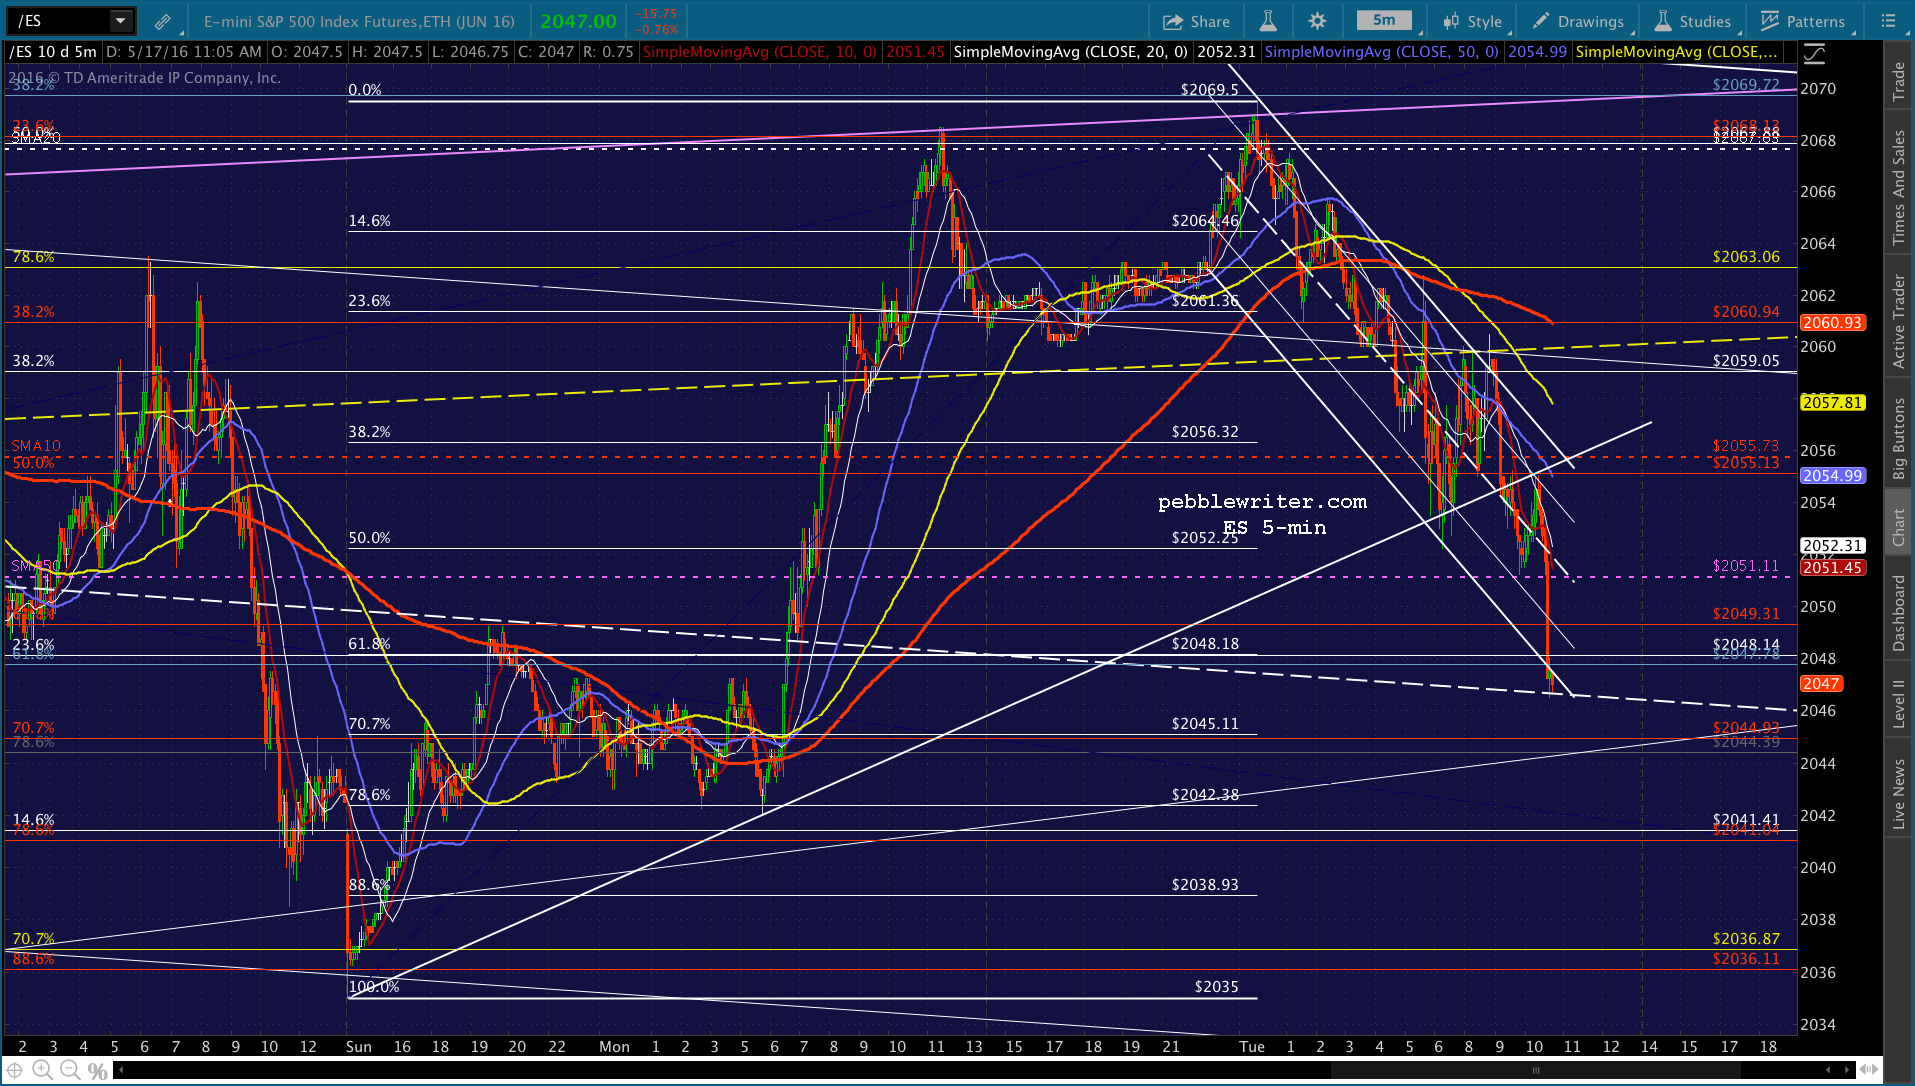 UPDATE: 2:27 PM
SPX just got within a few cents of our yellow target, probably close enough. Back to cash here, and taking my wife out to dinner tonight…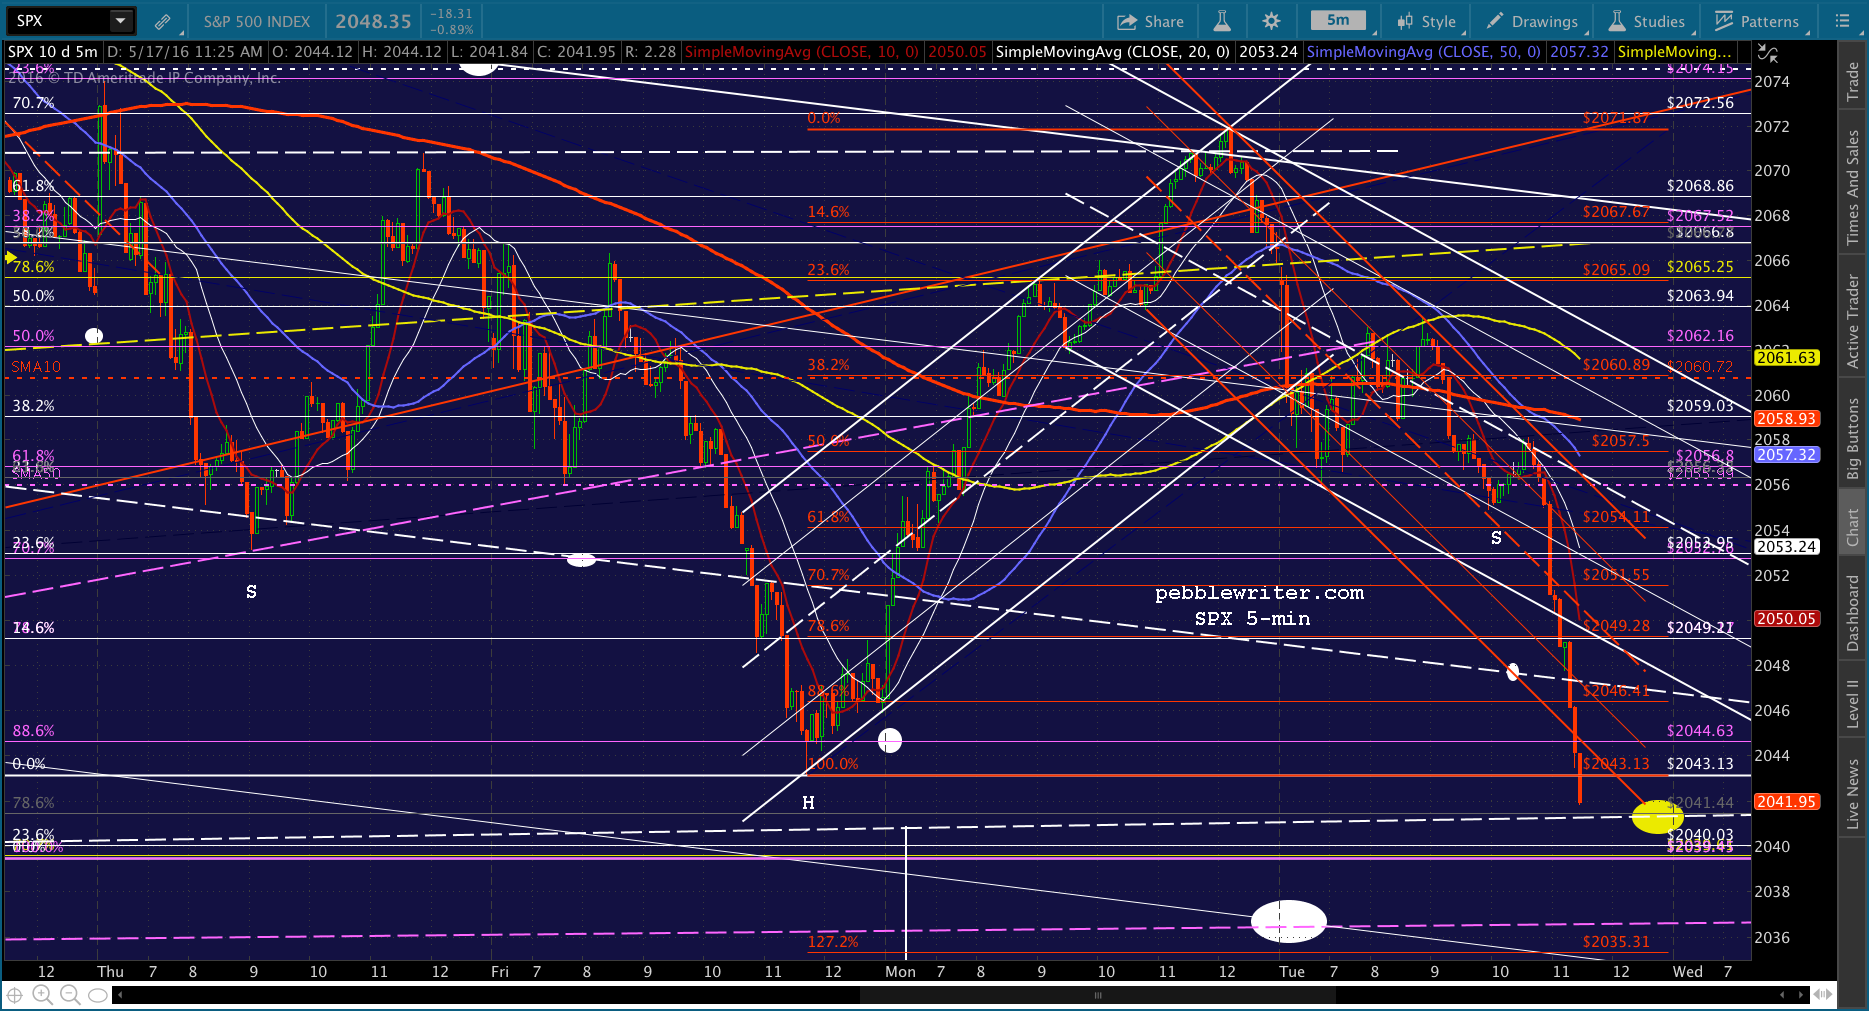 Thought about going long here, but we didn’t quite make it down to 2041.44, and there’s a lot of time left. We could see quite a bit of shaking and baking in the next 90 minutes.
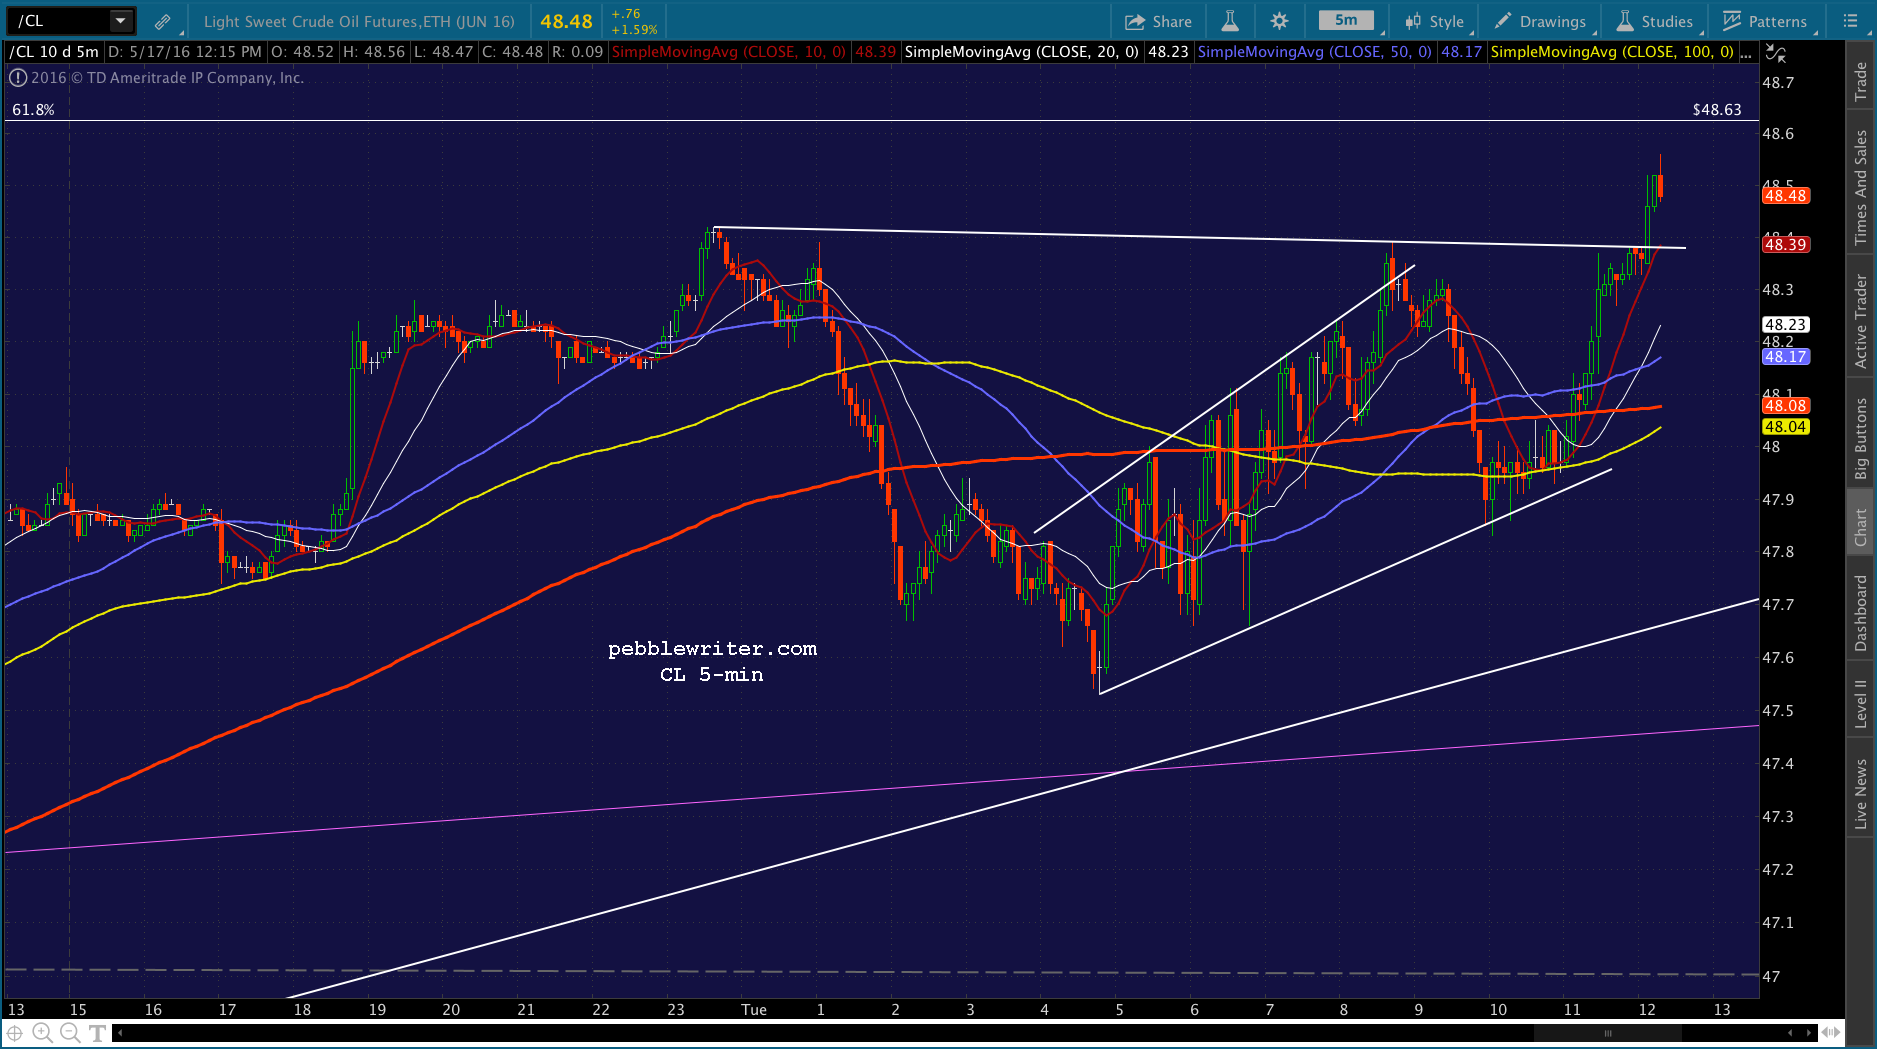
And, here’s the crazy part… CL is just now threatening to break out, and USDJPY is just now threatening to break down. If CL pops through that white TL, you can bet SPX will recover some of these losses. While, USDJPY seems to have had very little impact today.
 Note that ES tagged its .886, which would also signal a bounce.
 UPDATE: 3:02 PM
Suppose it doesn’t bounce. Suppose ES wants to tag its neckline, too. It could mean ES 2032, which is about SPX 2035 — the red 1.272 and the purple channel neckline. I think this is a real possibility, only because USDJPY, which has been rising all day, is finally selling off.
And, CL has yet to punch through that white TL. Not saying I’d place a big bet at this point, but if USDJPY drops through that SMA5 50 at 209.04 and CL backs off the white TL, I’d sure entertain it.

 UPDATE: 3:15 PM
I’d give it a try, just for grins. Tight stops obviously, as CL has broken out and USDJPY hasn’t broken down.

 UPDATE: 3:32 PM
Just tagged the yellow target, and could very well bounce into the close. For anyone rolling the dice and looking for 2035-2036, please watch your stops. Everyone else, this is your exit. Keep an eye on USDJPY, which is thinking about plunging down to 108.06, but hasn’t budged yet. For those of you shorting USDJPY, please watch your stops. If SPX bounces into the close as it often does, it’s a safe bet that USDJPY will, too.
 And, remember, this neckline is kind of a big deal. Only hold a long or short position overnight if you can truly handle the risk of it blowing up in the next 18 hours. We have crude inventories and FOMC minutes tomorrow, and we could see some big moves.
Comments
2 responses to “Charts I’m Watching: May 17, 2016”
PebbleWriter, from your CL chart, I sense the conflict of weaker yen and high oil price.
Yen is waiting for CL to come back down first, before weakening. (when your currency gets depreciated while import oil priced 80% higher in a 3 months)
SPX waiting for yen to weaken. When it does not, CL is sent higher.
To response to higher oil, yen refuses to weaken.
And CL goes higher again. It is a circle.