

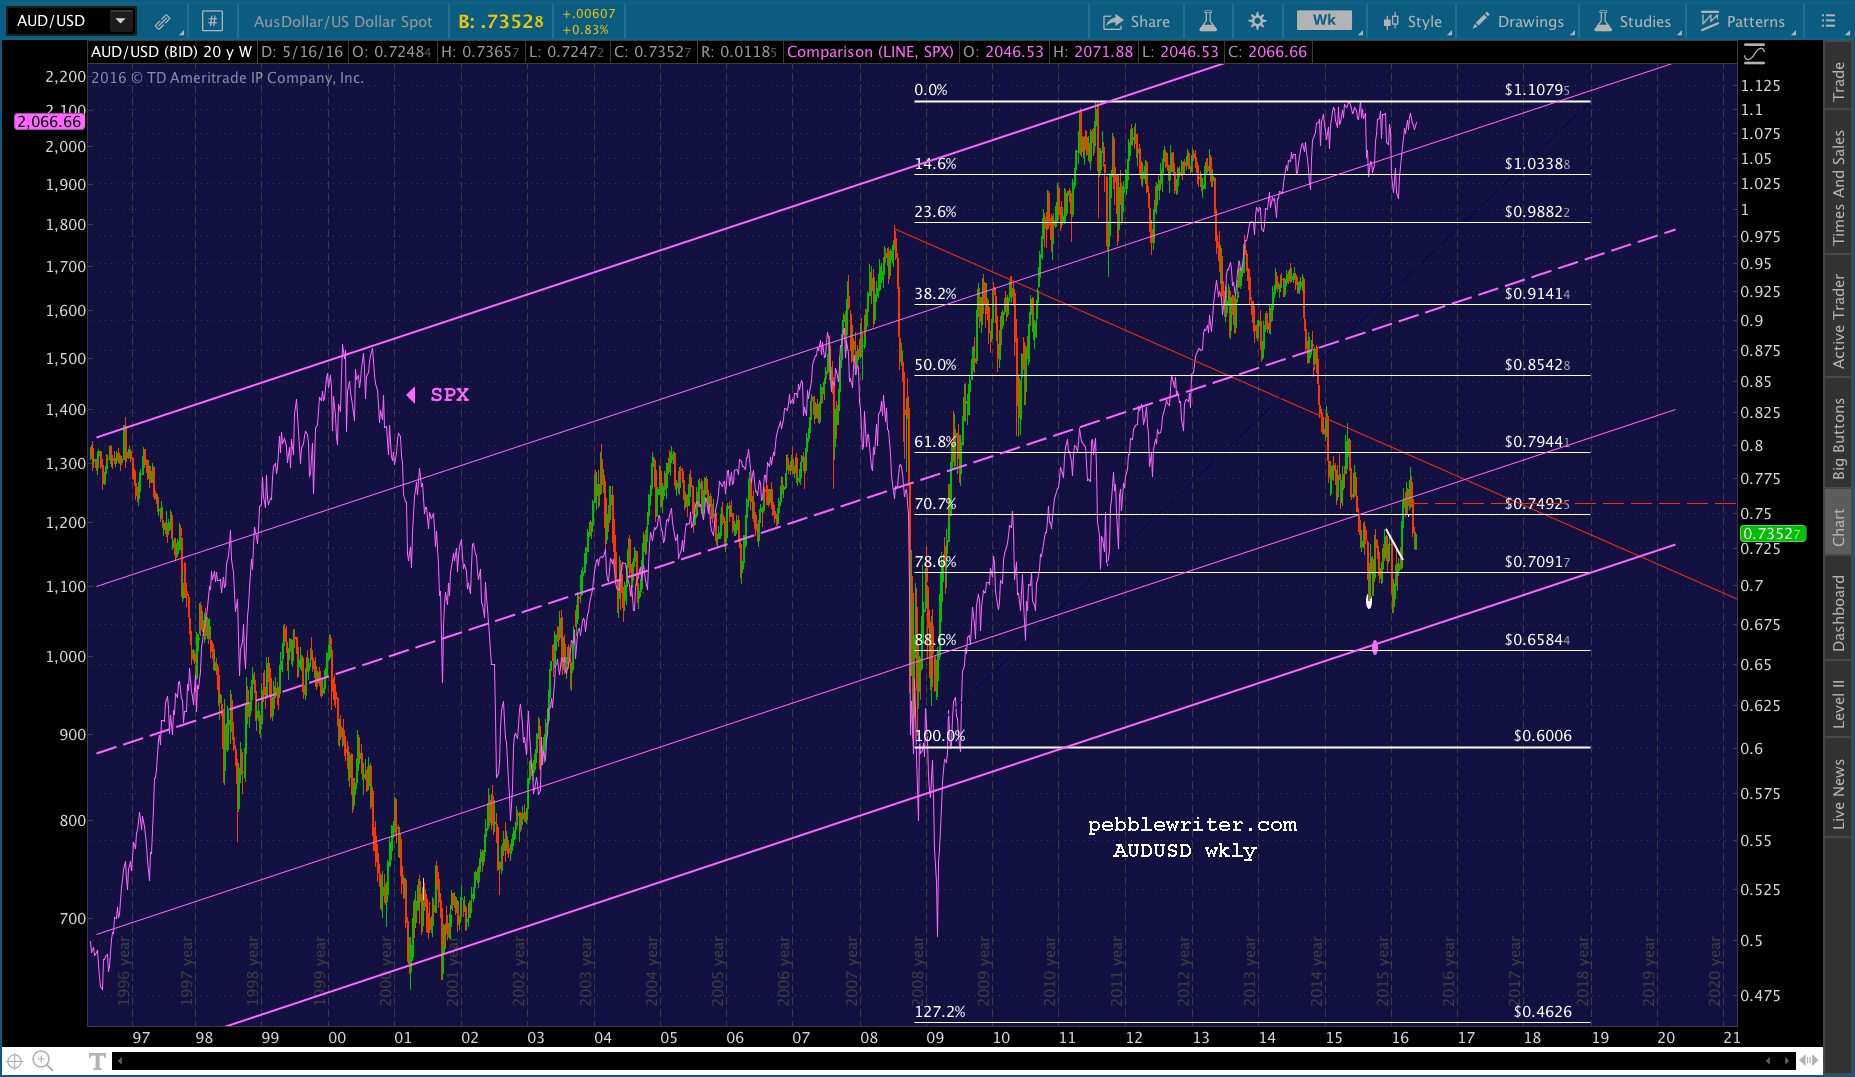
AUDUSD has been quite coy lately, bouncing strongly in between two major Fib levels, then breaking down before it could reach a good bounce point. It’s mostly reacting to the schizophrenic US dollar, [see: May 6 Update on DX] which has been all over the map in an effort to prop up stocks.
AUD reached our .6897 target last September, but couldn’t seal the deal on .6584 before plunging stock prices sent it soaring. From 2011 through 2015, a rising dollar (i.e. rising USDJPY) sent stocks higher. Since the start of the year, however, CL has taken over the job of driving up stocks. And, when CL rises, the USD generally falls, which drives AUDUSD higher.
That’s why AUDUSD’s breakdown over the past two weeks is so interesting and, potentially, so important.
continued for members…
The weekly chart shows a pretty well-defined falling red channel that kept stocks rising until they topped out a year ago. But, when USDJPY broke down this past December, AUDUSD started moving in sync with stocks.
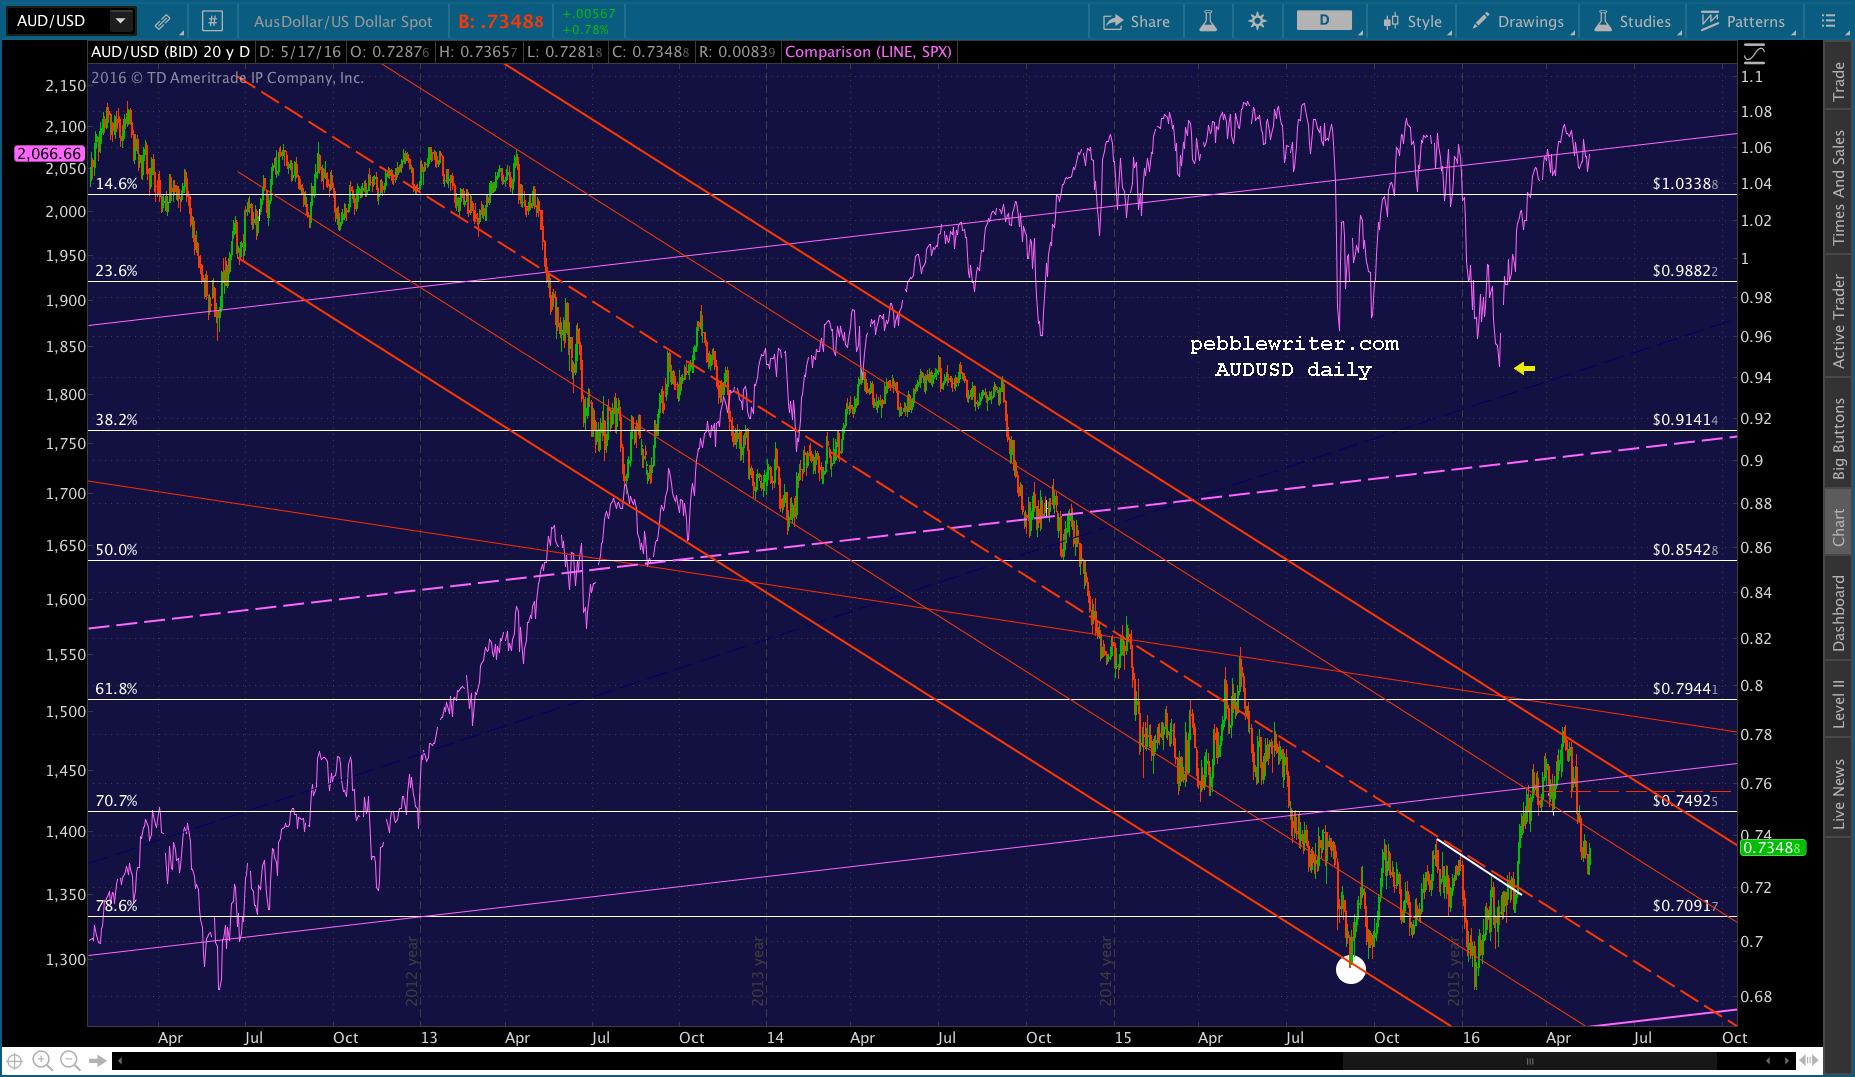
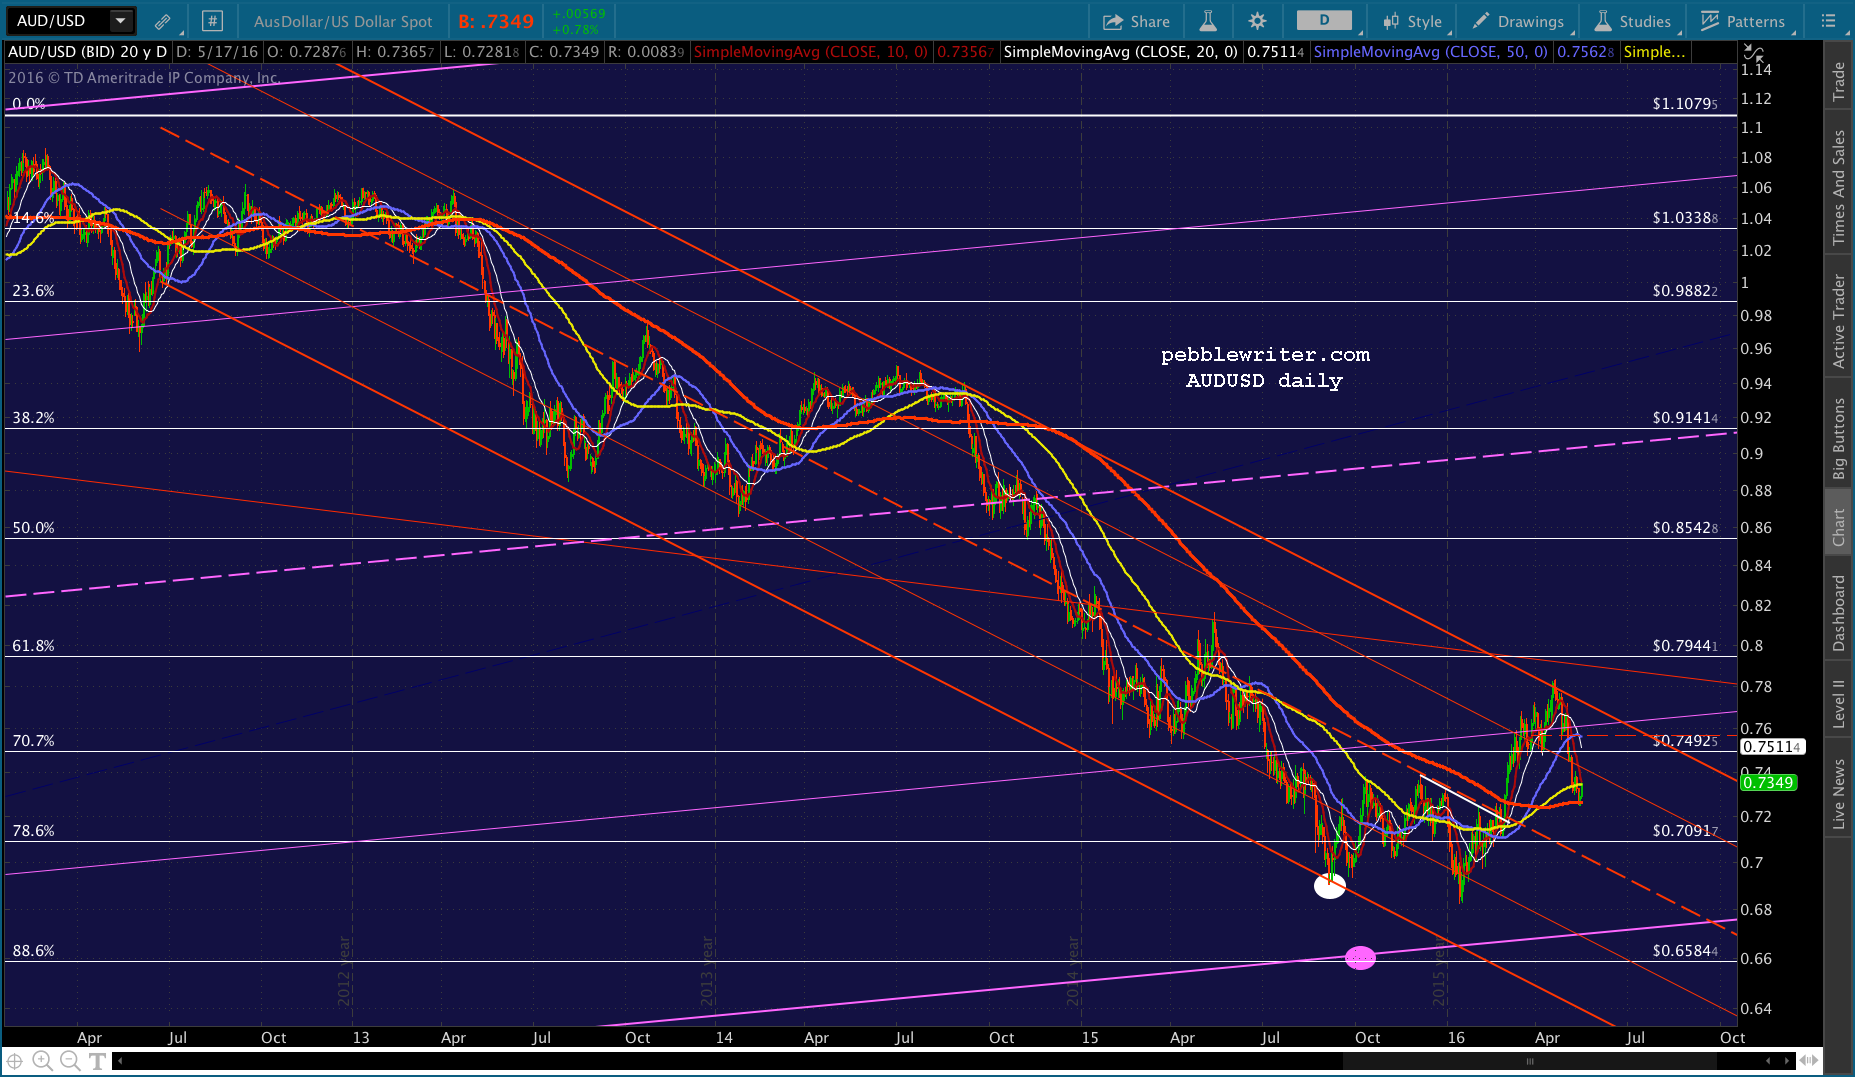 It’s reasonable to believe AUDUSD will bounce strongly off its SMA200, but the falling red channel suggests otherwise. Anyone tempted to trade the bounce would do well to wait for it to clear the SMA100 first. If it can’t, there is much more downside potential. That .886 at .6584 is still out there, waiting.
 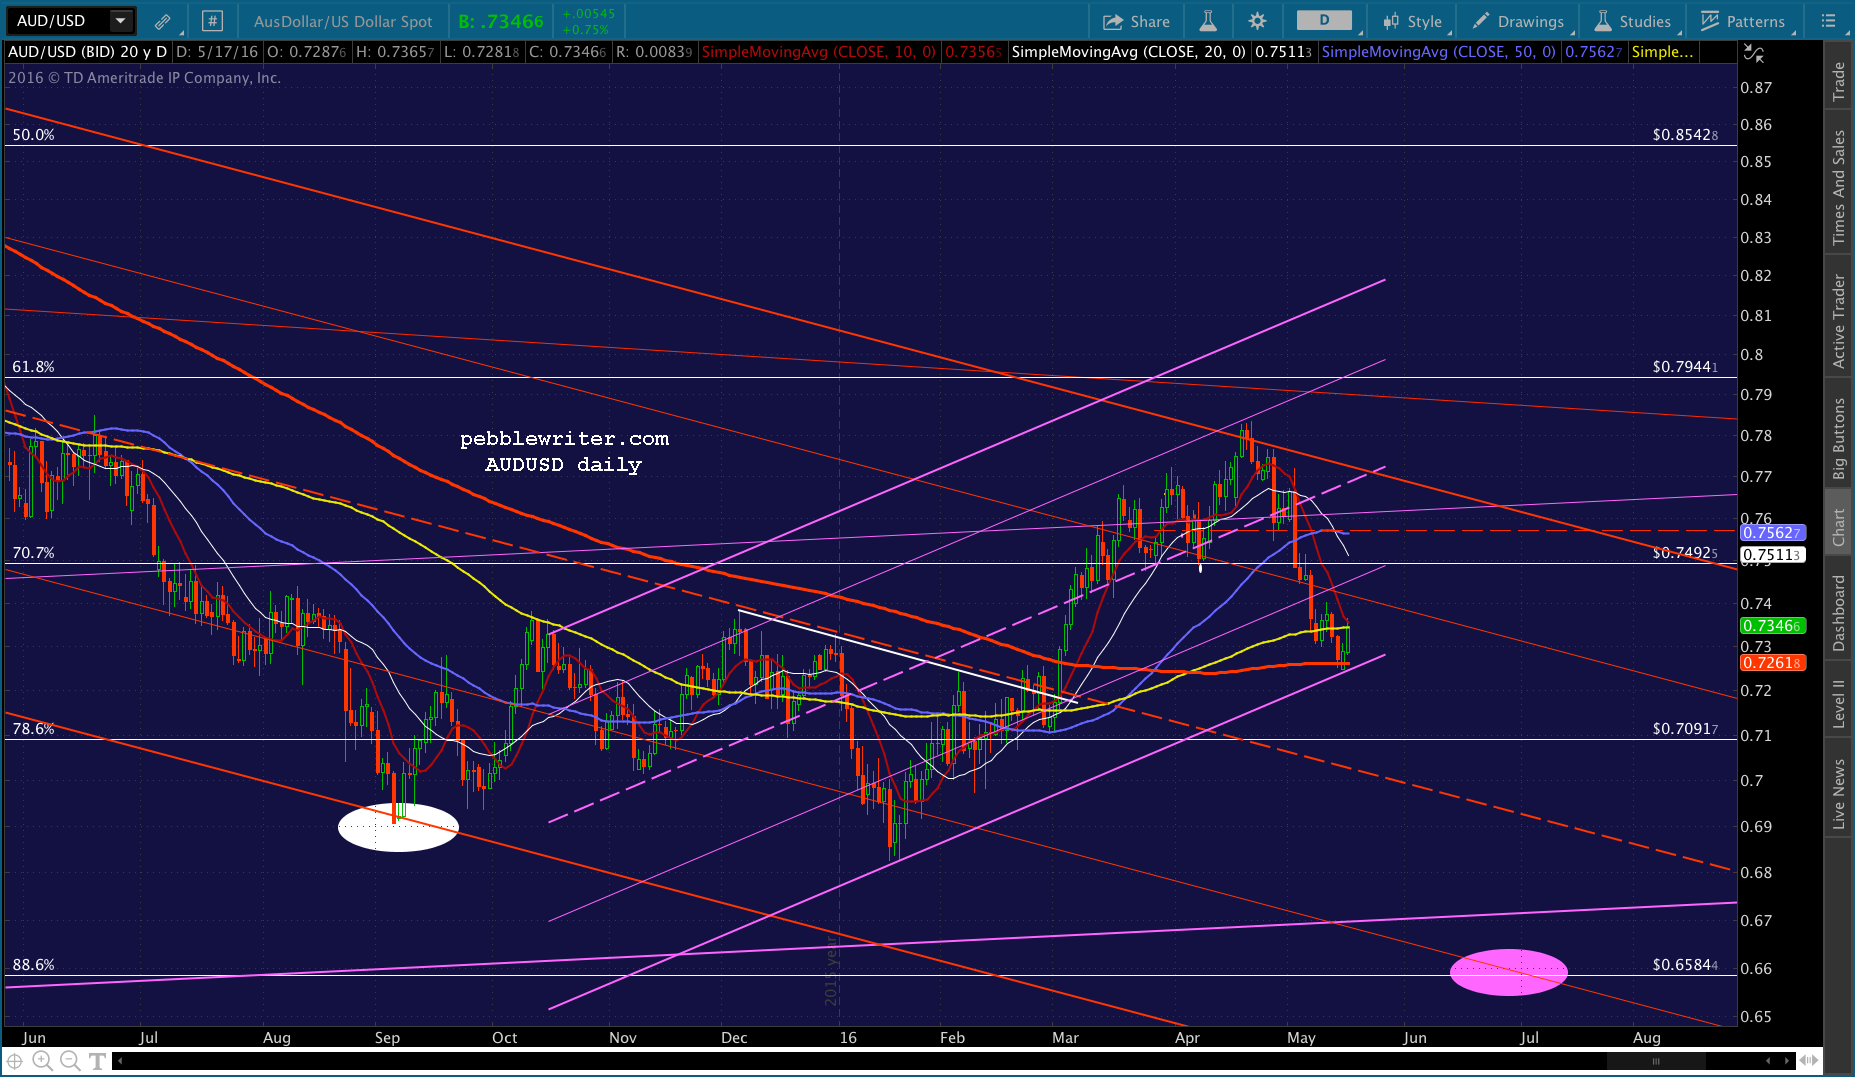 Stay tuned.