

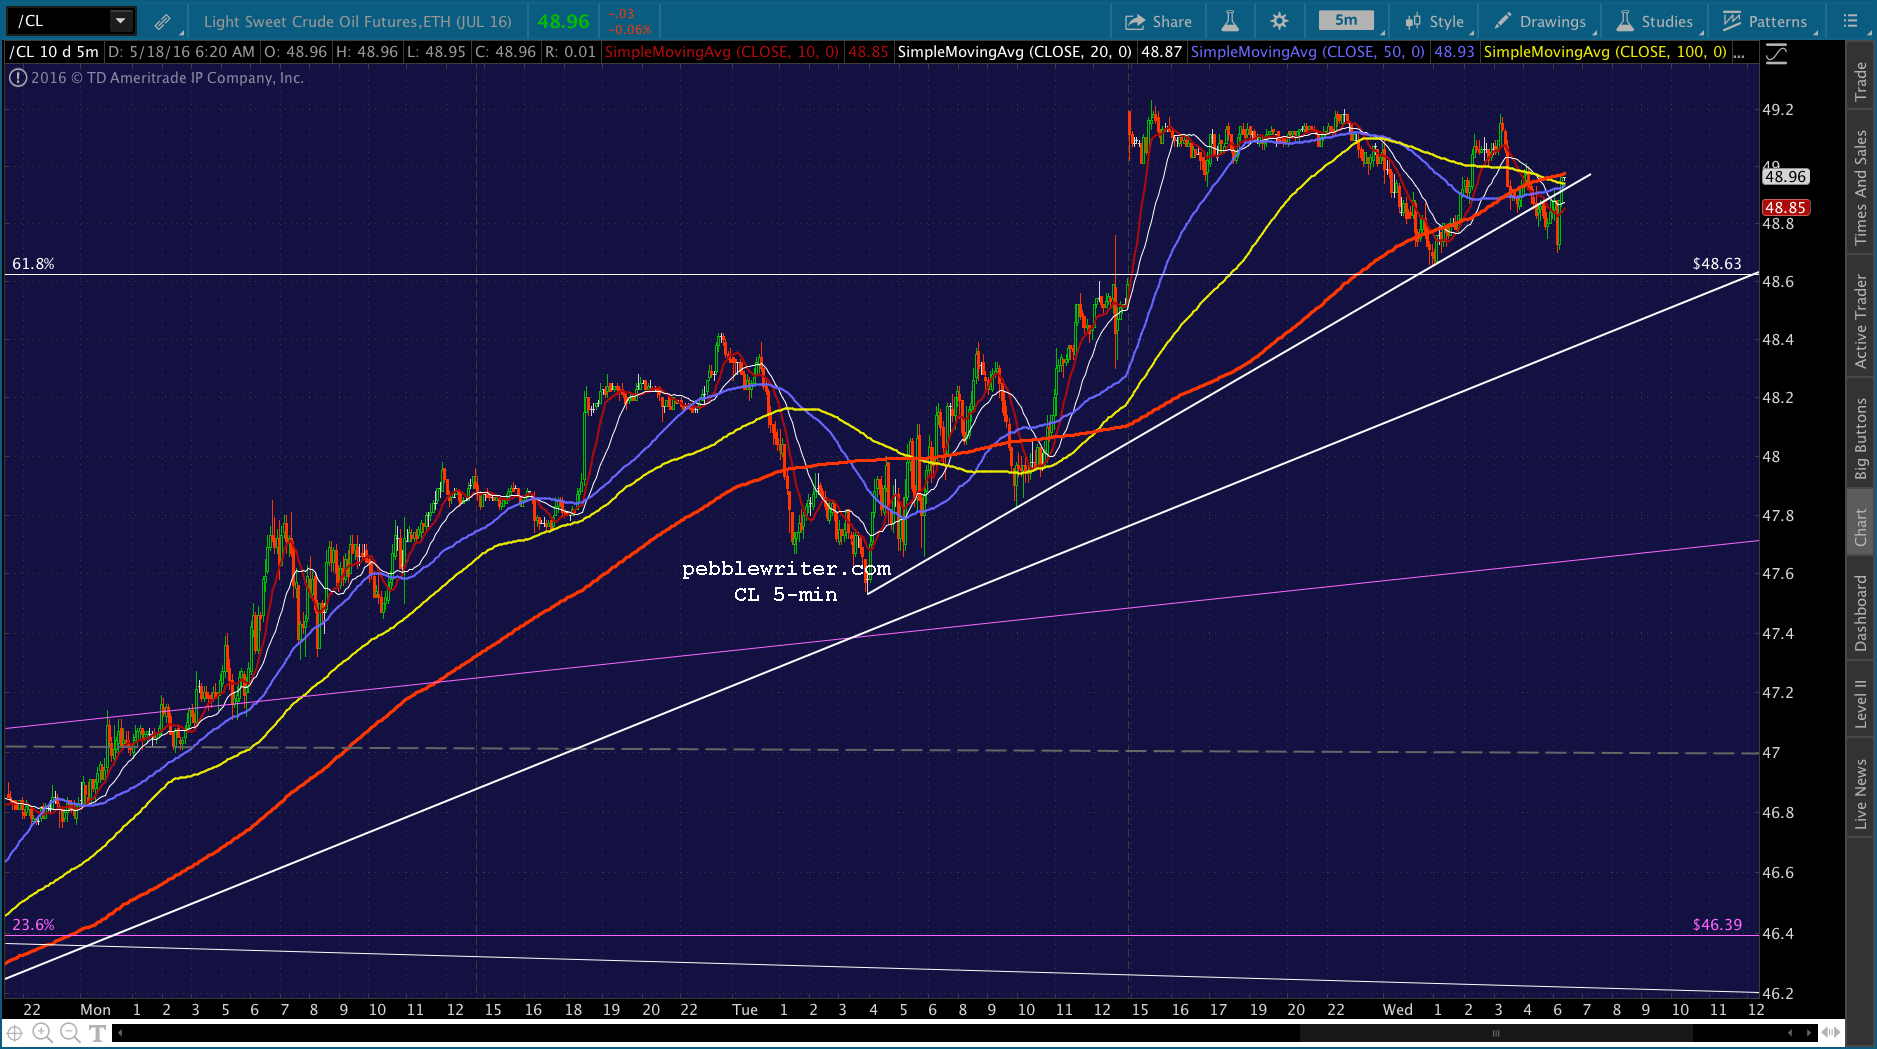
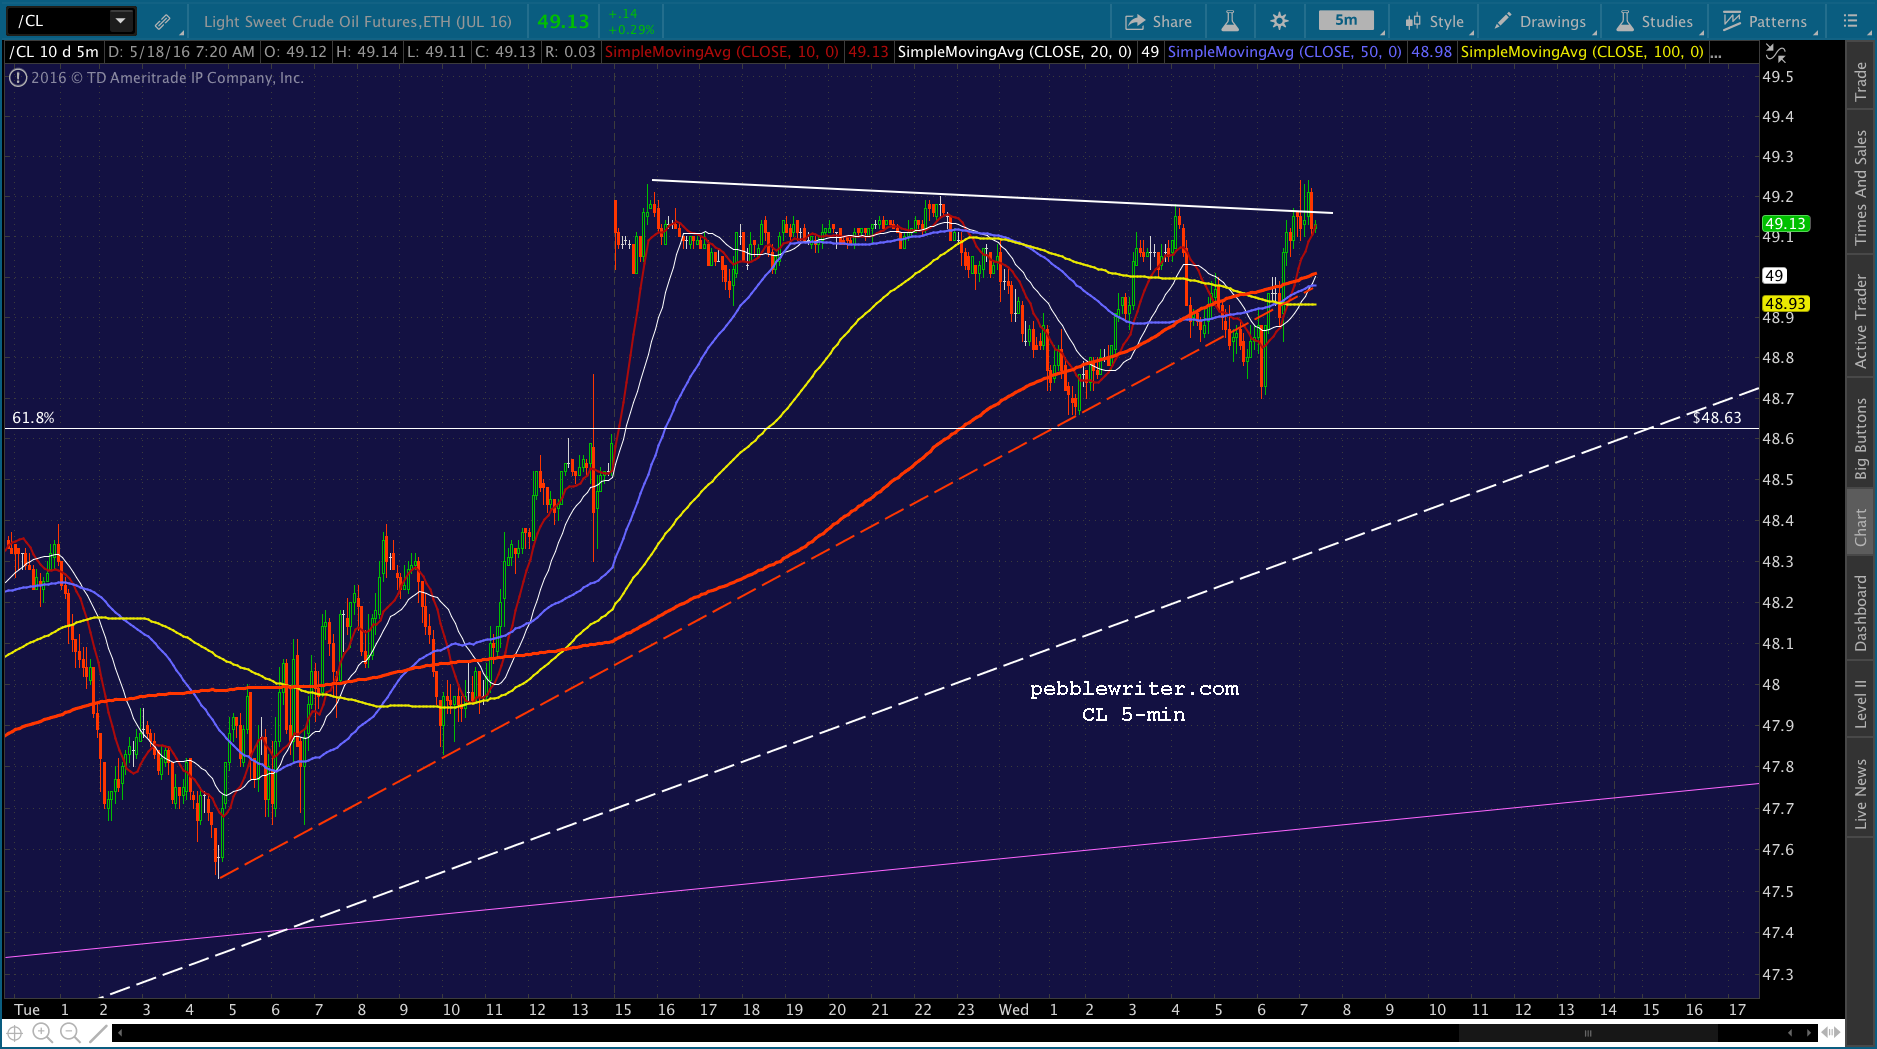
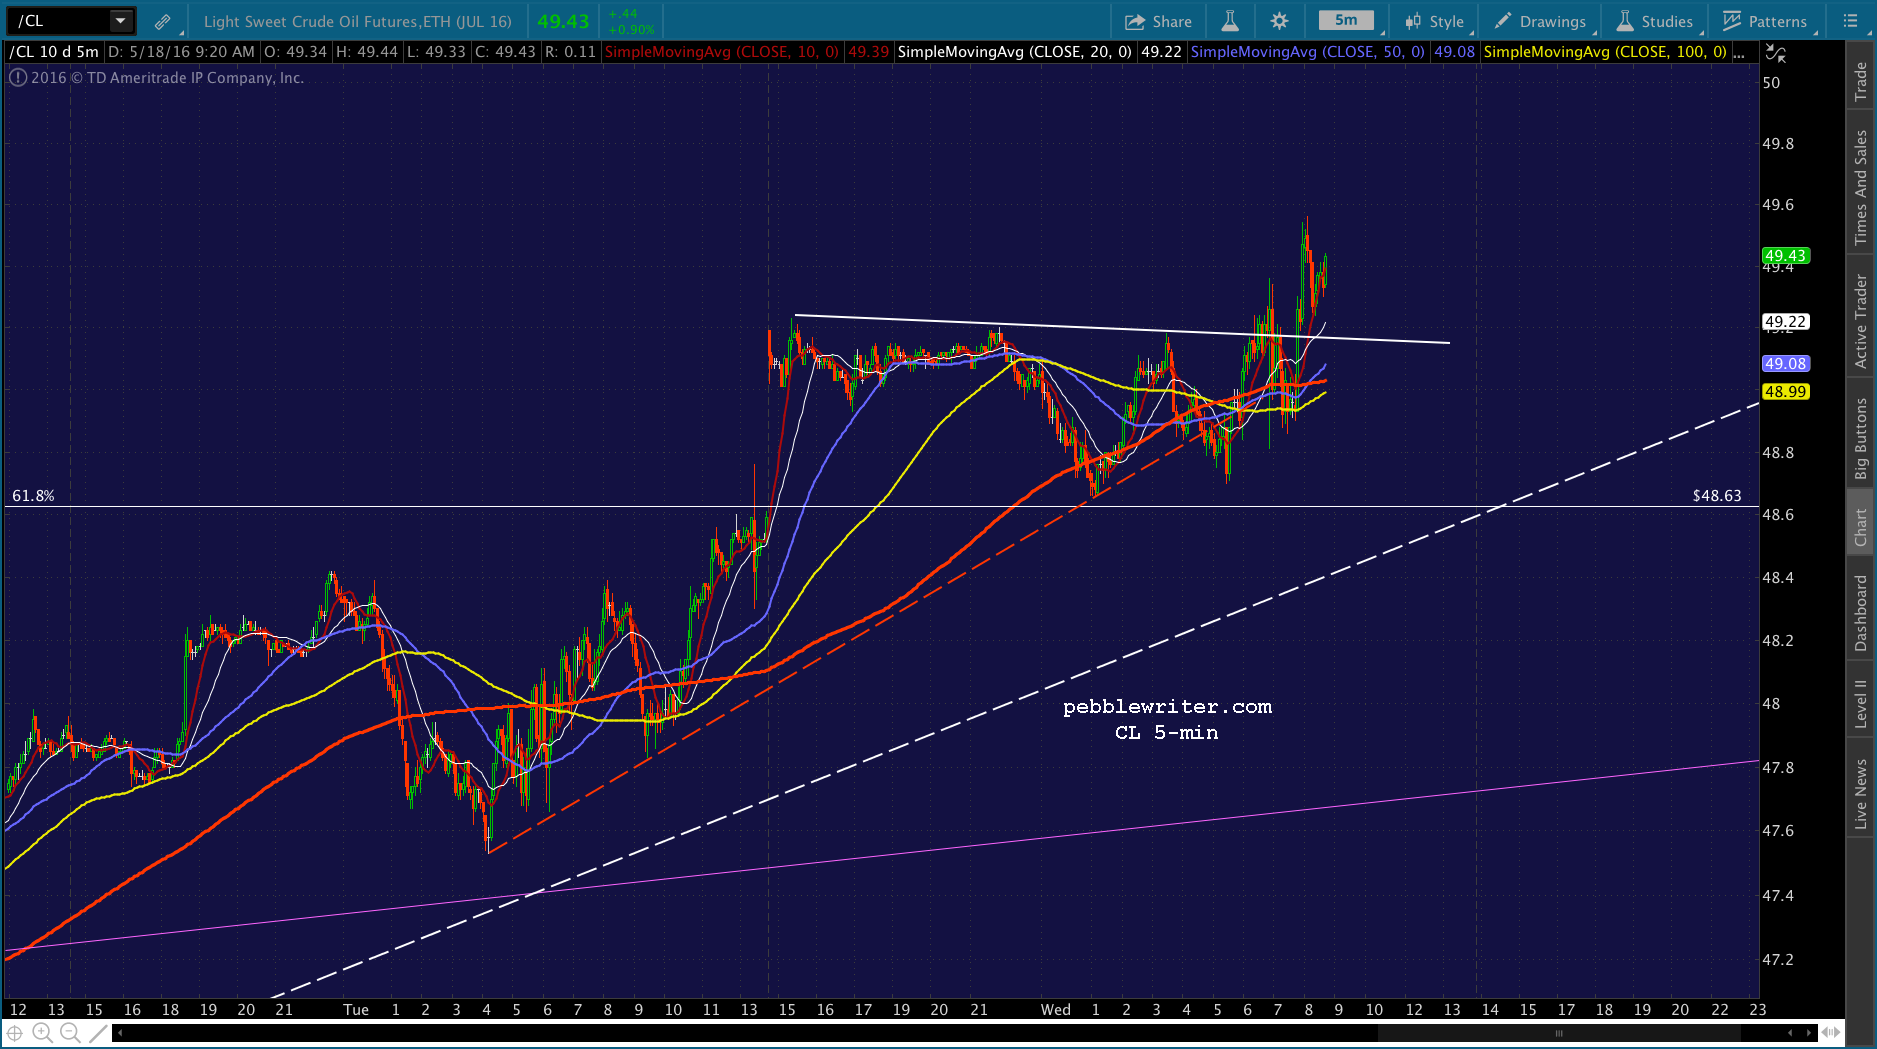
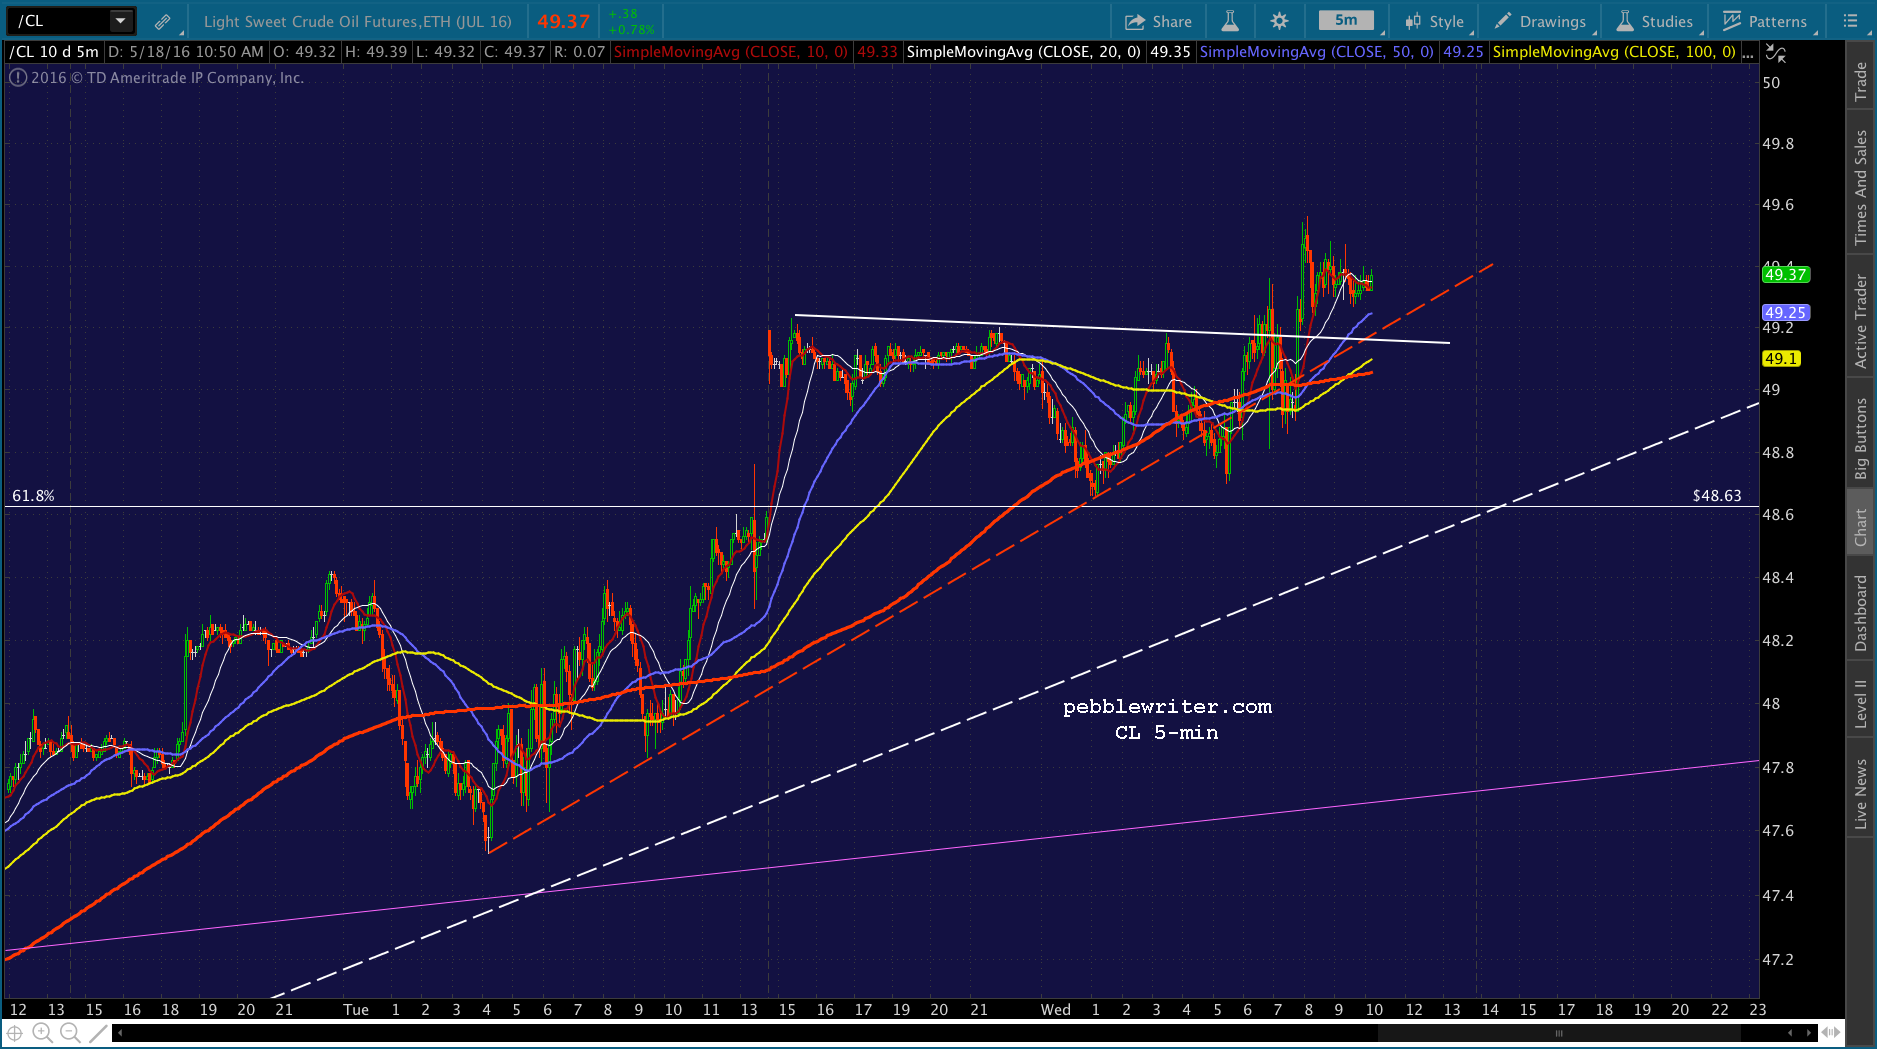
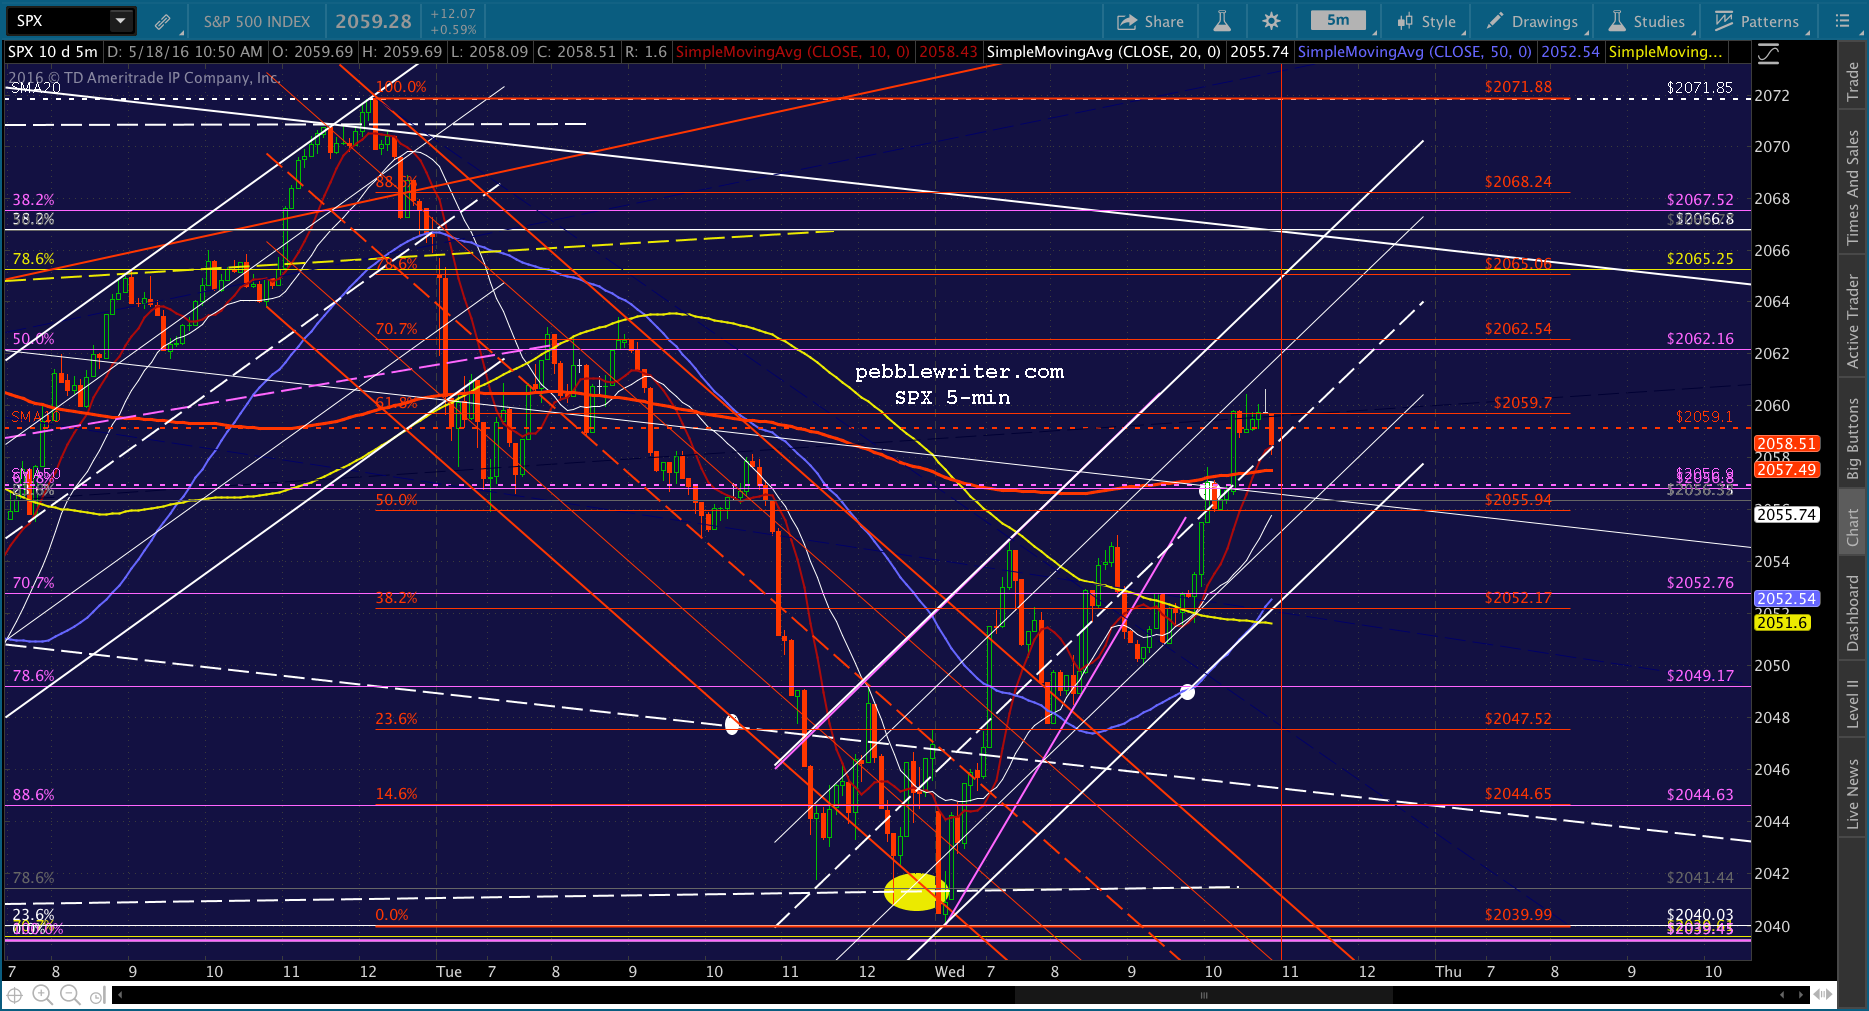
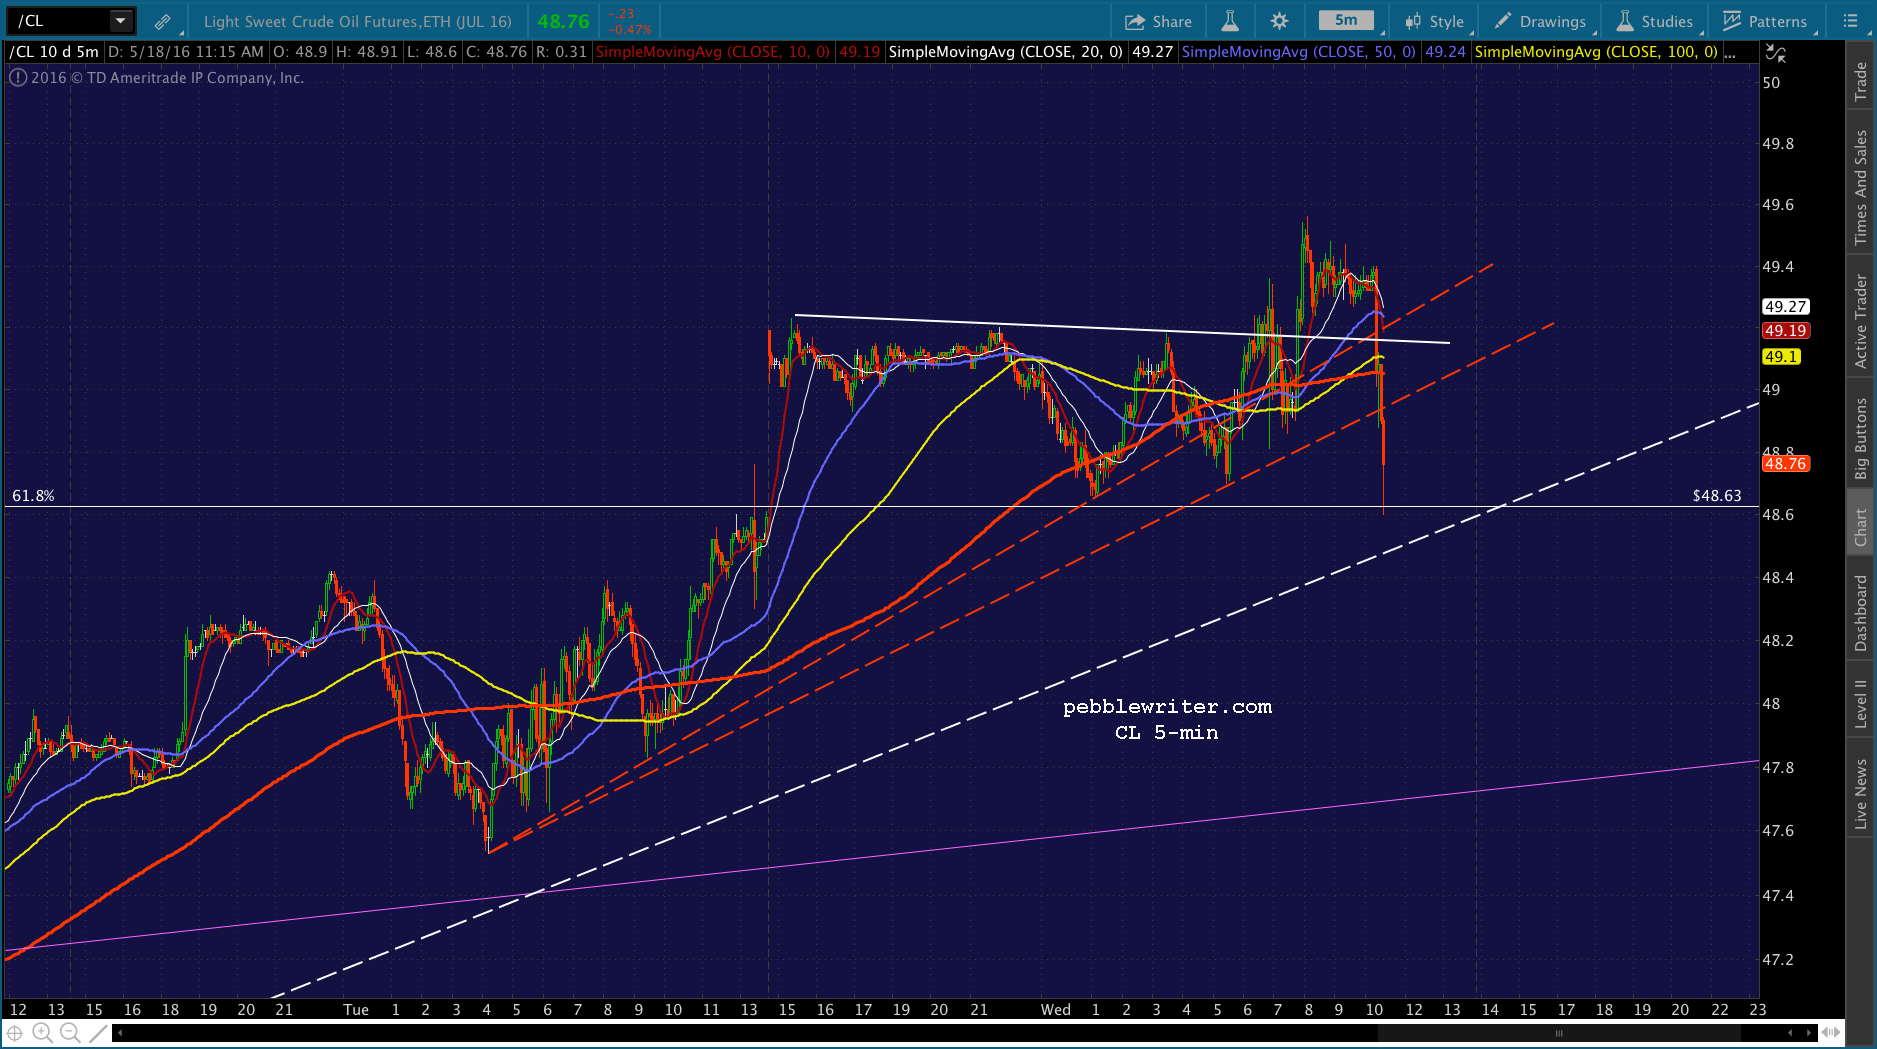
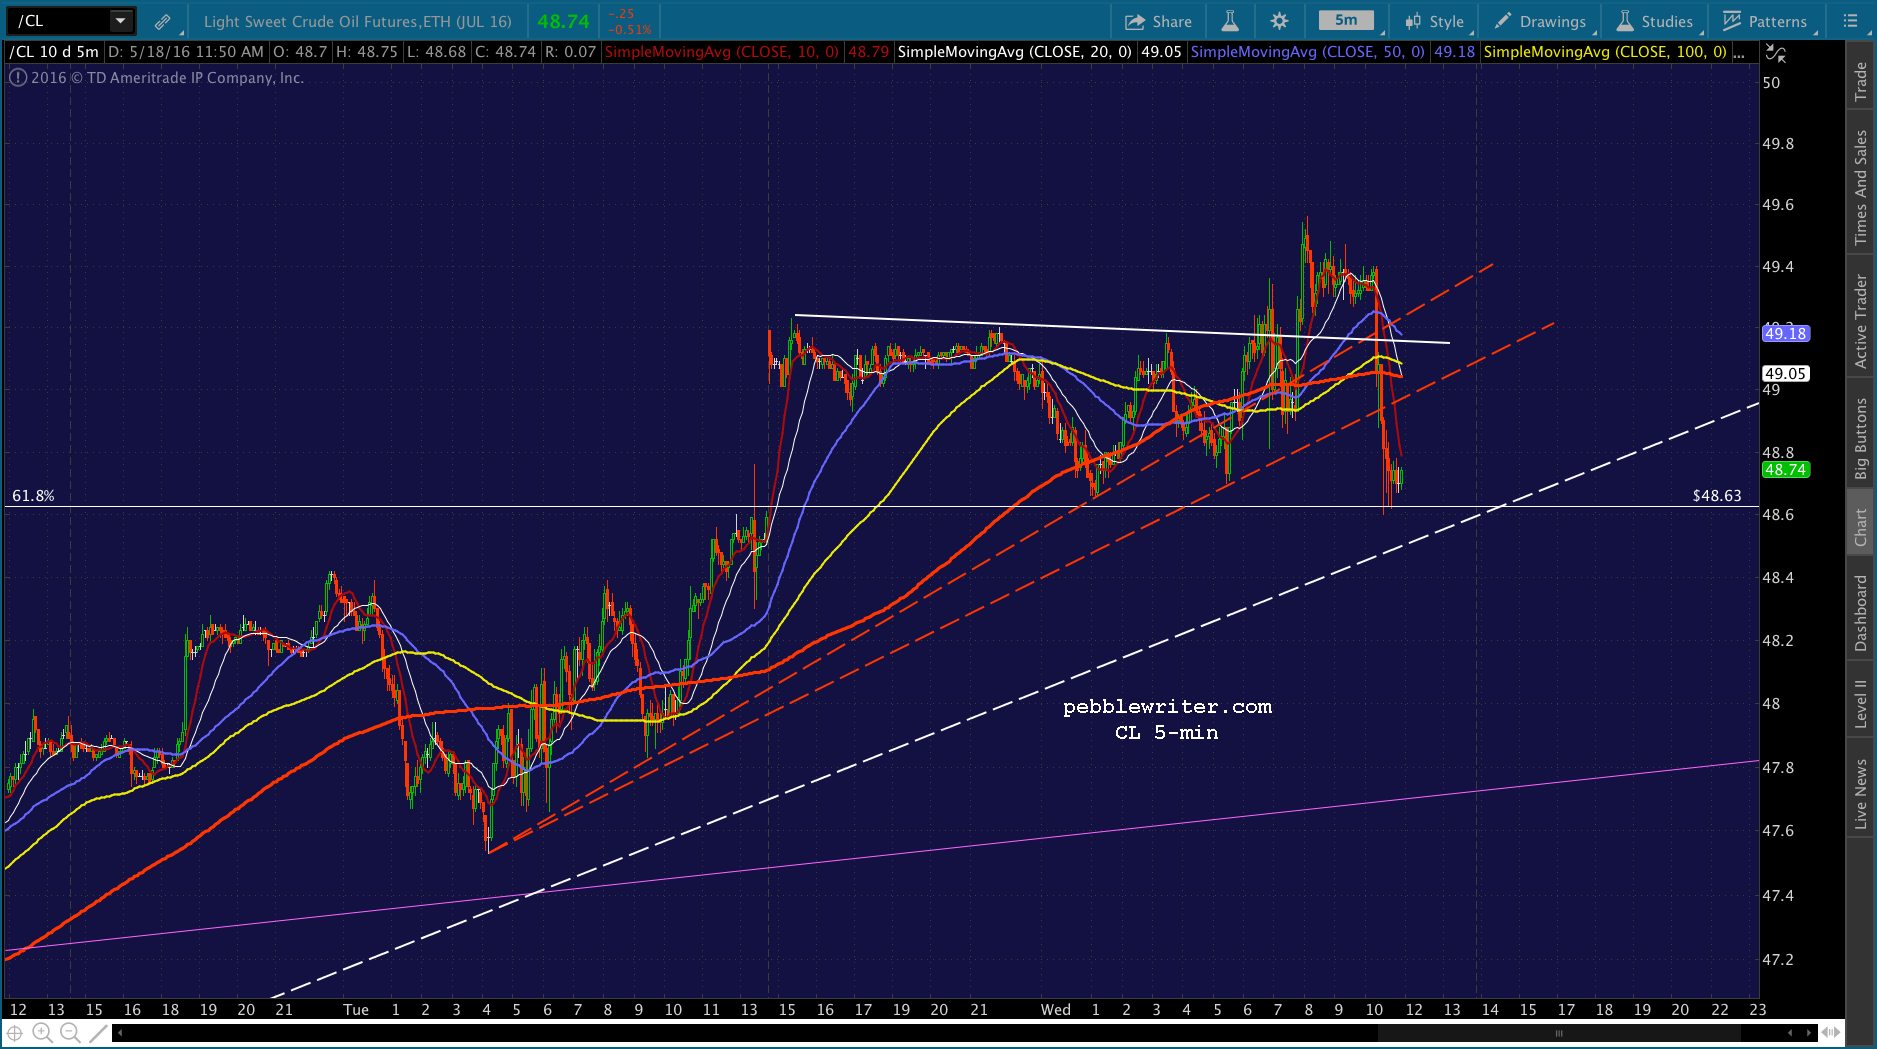
SPX nailed our next downside target yesterday, but the fun isn’t over. The eminis still have something to prove — its own H&S neckline — meaning SPX has a little further to go. From last Friday’s To H&S or Not to H&S: It will require some fancy footwork by CL, which popped up past its .618 Fib yesterday as though oil-related news had been positive. But, note the slide back below the white TL, and the lack, thus far, of a proper backtest. Remember, we have an EIA report out at 10:30 EDT.
continued for members…
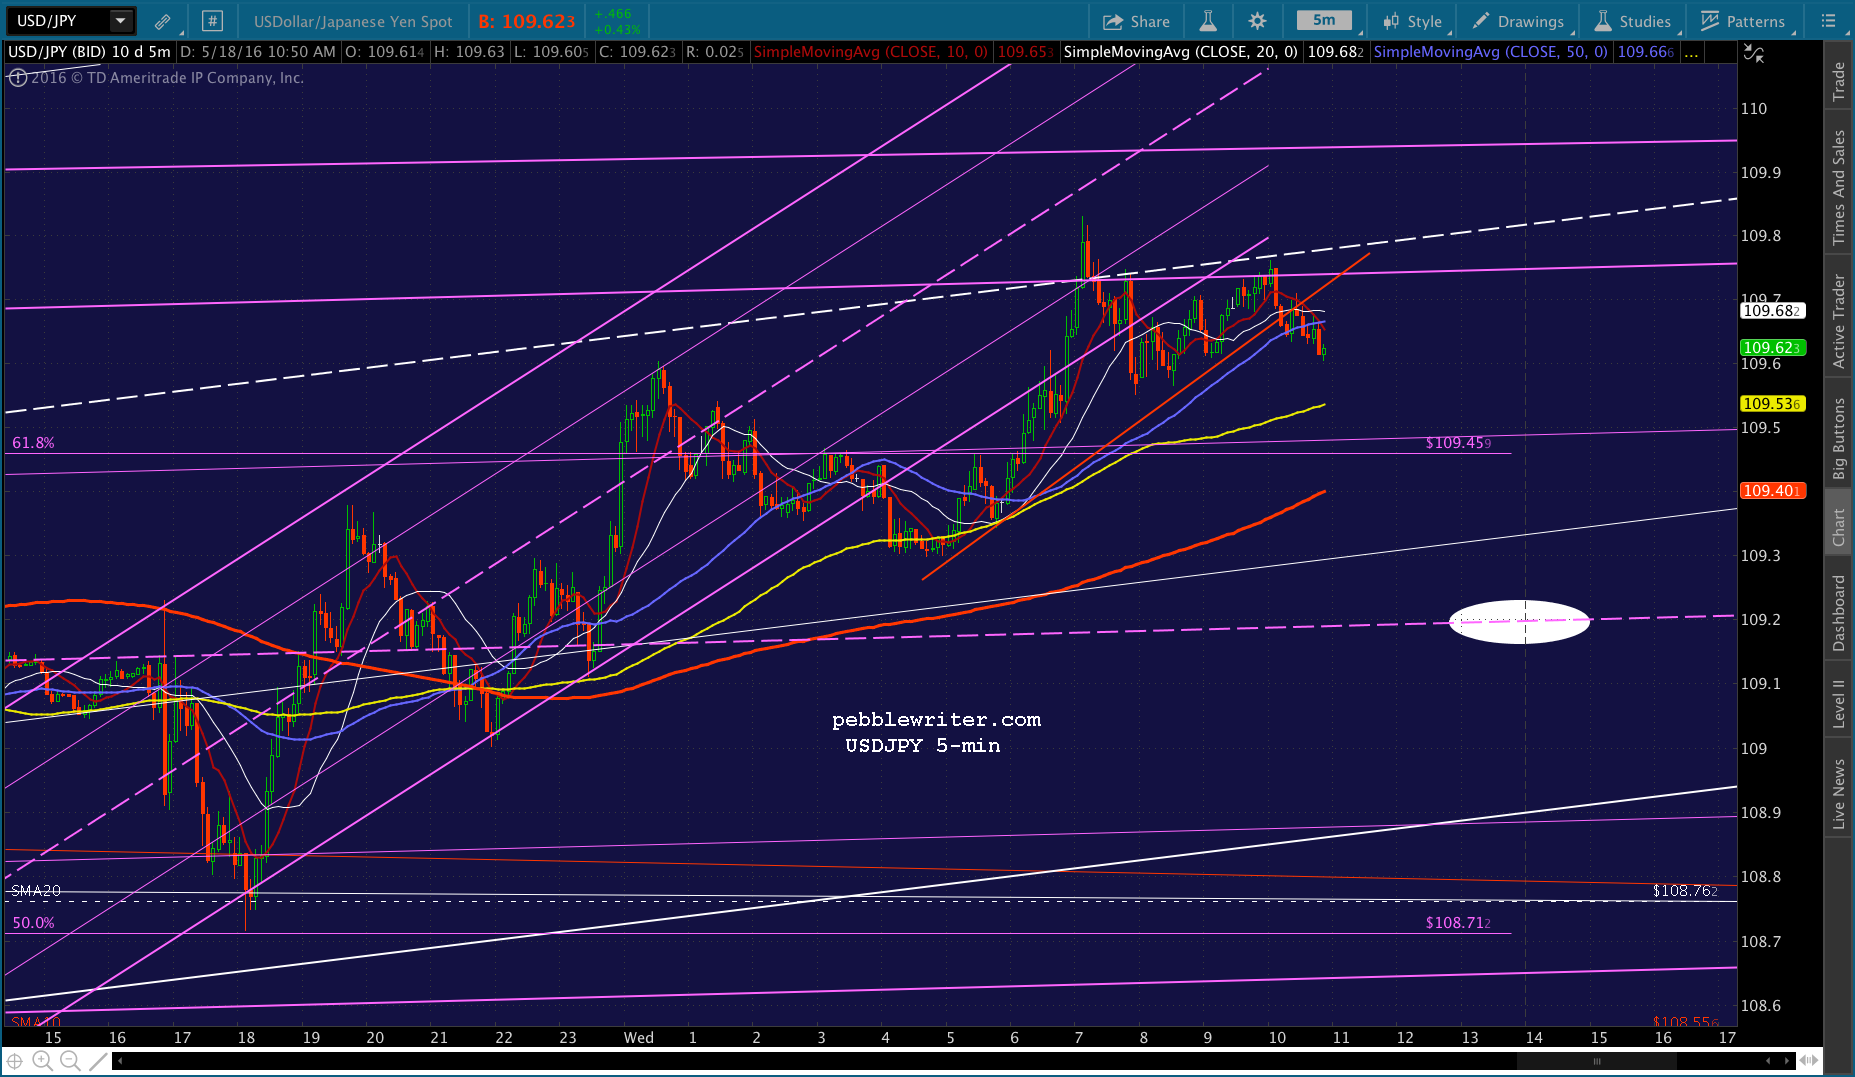
 And, USDJPY, which is threatening to break out after nearly tagging our downside target yesterday, will need to back off.
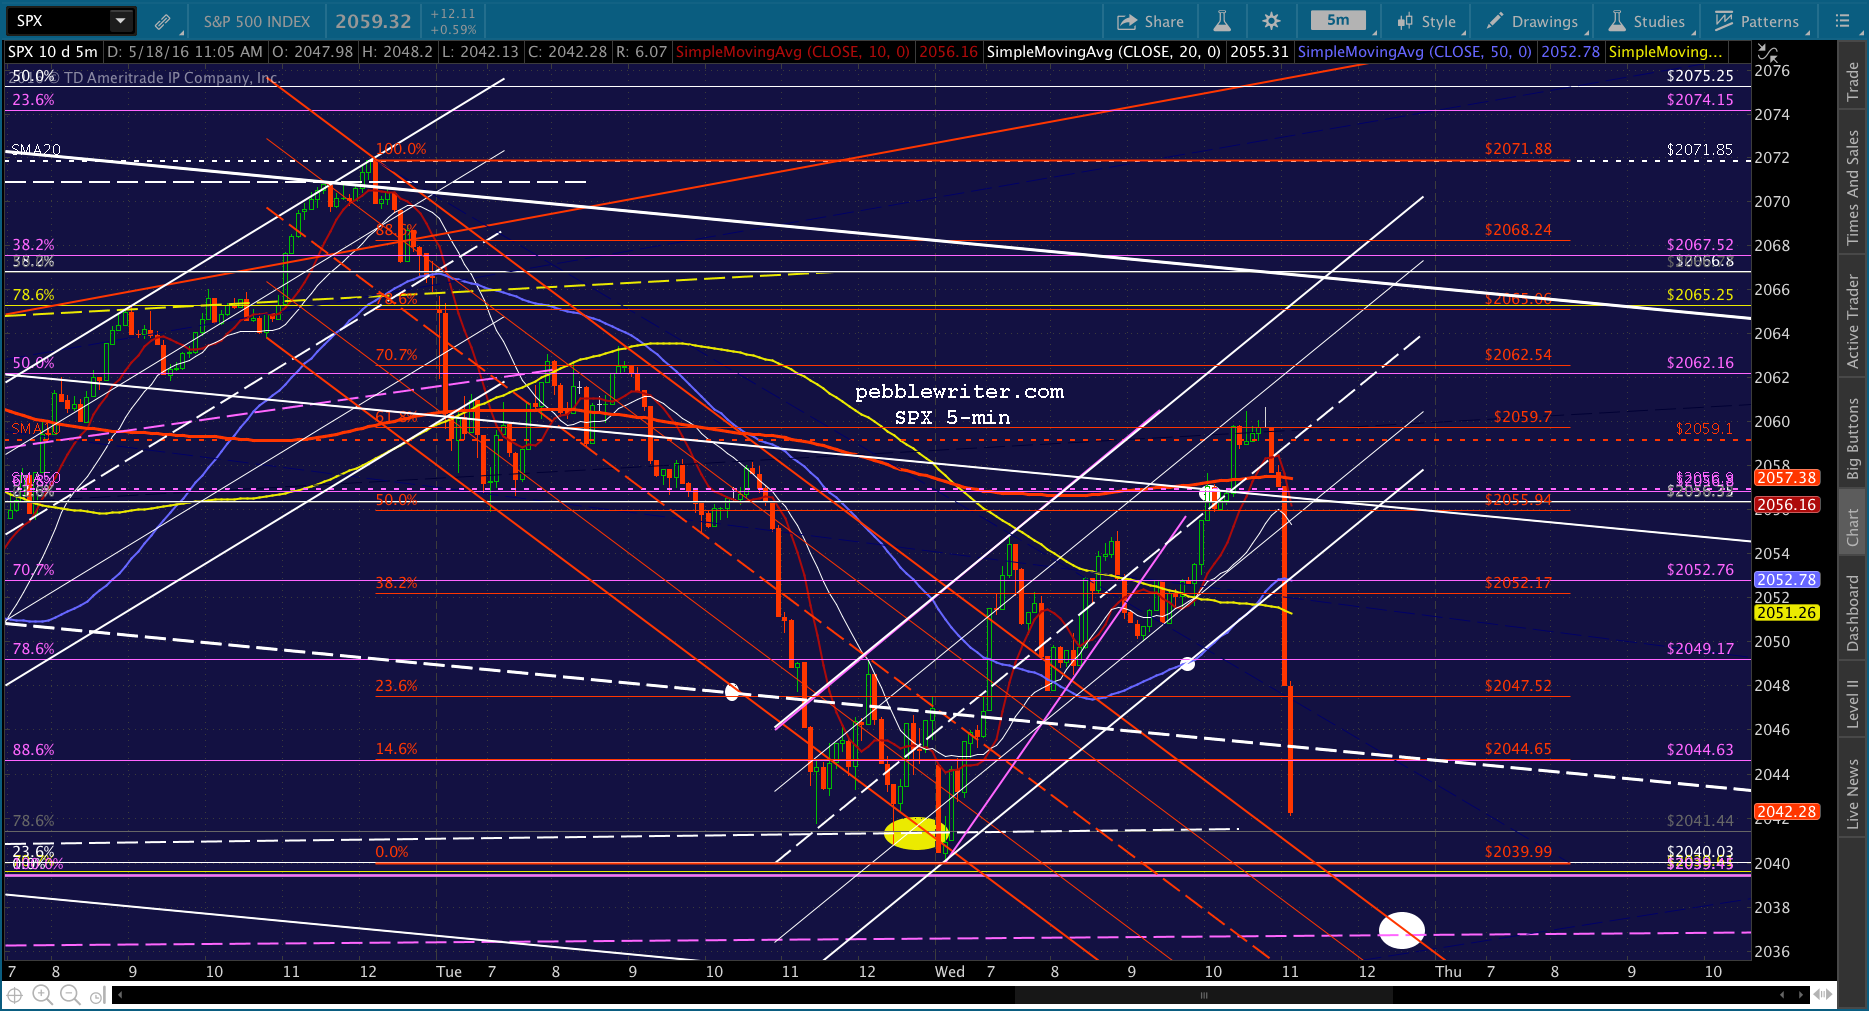
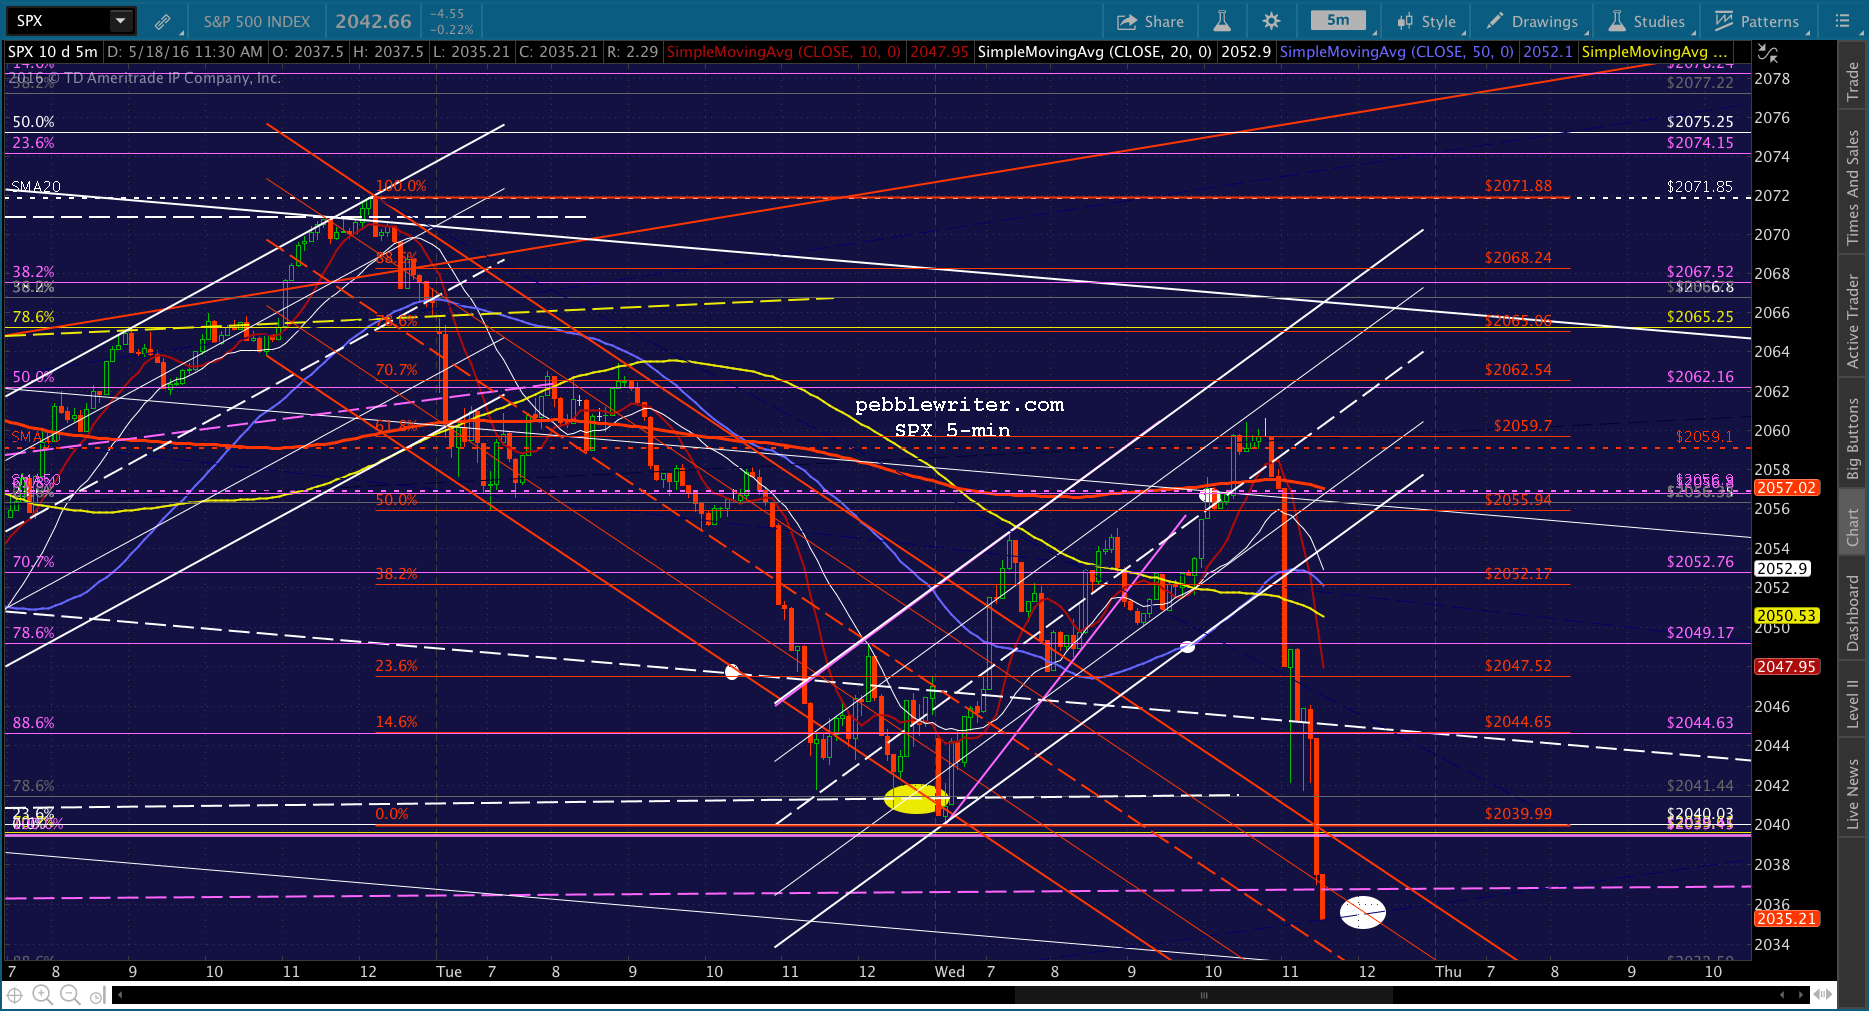
 The big picture for both ES and SPX:
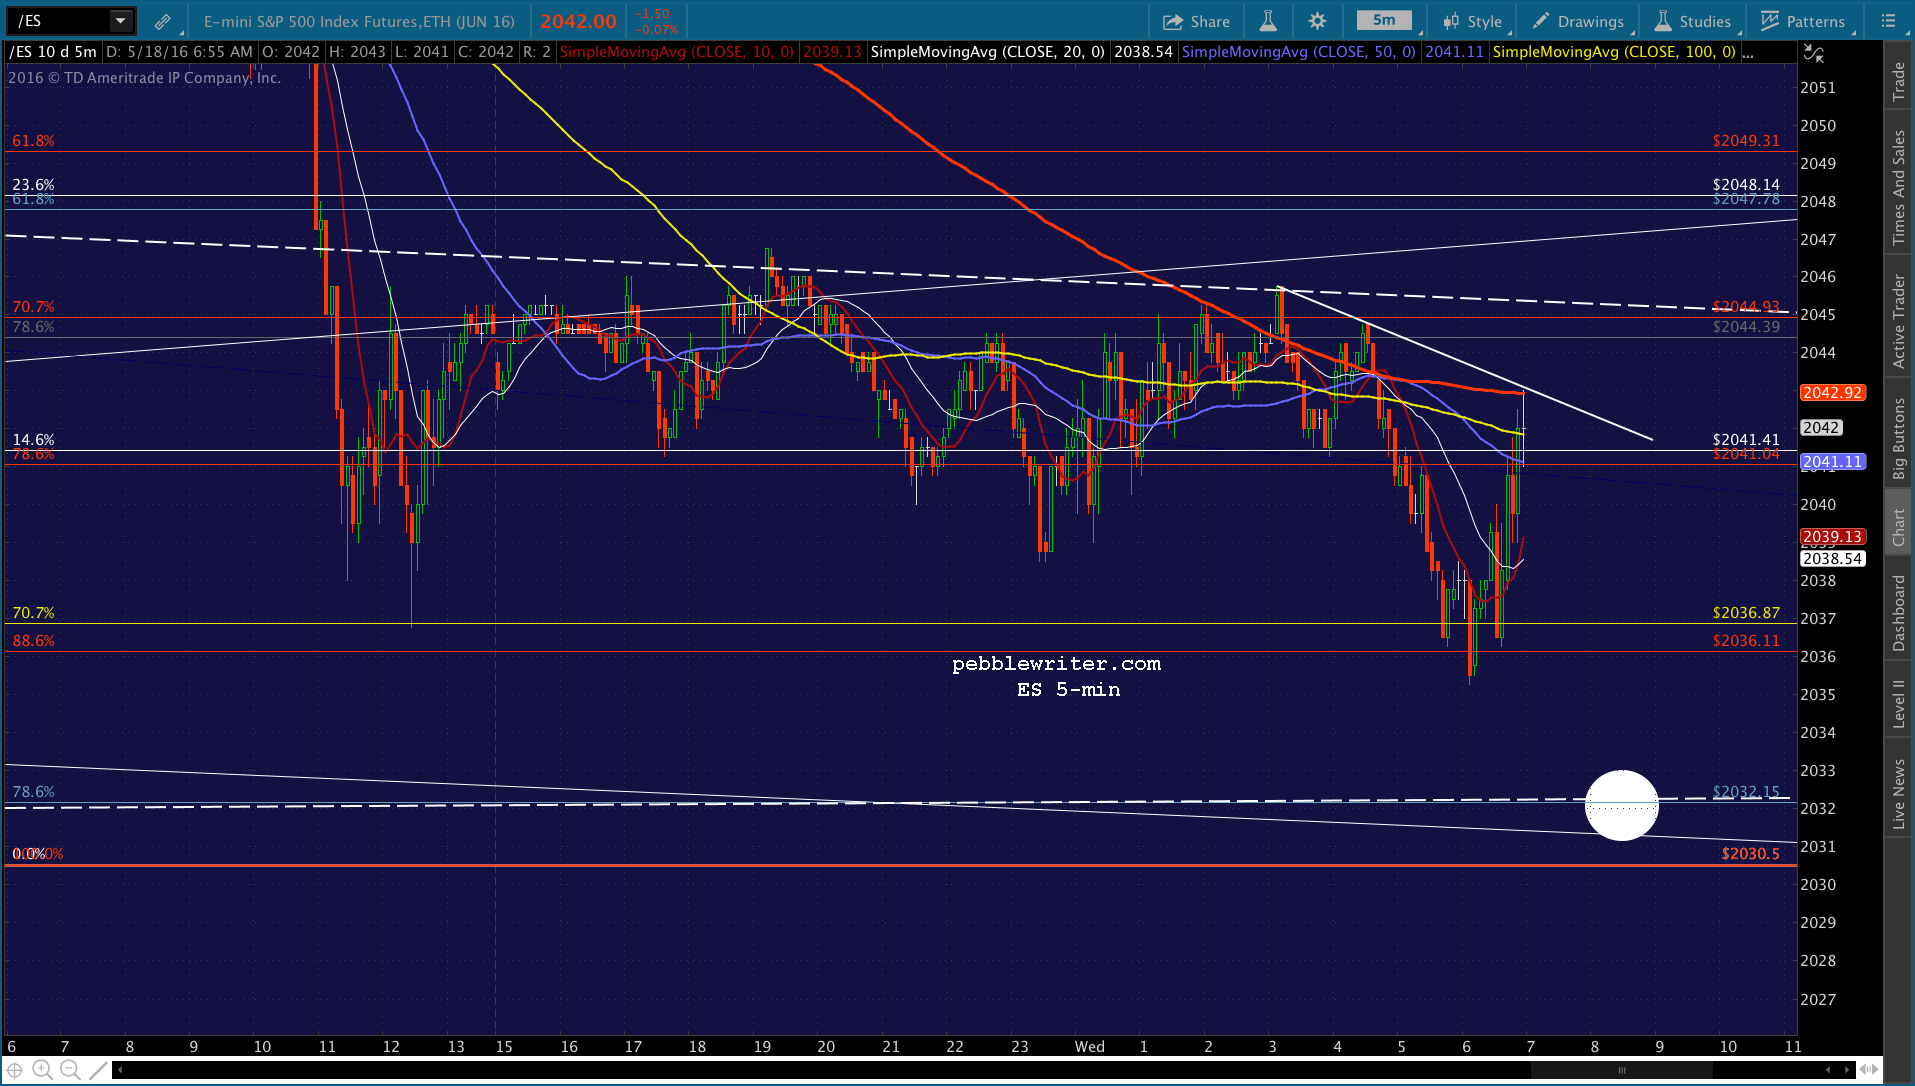
 I show the neckline at around ES 2032.25, which should be around 2035.50 in SPX.
Stay tuned.
UPDATE: 9:59 AM
This would be a good turning point for the drop to ES 2032.15. Shorting here for those who aren’t short from last night.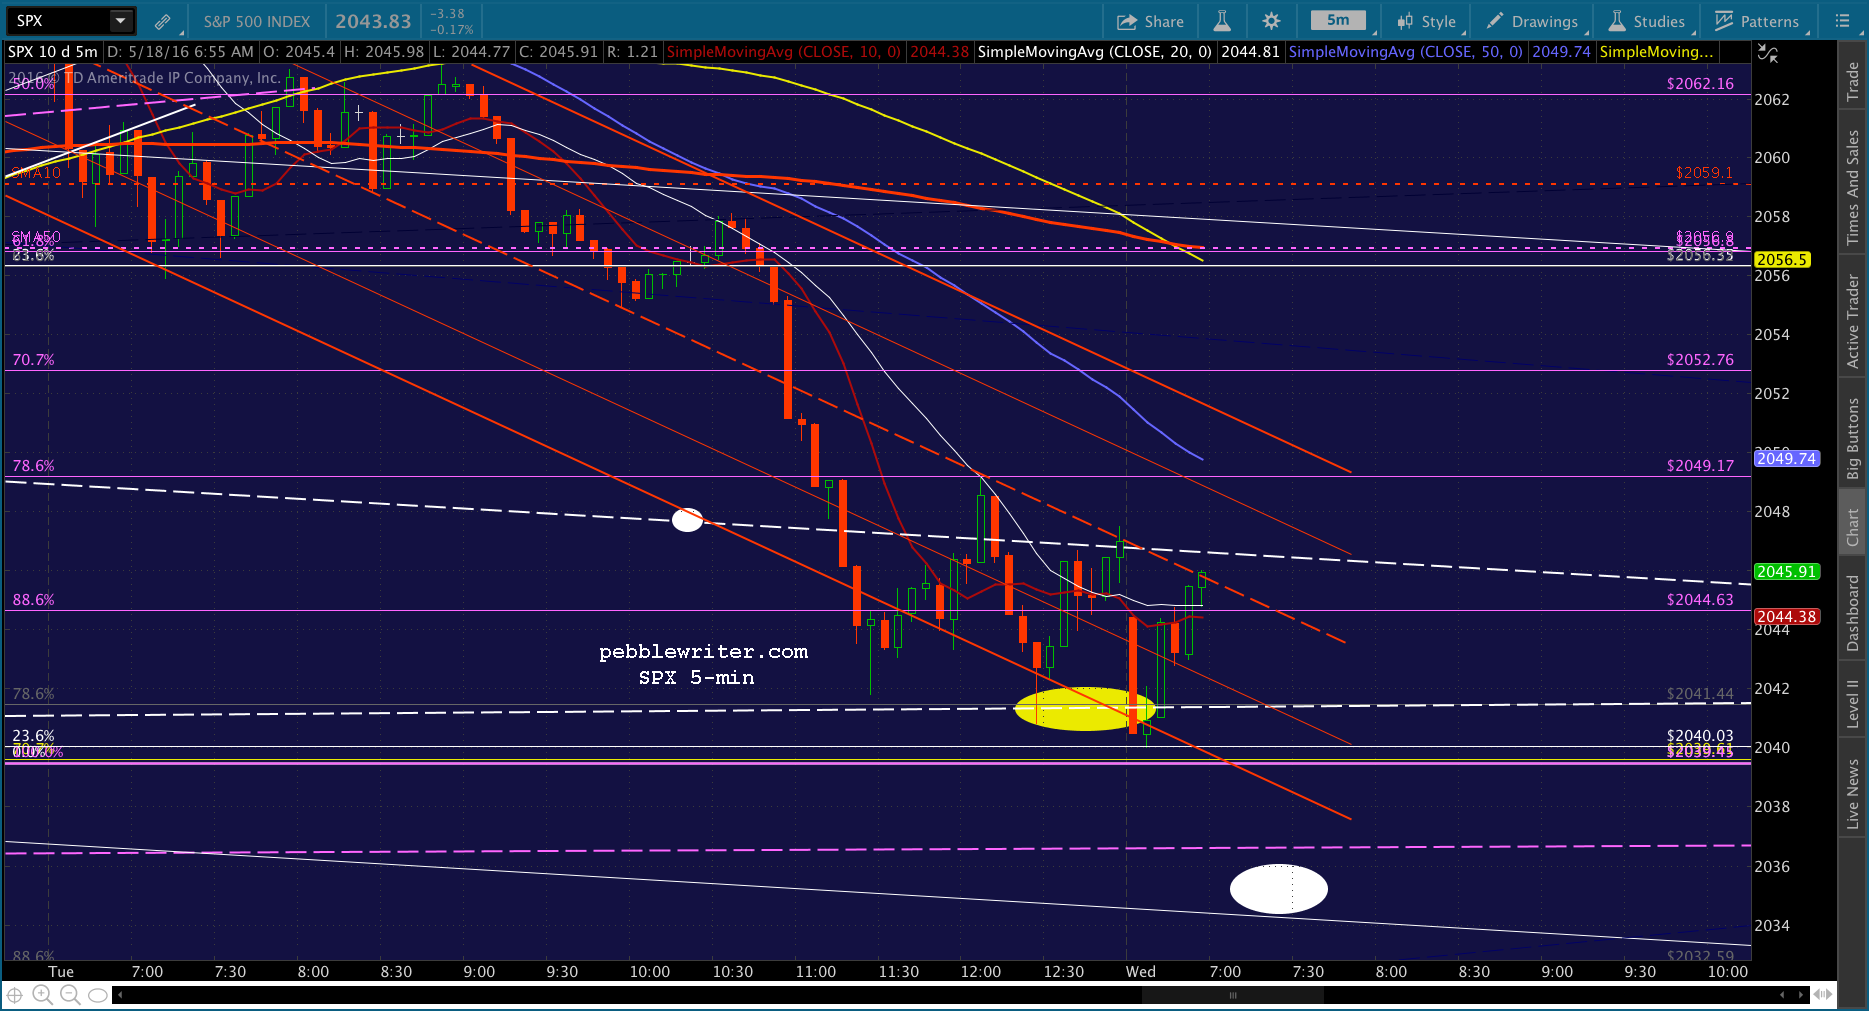
 UPDATE: 10:13 AM
Looks like it’s running away from us here. I’d close the short and move to the sidelines until we get a reversal. UPDATE: 10:24 AM
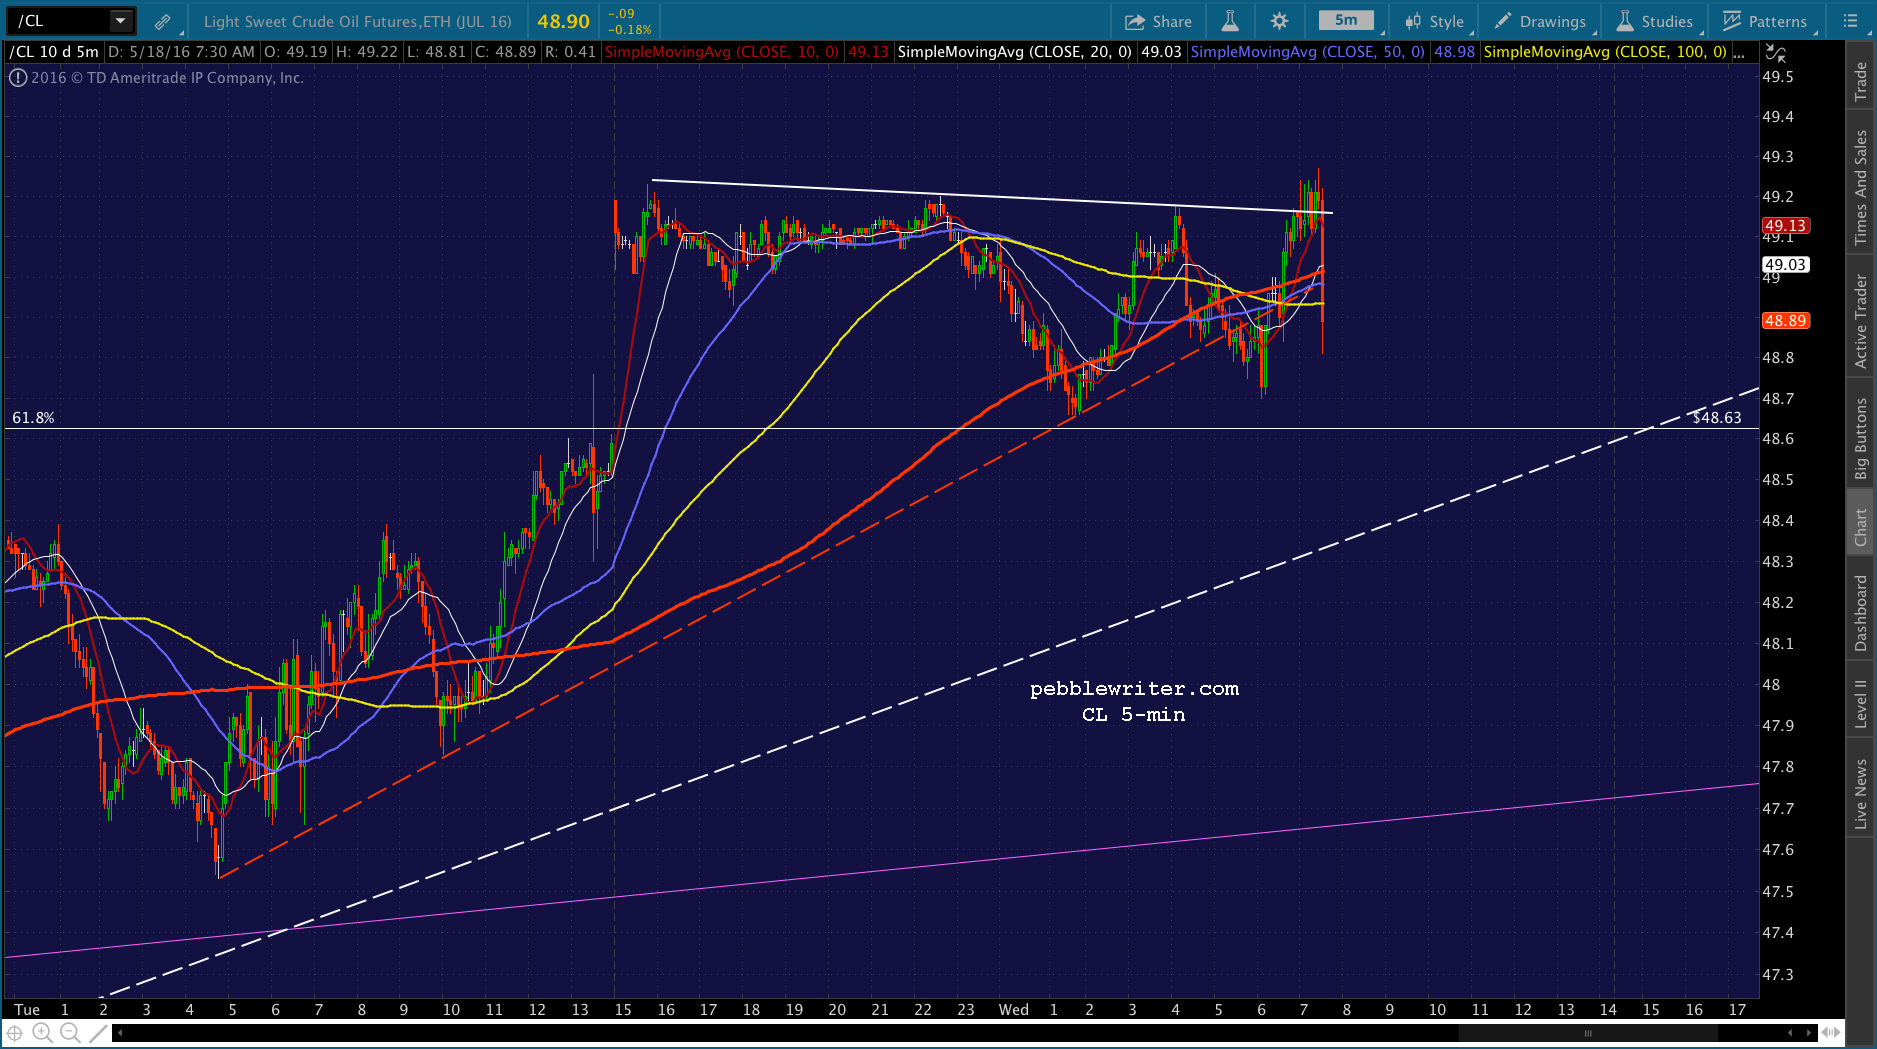
The EIA inventory report is due out in minutes. CL is acting as though it’s not sure, so my gut tells me it won’t be positive. Might be looking to short at the SMA5 100 or 200 on any weakness. 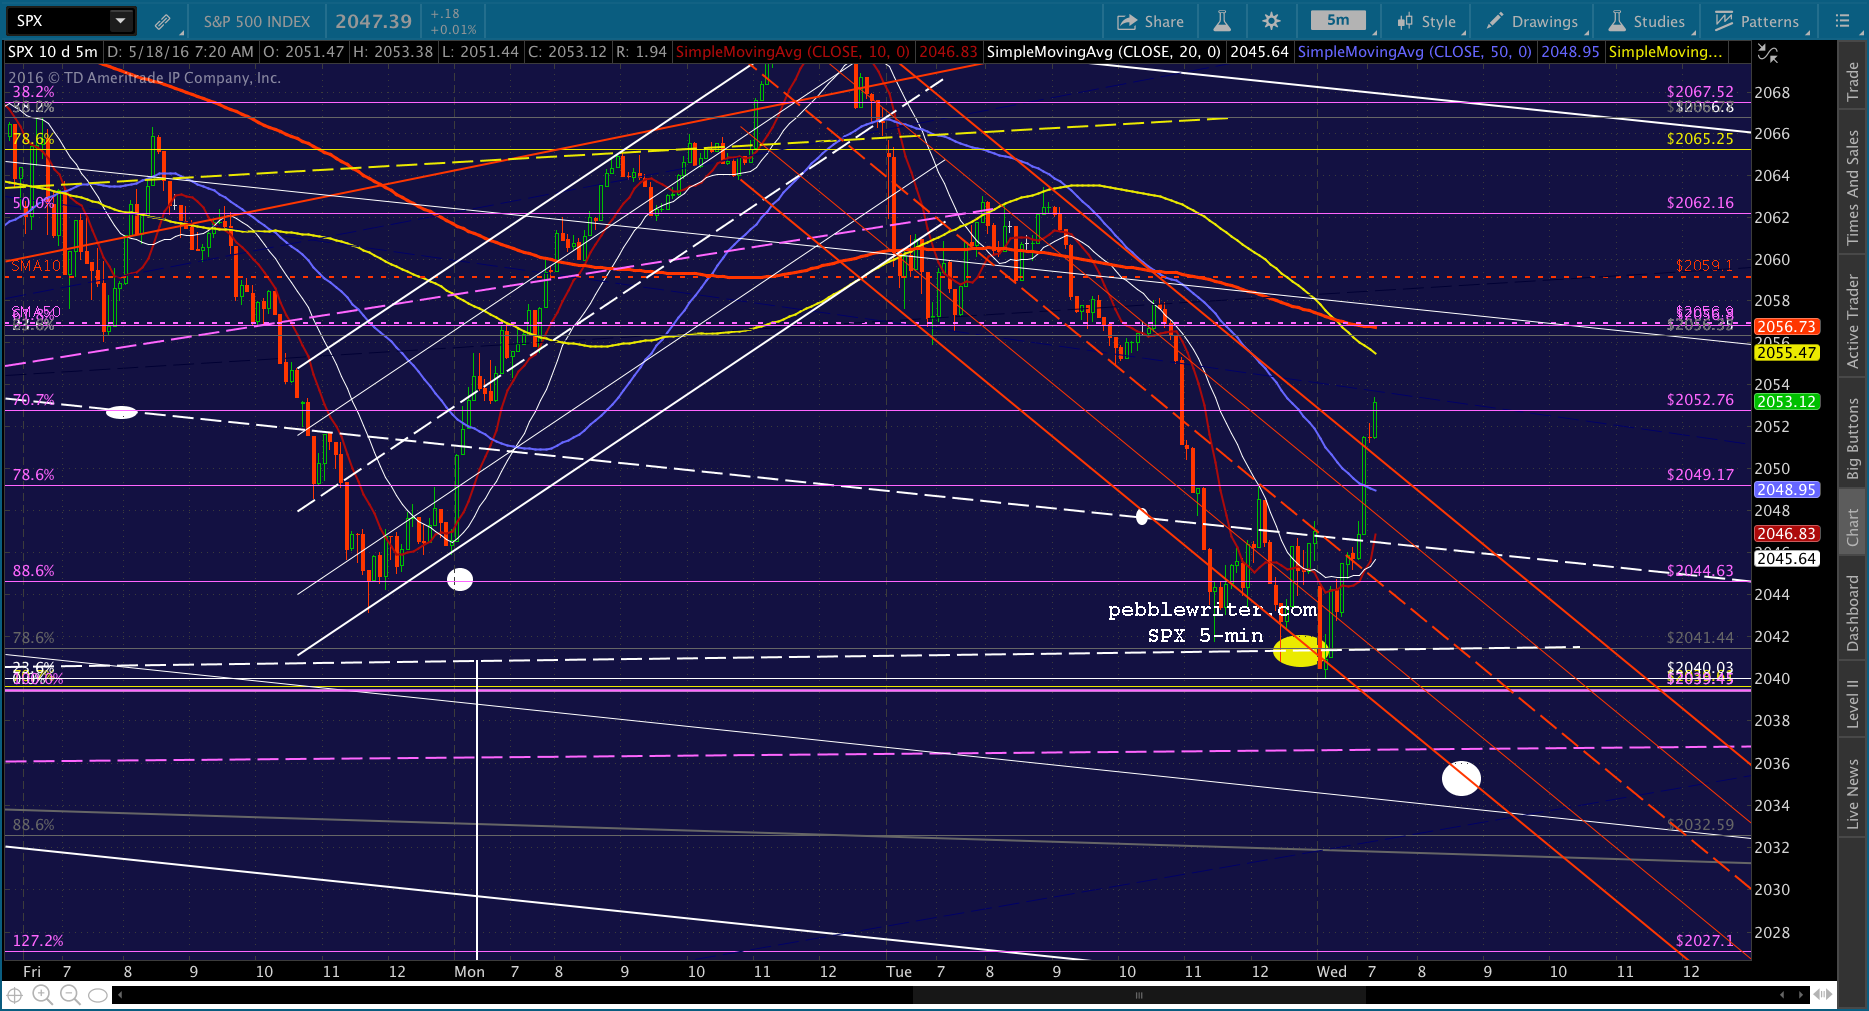
 UPDATE: 10:31 AM
Shorting here on a negative reaction by CL. Inventory rose by 1.3 million barrels versus last week’s drop: http://ir.eia.gov/wpsr/wpsrsummary.pdf
 It would have been nice had SPX tagged its SMA50 and the SMA5 200 at 2056.70. But, ES did tag its SMA50, which is probably more important in the scheme of things.
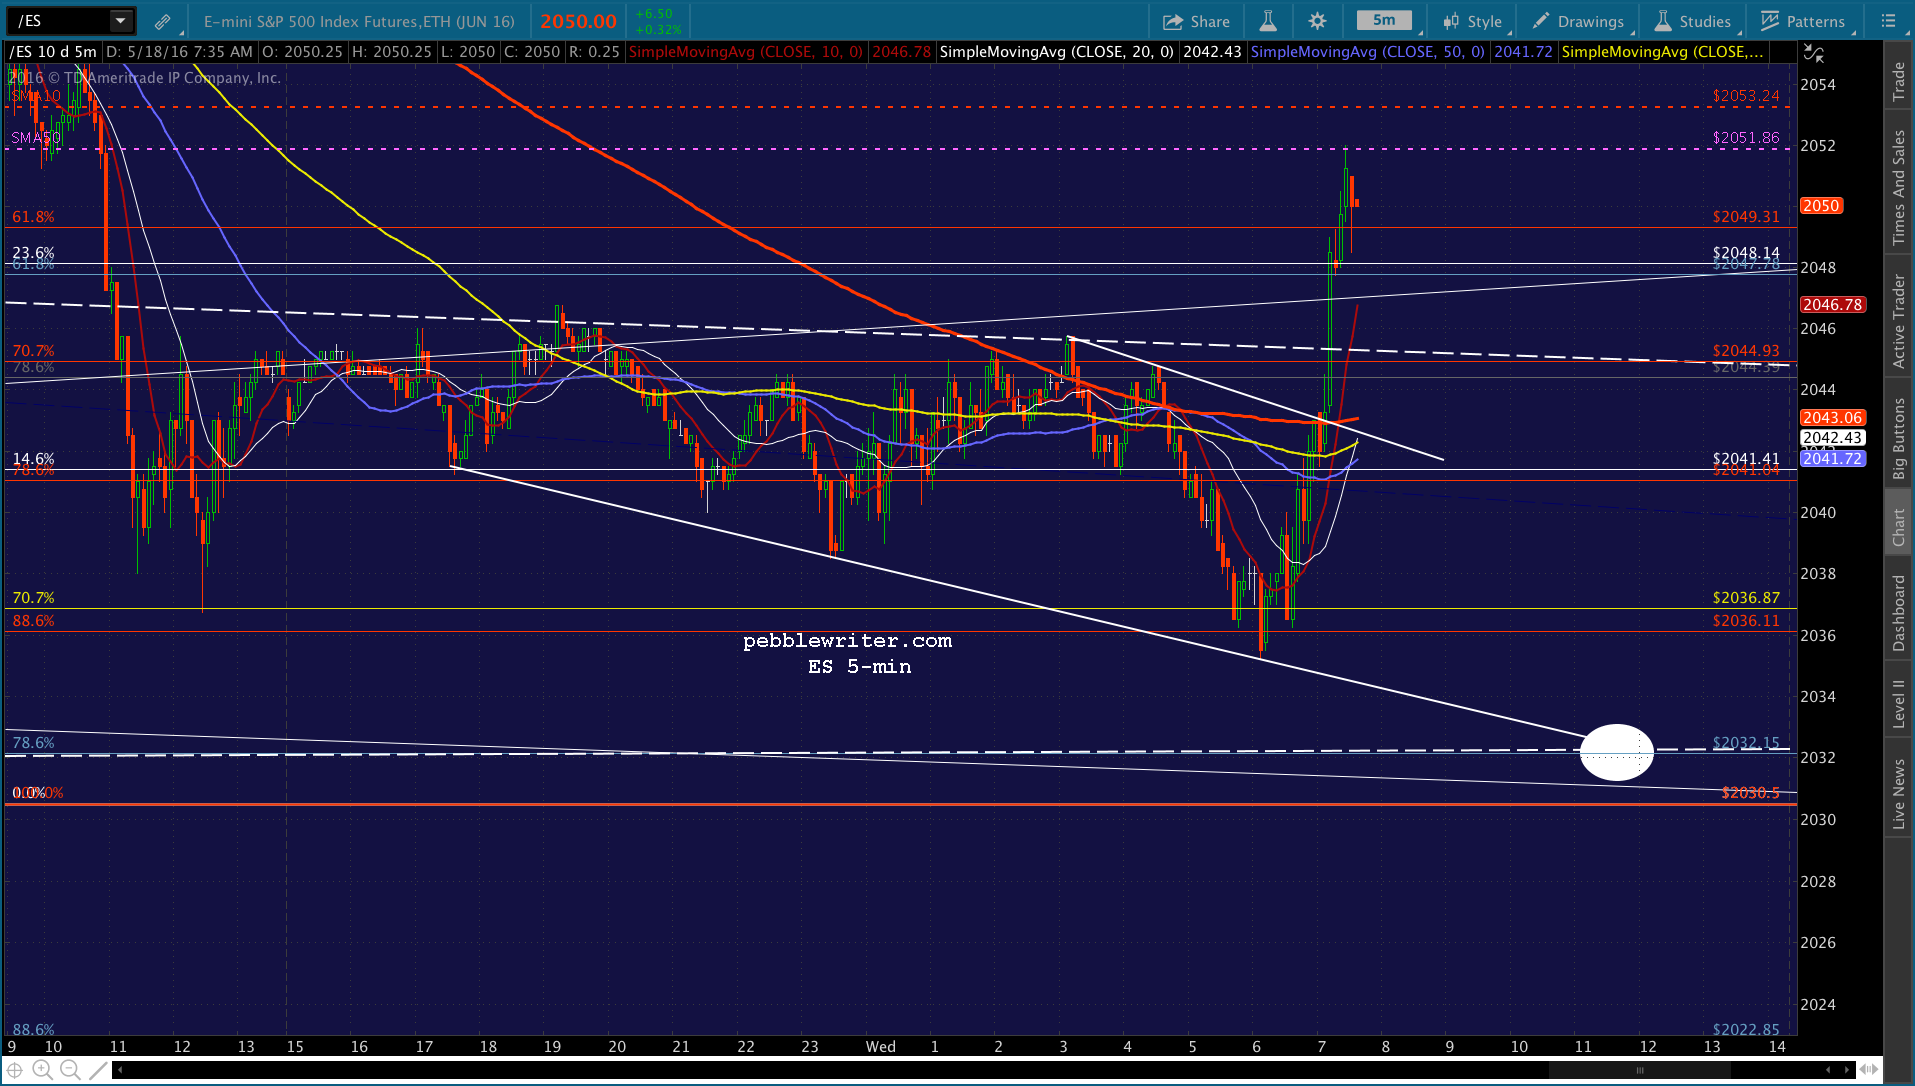 Note that USDJPY has corrected its overshoot and is back down below the white channel midline.
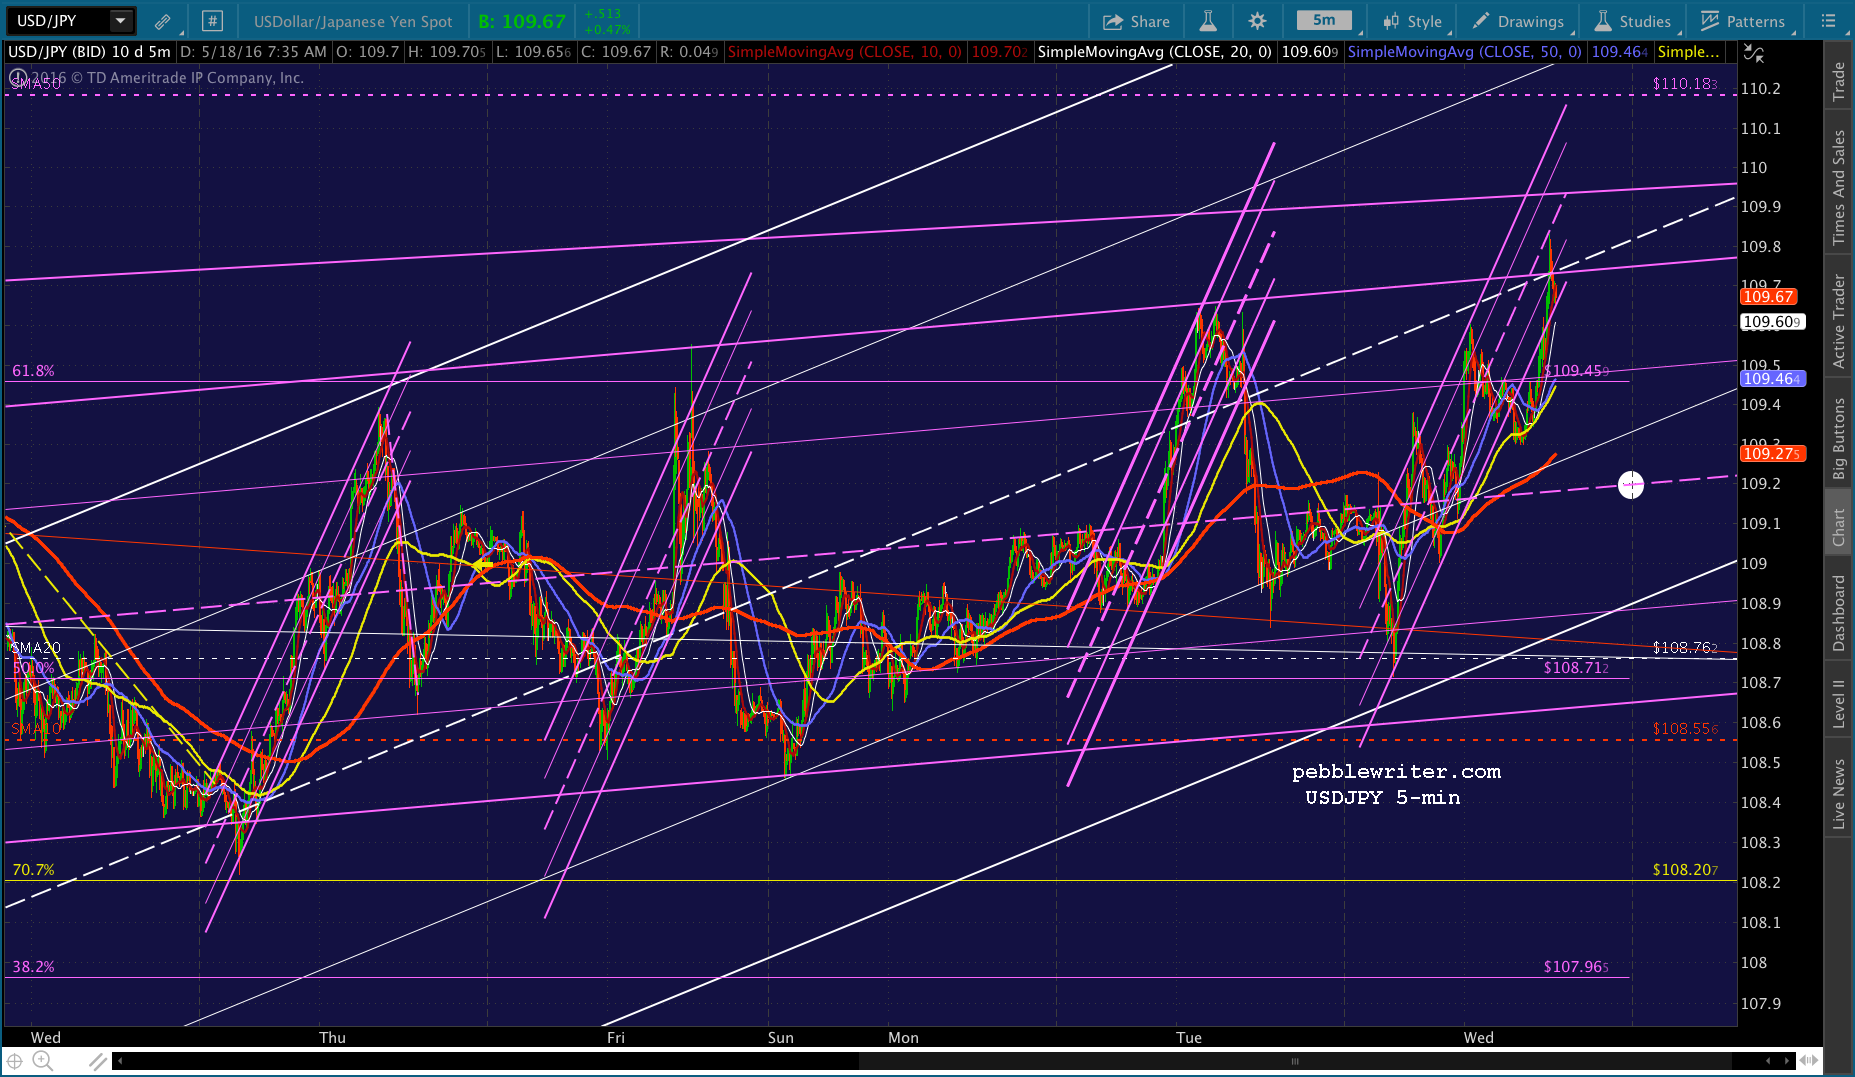 Some have asked me my expectations for the Fed minutes. With two FedPrez comments yesterday that the June meeting is “live,” meaning a rate rise is a possibility, I expect the minutes to have a negative effect — unless, of course, ES is able to complete its H&S Pattern first. One way or the other, I’m betting we get to ES 2032.25.
UPDATE: 12:22 PM
It appears to me that we’re going to get up to the SMA5 200 at 2057ish on a backtest of the rising wedge. I’d cut loose the short here if it pops through the SMA5 100 (2052.75ish) and hopefully pick it back up then.
 However, we’d still have the issue of ES’ SMA50 at 2051.86, which is what makes me think we’ve already seen the highs.
UPDATE: 12:54 PM
Seems inevitable here. Back to cash until this little drama is over. I’ll look to short again at 2057ish. UPDATE: 1:02 PM
Here’s the SMA50. Back to short here.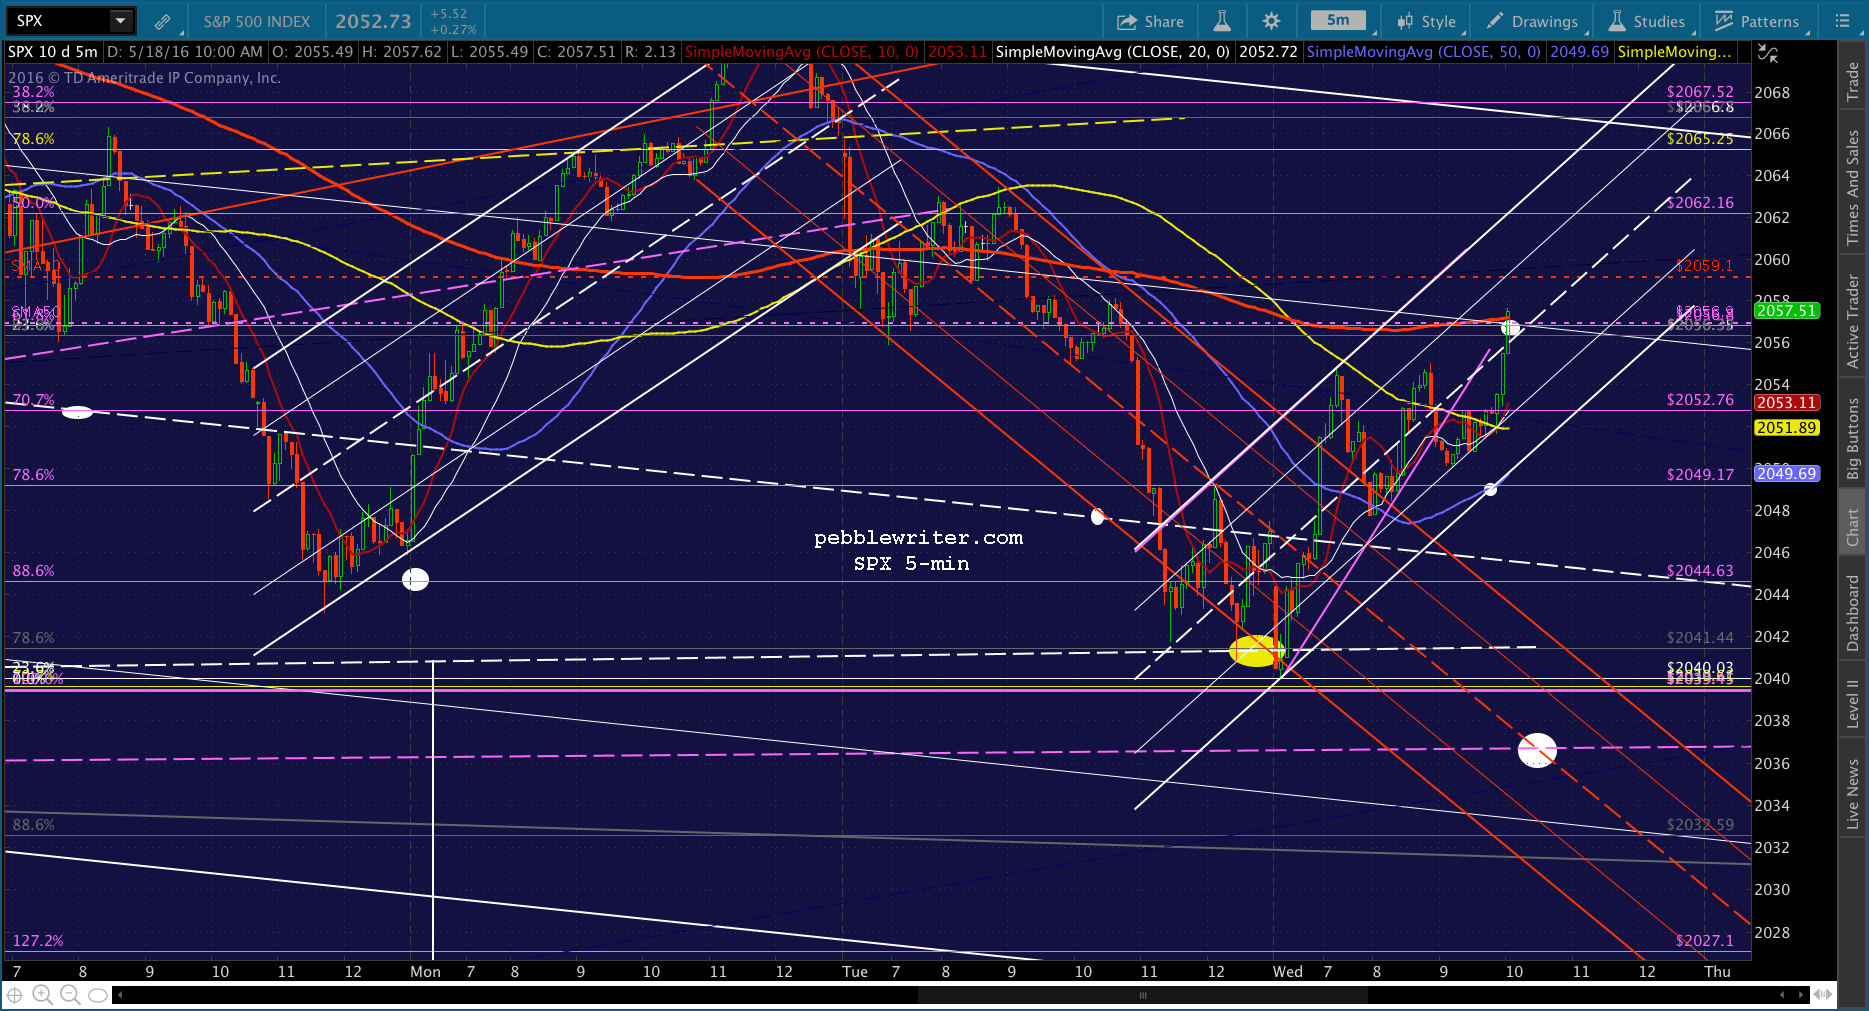
 UPDATE: 1:49 PM
It’s pretty clear at this point that TPTB have run ES/SPX up on VIX and CL alone. USDJPY has actually declined since 9:30, CL is barely higher, and VIX has reached support. Furthermore, ES has reached its falling white channel’s .786 line. This could obviously break either way, but my guess is they’ve run it up in anticipation of a decline. It could drop 20 points form here and still stay above yesterday’s lows. But, we’ll find out shortly.
I never recommend playing a long or short bet over a Fed event like this — at least not with money you wouldn’t mind parting with. It’s a 50:50 shot, a spin of the roulette wheel, and nothing else. Those of us who think they know what’s going to happen…don’t. For me, it’s as much a gut feeling as anything else, and these have been wrong on many occasions.
Trade safe, and don’t risk anything you wouldn’t bet on a roll of the dice.


 UPDATE: 2:08 PM
Here’s a good bounce point. Per VIX, the easy money is done.
 I think we’ll get another leg down, but that’s only 6-7 points below these levels, so not a bad idea to take some money off the table.
UPDATE: 2:13 PM
USDJPY just backtested the broken purple channel from 2011. Back to short here.
 The channel with the arrow next to it. The SMA50 is just above at 110.18, so the upside is limited.
 If VIX can punch through the midline, the downdraft should be swift.
 UPDATE: 2:32 PM
ES just reached its neckline. I’d cover here.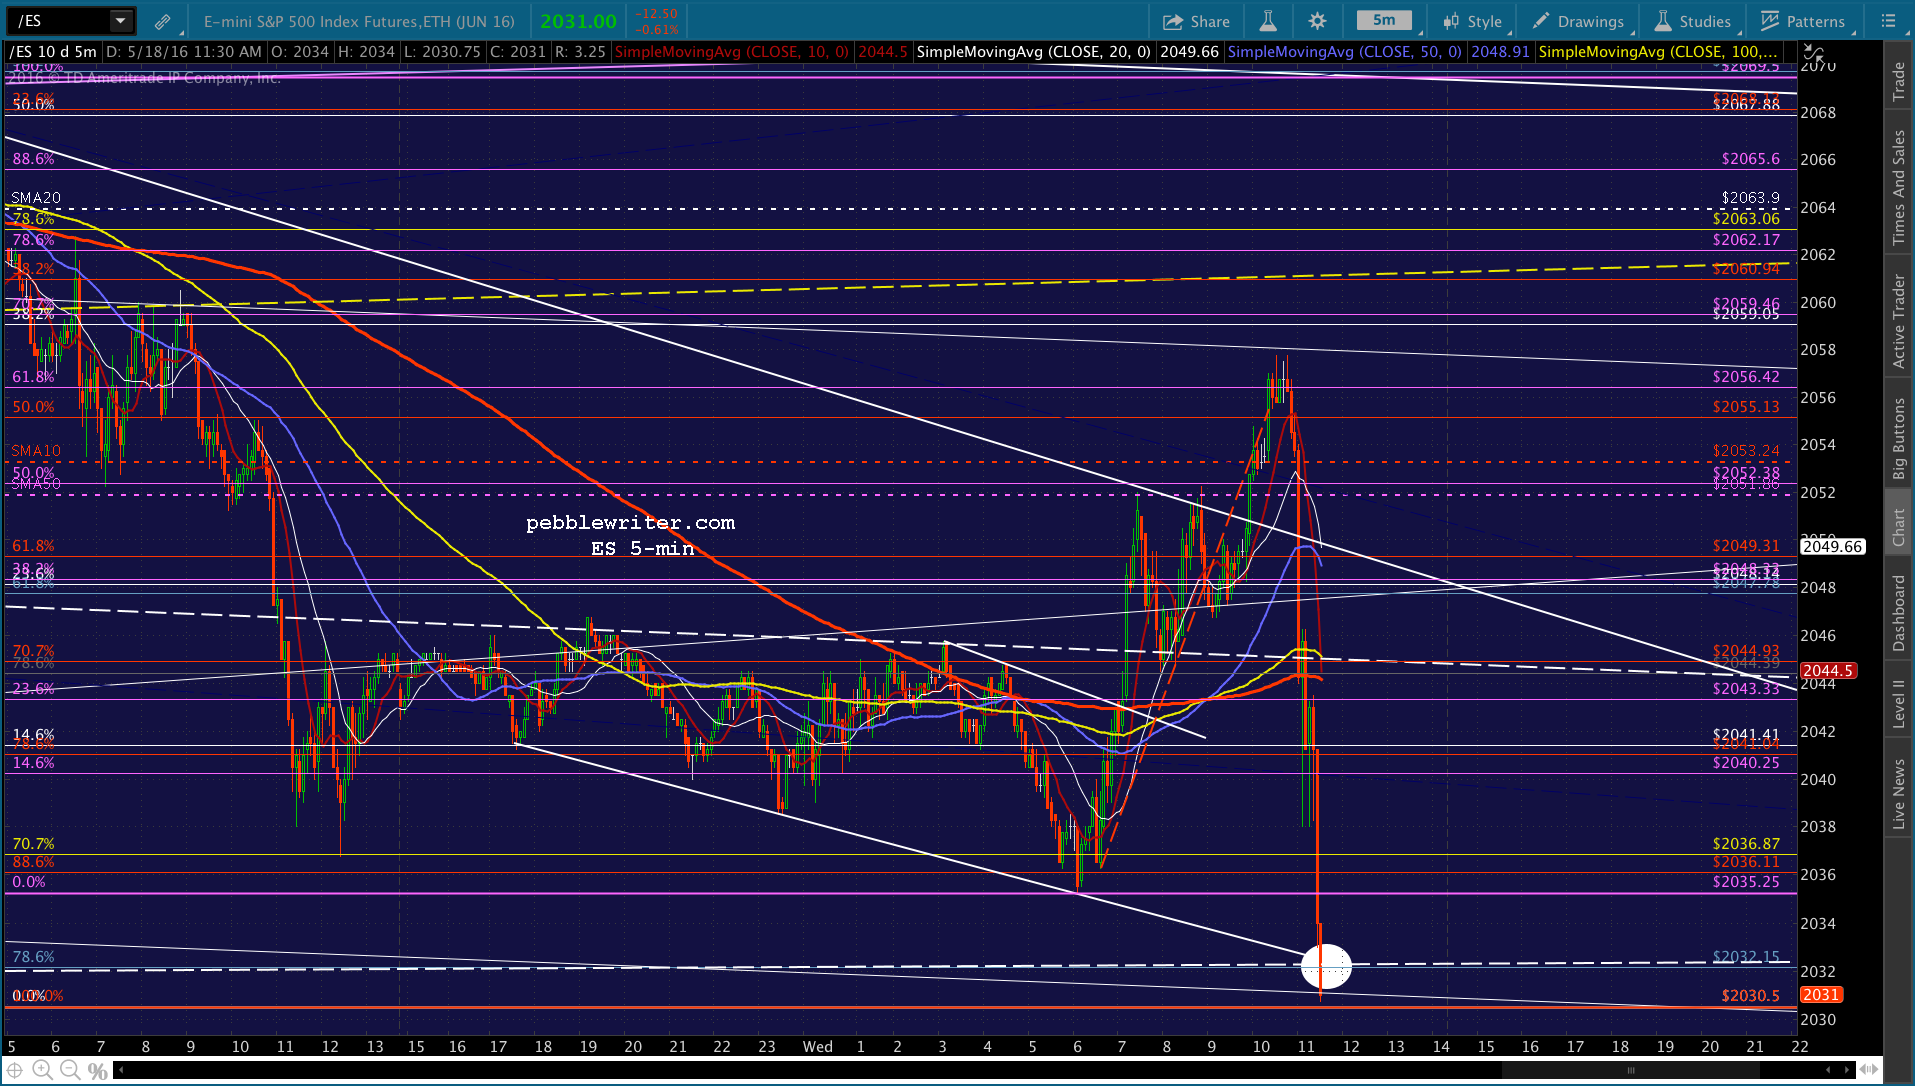
 UPDATE: 2:50 PM
Again, I think this should do it for the easy money on this bounce. It might push on past the midline, but no guarantees. I’d revert to cash here for the day.
Comments
3 responses to “Another Line in the Sand”
PebbleWriter, I am a little bit confused. Last week, we saw that the yellow H & S was formed. This still appears in your big picture chart of SPX today.
And this week, you identified a IHS on Monday and the right shoulder was formed yesterday.
So now, are we looking at H&S or IHS in SPX? I guess it depends on the outcome of Fed meeting? Thank you!
The little IH&S was busted by the drop into the close yesterday — which was lower than the head. The yellow H&S completed last Thursday. Then SPX popped back above then neckline on Monday, and back below on Tuesday. With the neckline up at 2067, it remains below it today. Now, we have an additional H&S Pattern in SPX (in white), whose neckline SPX tagged yesterday. But, I theorized that ES would also want to complete its own H&S Pattern down at 2032.25ish. Right now, with SPX melting higher, I could be wrong. We’ll find out. Much will depend on the Fed minutes.