NOTE: The following post has been updated with a new and expanded table of data. Please see the 6/8/11 update for additional details and analysis.
First, the ointment…
As discussed many times already, we took out the important 1294 level on SPX — establishing a significant new lower low at 1284.72. Significant damage has been done to the bullish case, and I think this significantly curtails the upside potential. We’ve fallen out of the rising wedge, and our downside target is now 1010.
Of course, there’s a fly…
SPX is tracing out a descending broadening wedge that should take prices back up tomorrow for at least a partial retrace of the past 4 trading days decline.
I did a quick study… In the past 900 or so trading days since the Oct ’07 top, we’ve only had 16 instances of 4 or more down days in a row. Put another way, the odds of having 4 down days in a row have been less than 2%. Of those 16, only 5 (about .6% of the total) lasted longer than 4 days.
On average, the days after the decline ended retraced 33% of the decline. Expanding the period to the next 3 trading days, the average retrace was 57%. Wouldn’t bet the farm on this, but combined with the descending wedge, it’s a pretty good argument for a rebound.
The study also shows that of those 5 times the signal failed (without a rebound on the 5th day), the 5th day declines were 2, 5, 5, 8 and 63 points (Oct. 7 ’08.) So, it succeeded 2/3 of the time — pretty decent odds for a short-term trade, particularly if one uses stops to protect the downside (remember, 63 points) if the signal fails.
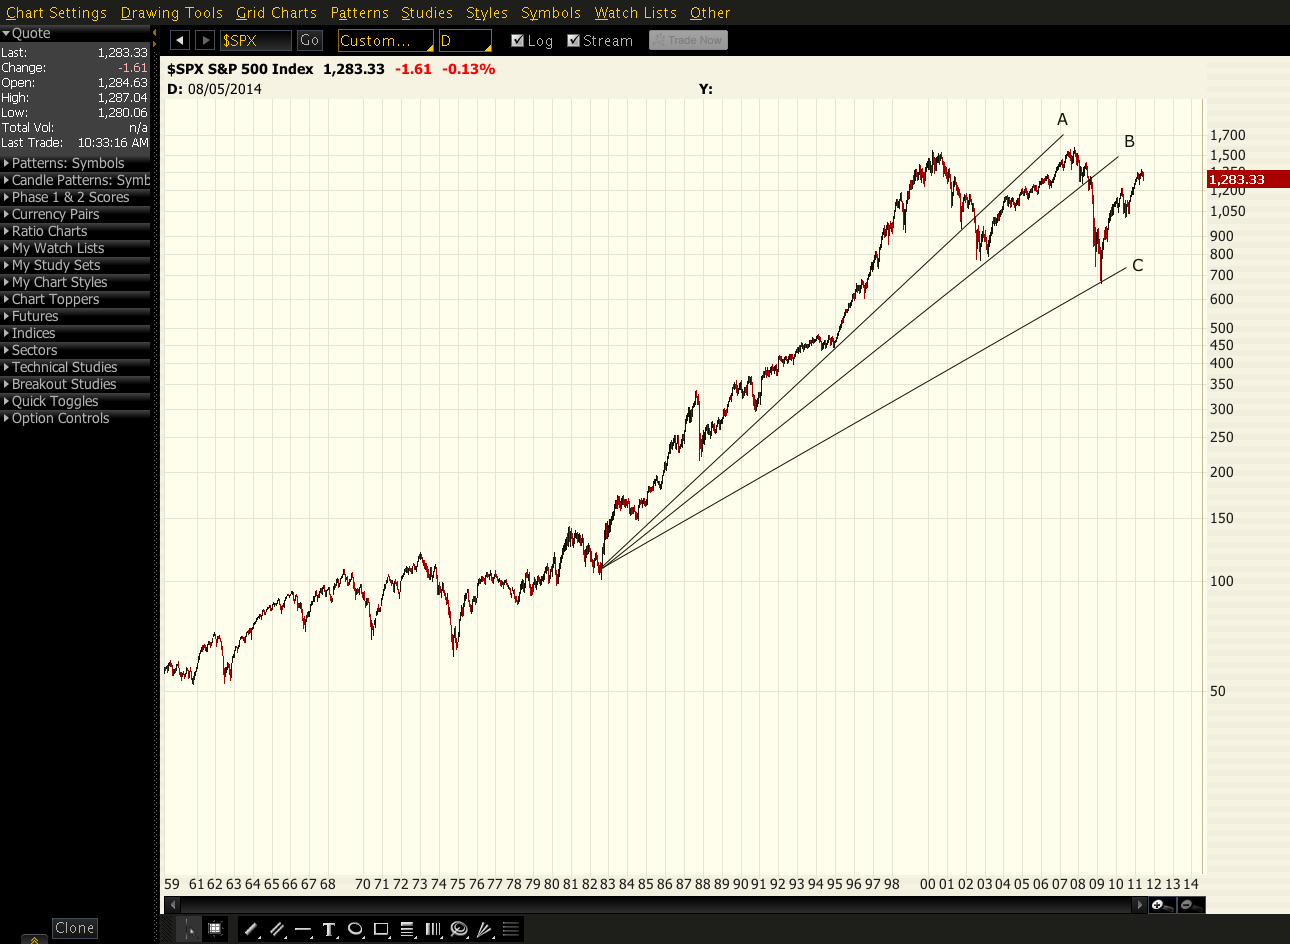
If we retrace 33% of the past 4 days, that would take us back up to 1305. A 57% retrace would result in 1319. I believe 1319 to be very heavy resistance anyway, as that marks the current level of the bottom of the rising wedge (since Mar ’09) and the trendline off the Oct ’07 high. As the chart above indicates, they actually intersect here — and I think we will backtest one or the other for at least a few days (as was done in Oct ’07).
If the signal fails, I see the next probable downside target as only 1278. There’s an important trendline there, and it marks the 1.21 extension off the 1370 high. After that…1250 and then on to 1228. Again, our ultimate target is the base of the rising wedge: 1010 or 666, depending on whom you ask.
We’re also nearly finished forming a bullish butterfly pattern, which in itself indicates a decent rebound. And last, but not least, the bearish H&S; has just about played itself out. My original target was 1287 — about our current level.
Looking out any further, lots more flies…
Are we in P[3] or not? I’ve seen pretty good arguments on both sides. It occurs to me that if we did bounce back up to the 1319 level, things might get even more confusing. Why?
If the downturn’s confined to current levels, things begin to look a lot like a channel — as shown by the dashed lines above. Talk about frustrating the bears… Might even get a few bulls excited (do ya’ think?)
This is where things get fun (or like water torture, depending on your POV.) P[3]? Minor 5? Who knows. But, I favor this outlook if for no other reason than it would produce the greatest number of arguments amongst Elliott Wavers.
Where do we go from there? IF the market plays out as expected, it’ll produce an outside shoulder to complete a complex H&S; pattern. The price target would be around 1228 (also the .618 fib level off the Oct ’07 highs.)
If you’ve been following my 87-day pattern at all [Sure, it Works in Practice], you know that the 1370 peak on May 2 came two weeks early (allowed under the rules.) Since then, we’ve declined 6.26%. If this is the cycle low, it would be within the range of past results.
Regardless, there’s another 87-day target date coming up. The original target date is August 11, but an early arrival (as happened in May) could bump it to as early as July 14. If the market does an about face here, I would expect any advance to be completed by one of those two dates.
I’m no longer focused on the rising wedge’s apex (September 12th), as we’ve officially fallen out of it. But, I fully expect the ultimate outcome (a strong retrace back to its origin, or 1010) to commence within the same time frame — if it hasn’t already.
Stay tuned.