UPDATE: 11:25 AM PDT
The market’s making it’s daily recovery attempt. The past two days, we’ve seen an 88.6% Fibonacci retracement of the previous day’s high. While the rally could run out of gas sooner, today’s 88.6% level is 1342.16. It would also mark the completion of a bearish crab pattern.
UPDATE: 9:50 AM PDT
I took a closer look at the Case-Shiller data and, as usual, the news isn’t as good as the talking heads would have us think.
First, note that the headline data of a 1% improvement refer to May vs April prices. So they don’t, for instance, reflect the most recent economic tick down that S&P;’s own chief economist reported yesterday.
They also don’t make allowances for the seasonal improvement in activity that occurs at the start of the summer. On a seasonally adjusted basis, the April to May price change was nil, compared to a .4% seasonally adjusted increase from March to April.
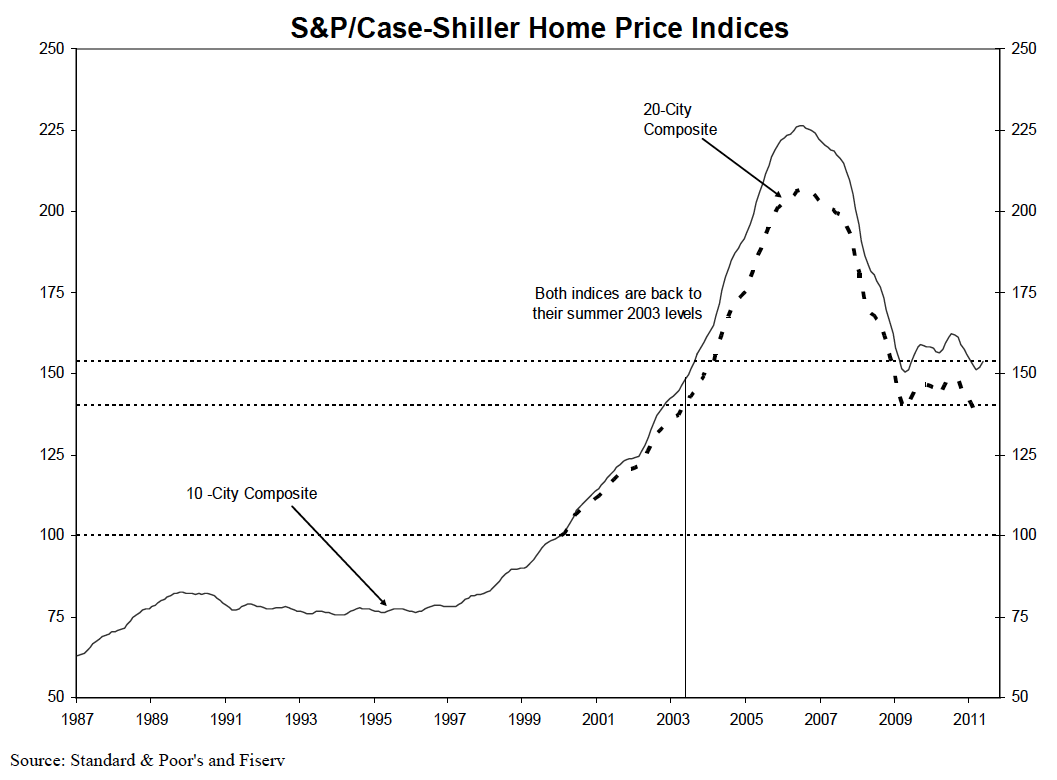
As the chart indicates, prices are back down to 2003 levels — bad news for an economy desperate for an uptick in consumer spending. And, the future doesn’t look any brighter.
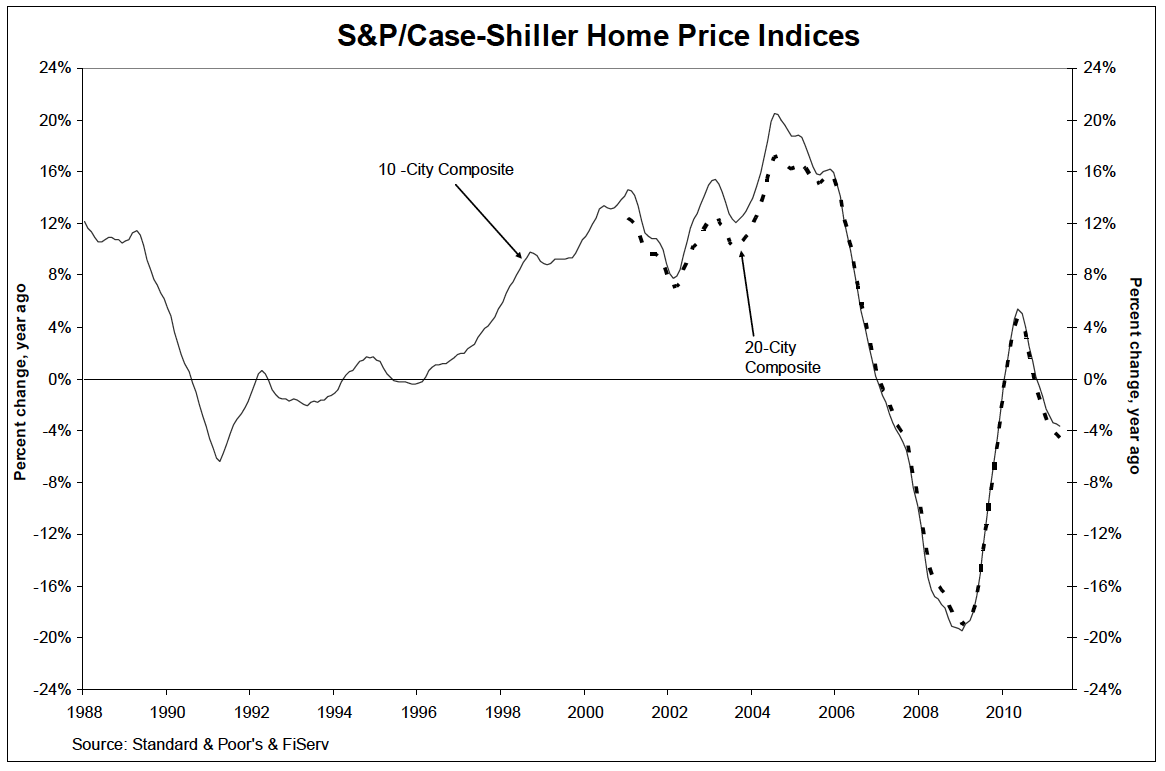
The 20-city year-over-year price change was -4.5%. This is worse than last month’s -4.2% and a continuation of the trend change that began in May 2010 when positive YOY increases peaked at +4.7%.
Last, S&P; also reports mortgage delinquencies. While delinquency rates for all loans remained at 8.3% in the 1st quarter, the subprime rate increased from 23.1% to 24% — a troubling reversal of the decreases in delinquencies we’ve seen over the past 3 quarters.
Quarter Rate ROC
2009/Q4: 25.3%
2010/Q1: 27.2% +7.5%
2010/Q2: 27.0% -0.7%
2010/Q3: 26.2% -3.0%
2010/Q4: 23.1% -11.8%
2011/Q1: 24.0% +3.9%
ORIGINAL POST: 7:00 AM PDT
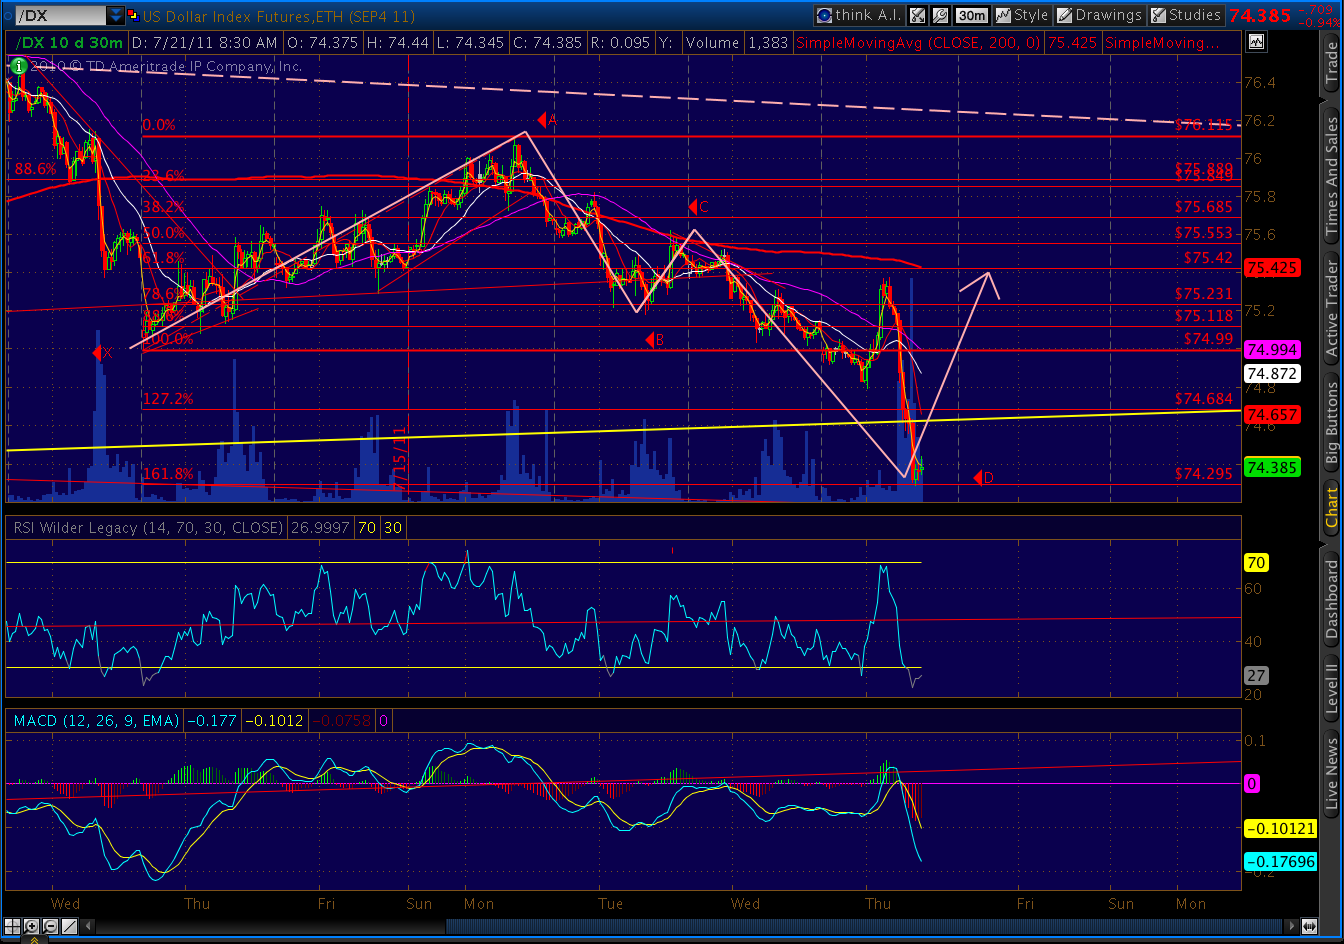
SPX is off 6, establishing a new lower low than the past several trading days, while the DJIA is off 87 thanks largely to earnings disappointments from MMM, BP and UBS. Oil is also tanking this morning, with CL currently off 1.05 to 98.15. The dollar’s still under pressure, with DX down .374 to 73.88.
Lots of economic news out this morning.
The Case-Shiller 20 city index was down 4.51%, worse than the -4.2% expected. New home sales fell 1% to 312k (versus expectations of 325k). And, consumer confidence came in at 59.5 vs last month’s 57.6. The “improvement” in confidence doesn’t look so hot when you read the actual report. First, note that the cutoff date for input was July 14, well before the debt ceiling debacle started receiving 24/7 news coverage. Also, from the report:
Consumers’ assessment of current day conditions weakened further in July. Those stating business conditions are “good” decreased to 13.4 percent from 13.7 percent, while those claiming business conditions are “bad” increased to 39.0 percent from 38.4 percent. Consumers’ appraisal of the job market was also less favorable. Those claiming jobs are “hard to get” increased to 44.1 percent from 43.2 percent, while those stating jobs are “plentiful” remained unchanged at 5.1 percent.
Similarly negative responses were seen with respect to job market and business conditions expectations.
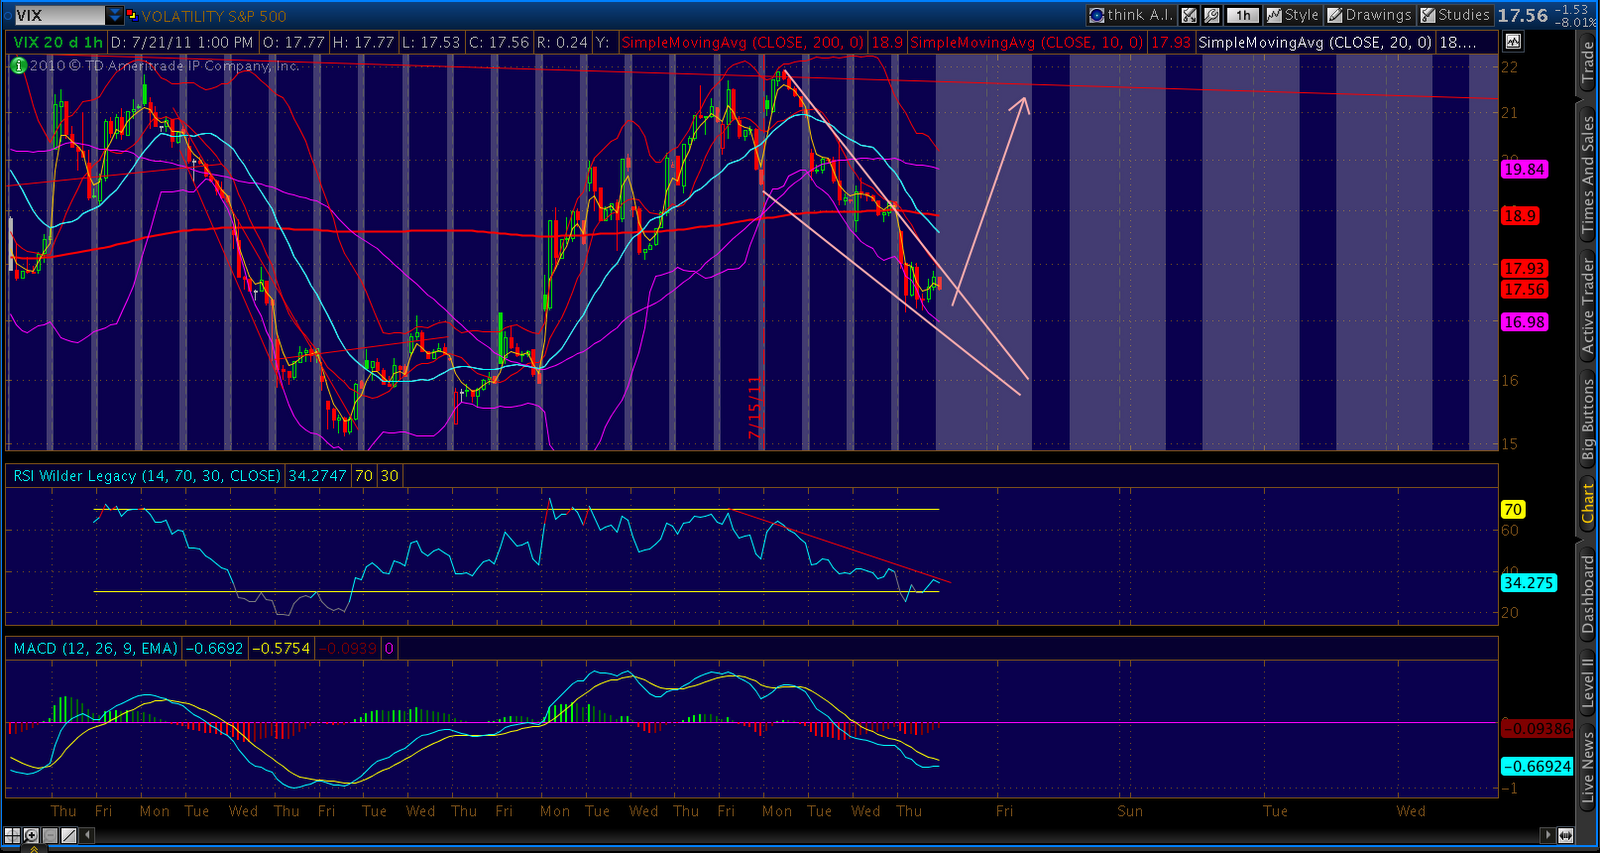
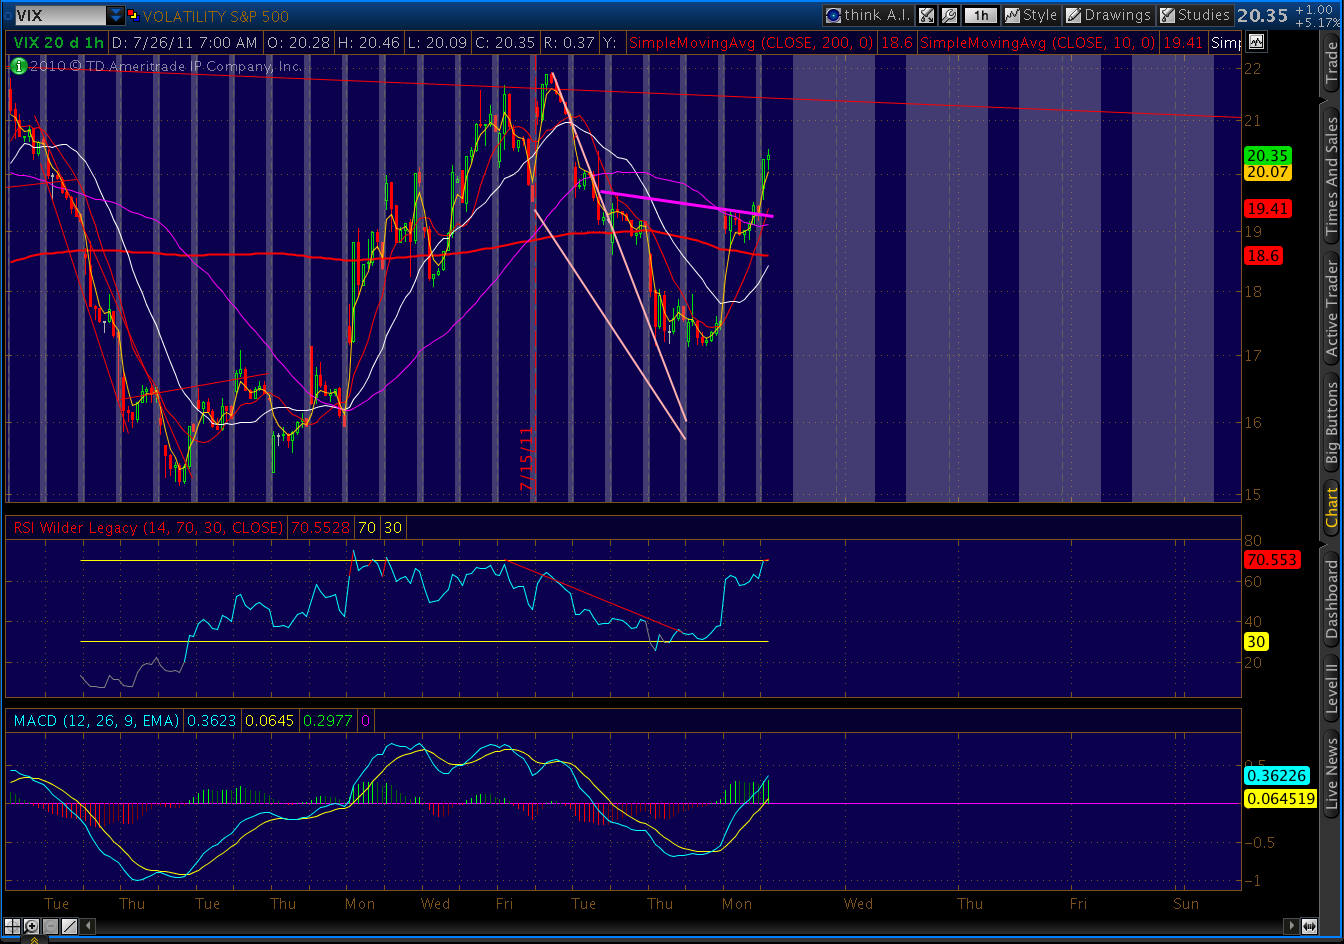
I’ve noticed a very sloppy little IHS completed over the past 5 days on VIX. I hesitate to mention it because it’s so poorly formed, but I’m often surprised by how well the ugly ones perform. It indicates an upside target for VIX of 21.66 — bearish for the market.
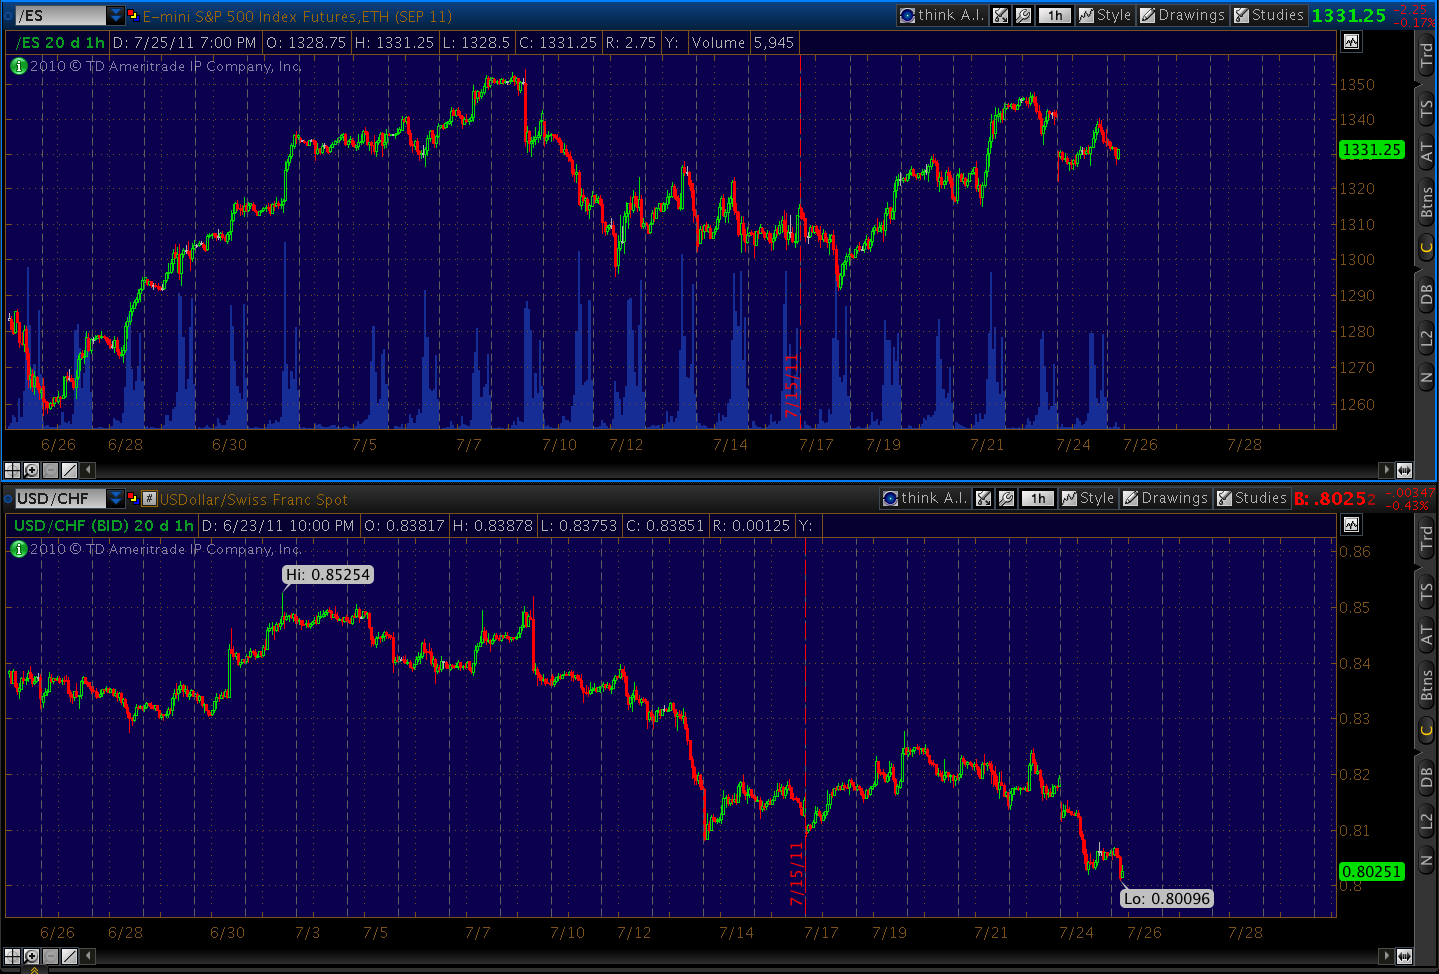
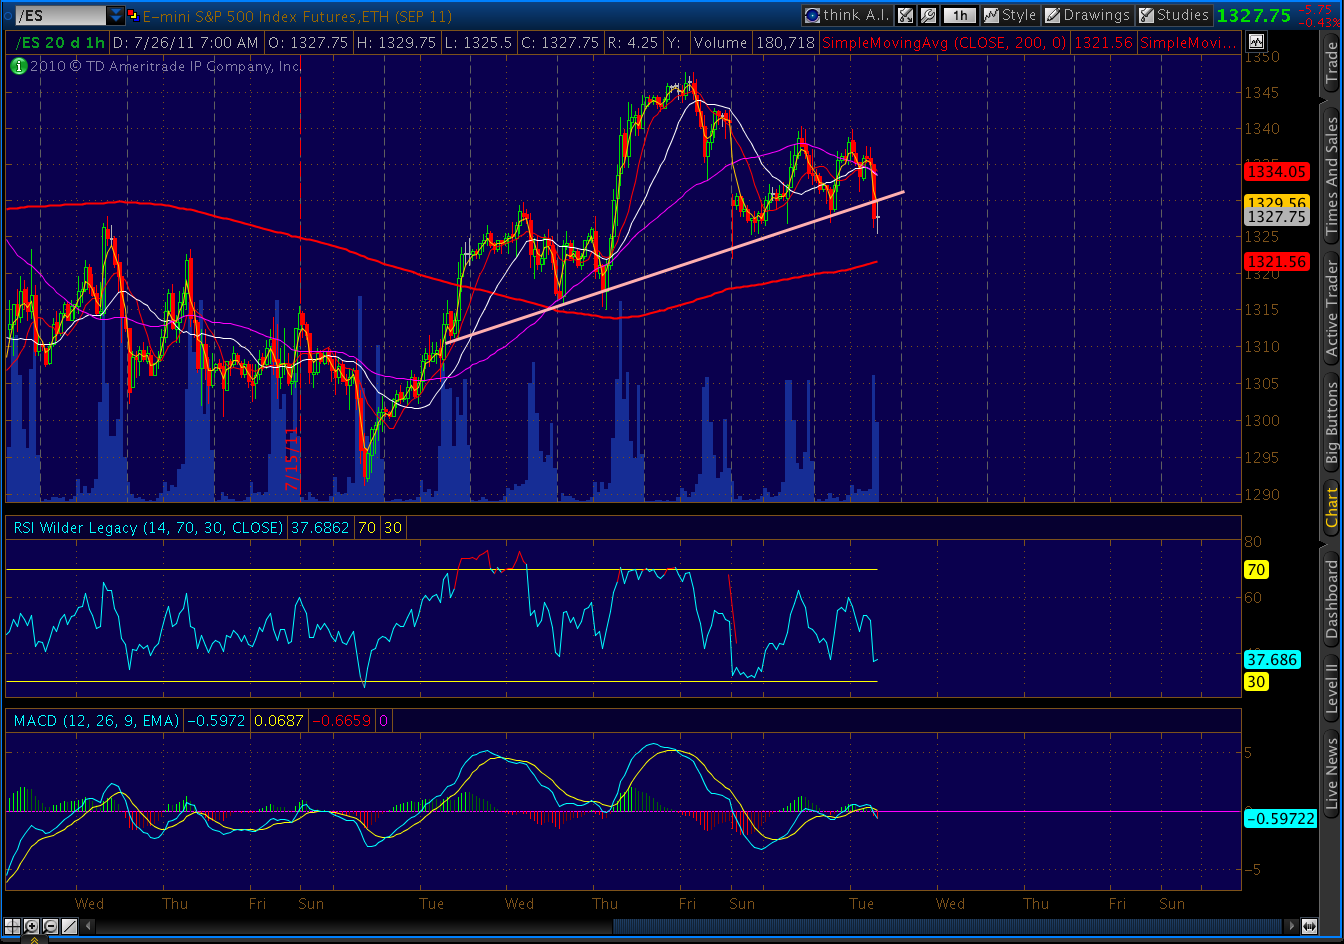
It correlates nicely with a traditional H&S; pattern on S&P; 500, seen best in the E-mini…
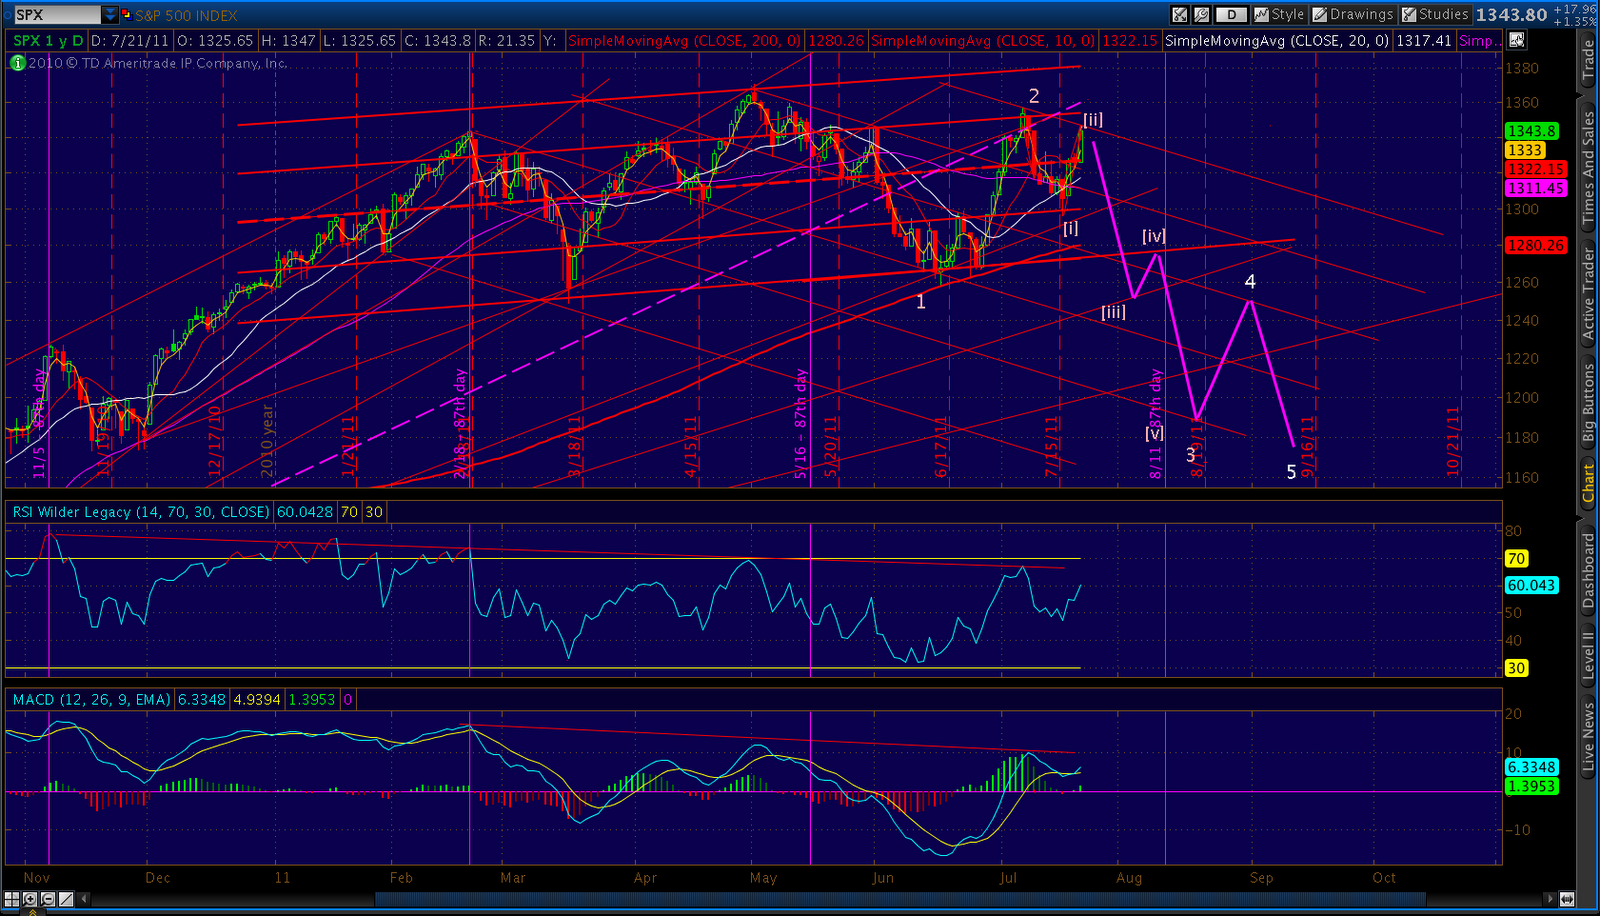
…and, here on SPX.
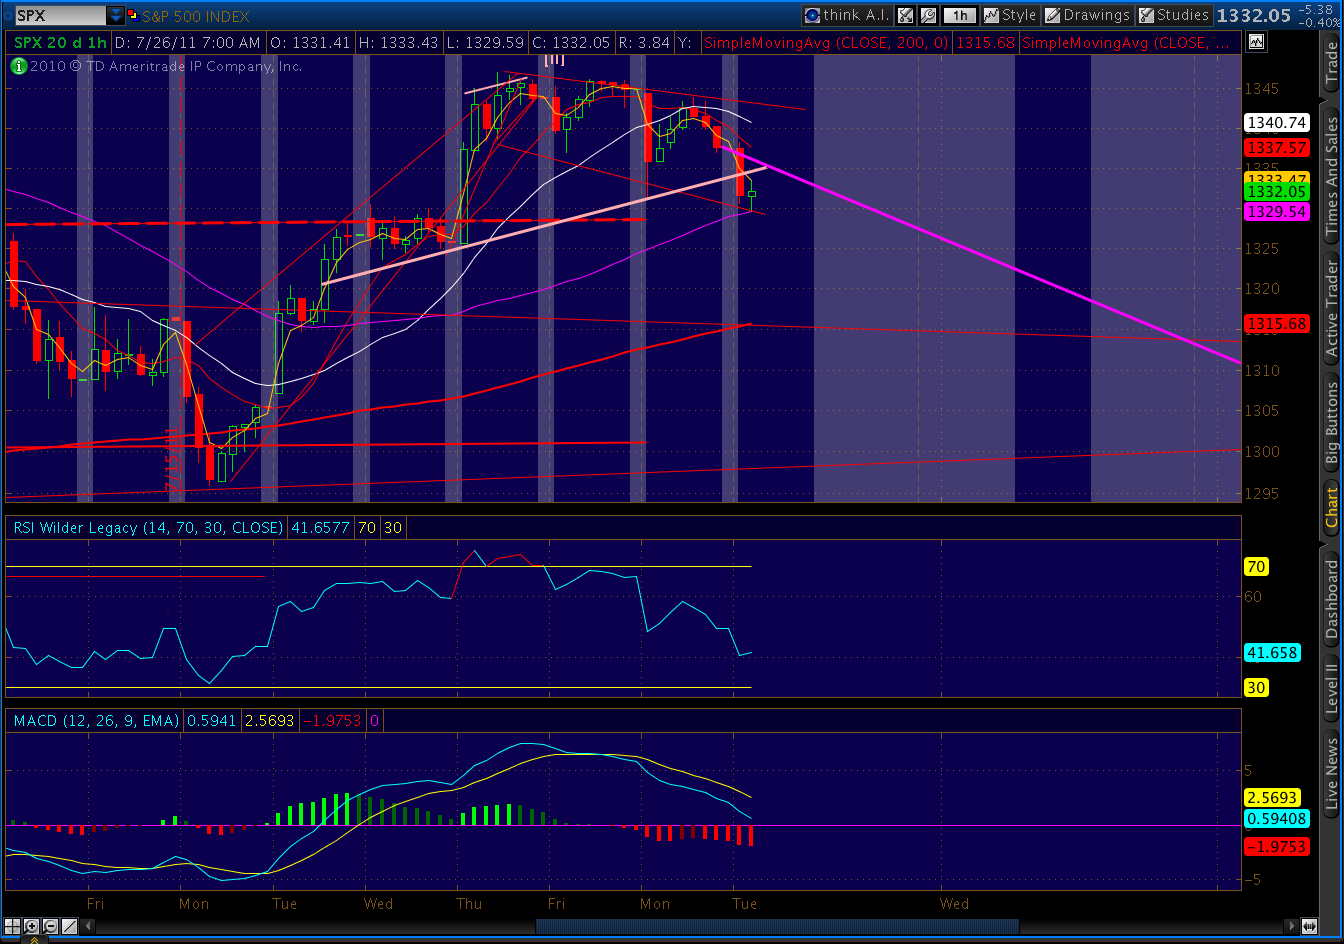
Downside targets should be about 1313 on SPX and 1303 on ES. Although the markets will have to work through the regression channel midline, just ahead at 1328, and the 10 and 20 day moving averages at 1325.92 and 1326.54 respectively.
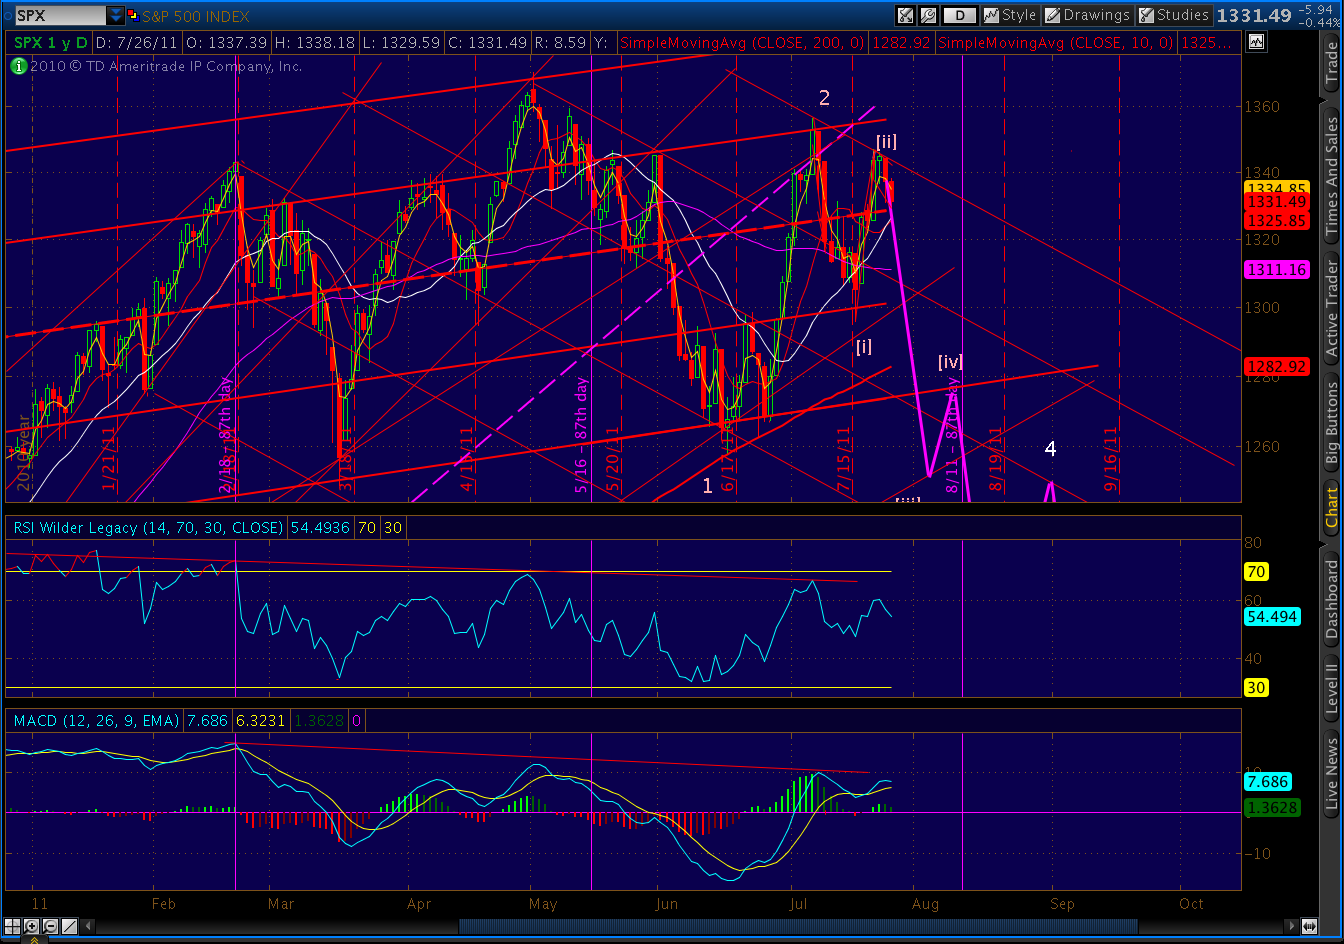
Thus far, we’re right on track with projections (the purple line.)