UPDATE: 11:30 AM
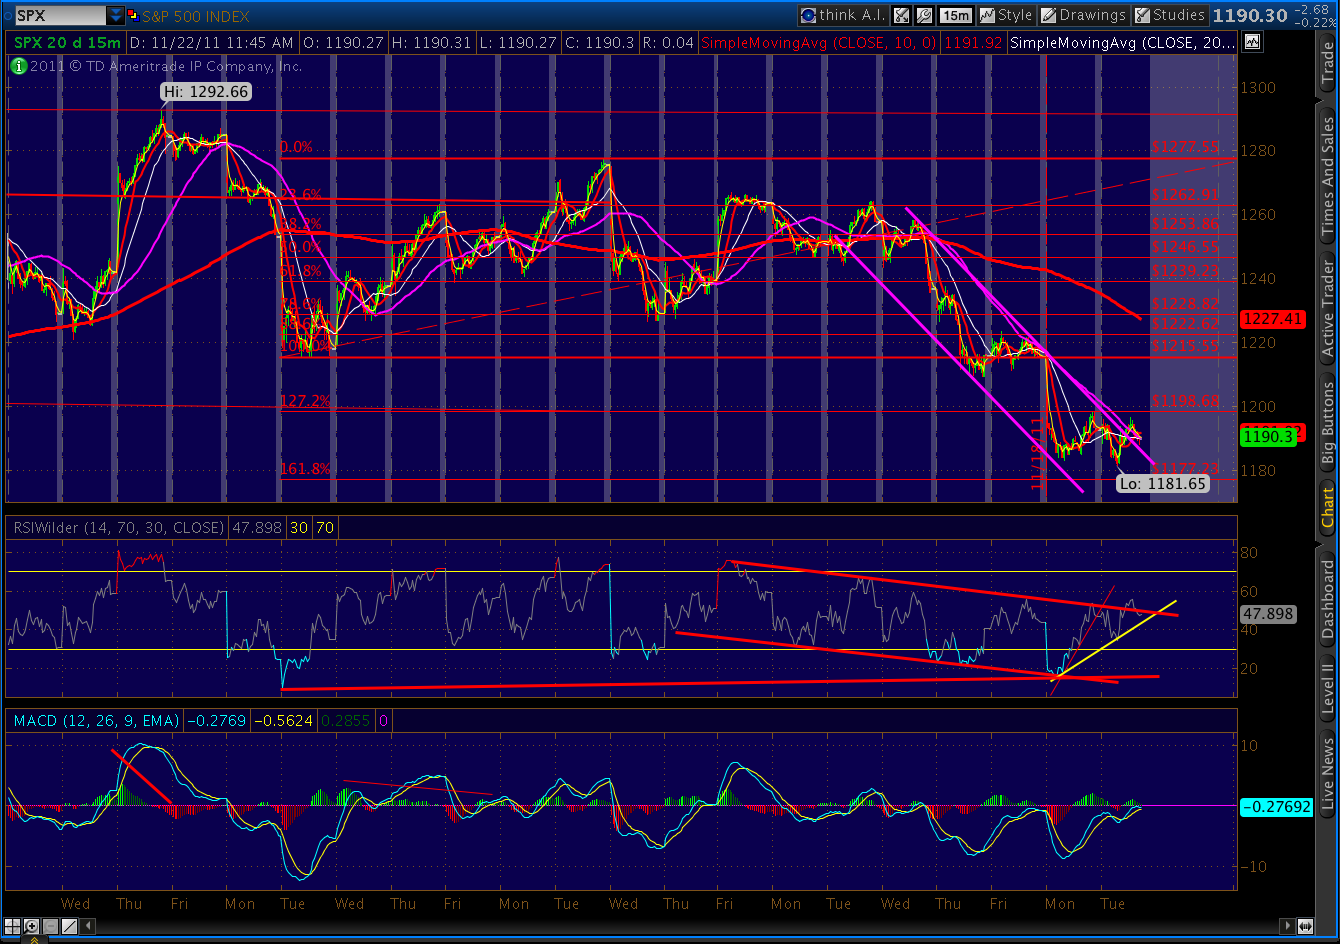
The futures held the 1.618 line of 1167 until about 20 minutes ago, while SPX’s opening sliced through its 1.618 at 1177 like a hot knife through butter. Now at 1164, is the rebound idea dead?
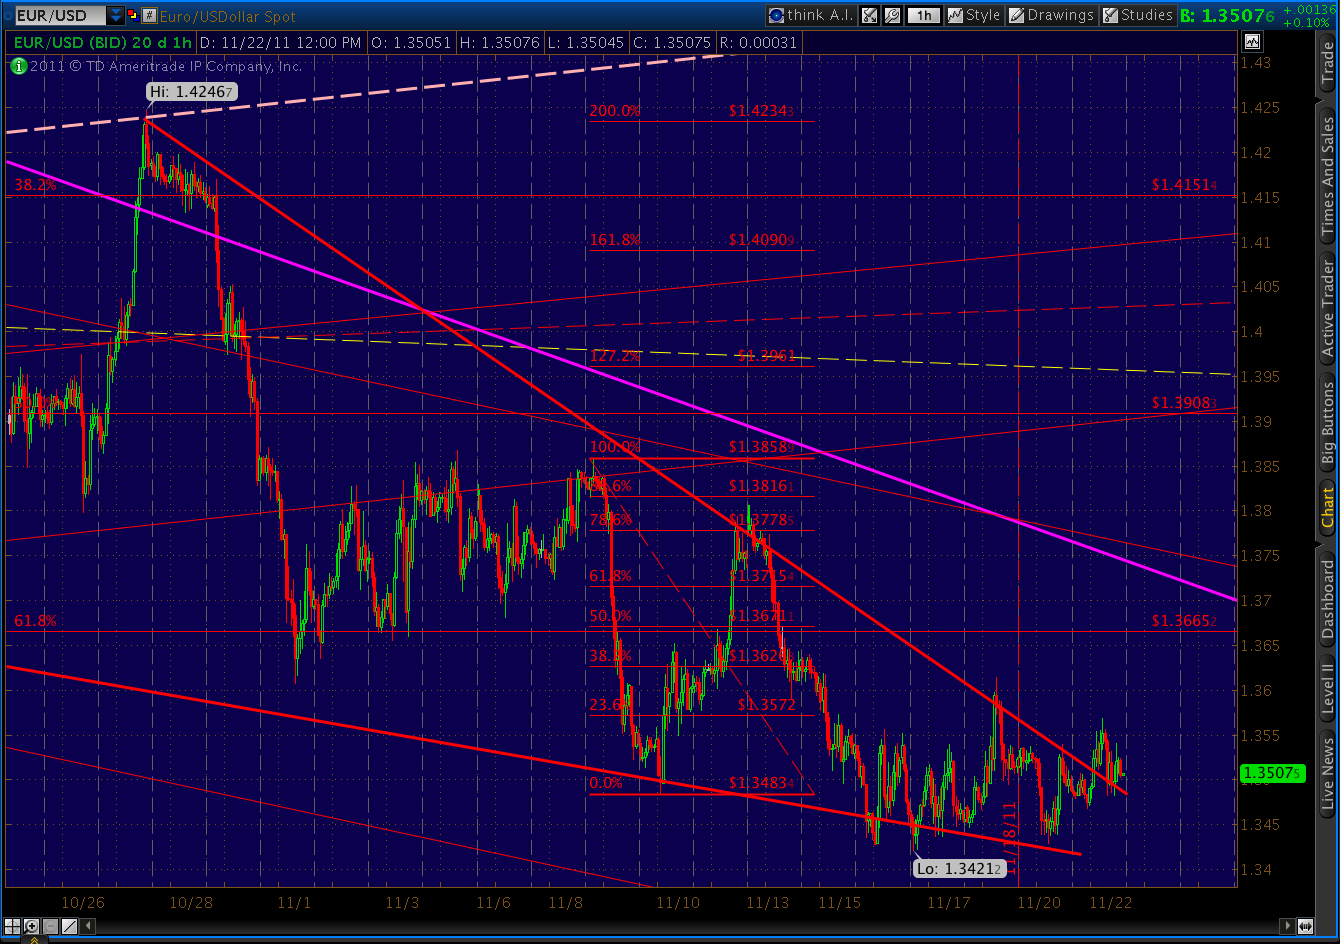
EUR and DX are both pushing the bounds of their respective wedges (and Gartley’s). If stocks are to rebound, we need a reversal right here, right now. There aren’t any good harmonic supports at these prices, but there are a fan line and trend line worth taking a look at.
Note the regression channel in the 2007-8 time frame. It perfectly captures the highs and lows of that top. I constructed some trend lines with the exact same slope and laid them over the 2011 top, connecting important highs and lows over the past year. The slope is important, because it lends credence to the notion that these lines are legitimate, rather than the product of my bias.
The two lines have thus formed a channel, the centerline of which is drawn as the dashed line. It’s worth noting that this centerline did a number on the Mar 16 decline, but was exceeded by the wild swings we saw in August and September.
Today’s plunge has paused right at the centerline, which might be significant. It has also reached a fan line drawn off the Mar 09 lows through the Aug 9 low. Either or both of these lines could act to arrest a further decline, but there’s no reason they have to.
In short, the case for a rebound is hanging by its fingernails. If either of these lines fail, there’s not a lot of support until 1115 (horizontal), and then 1100 (fan line off the Oct 4 low and also the .886 Fib.) Keep an eye also on the positive divergence on the 5, 15, 30 and 60 min charts.
ORIGINAL POST: 1:05 AM
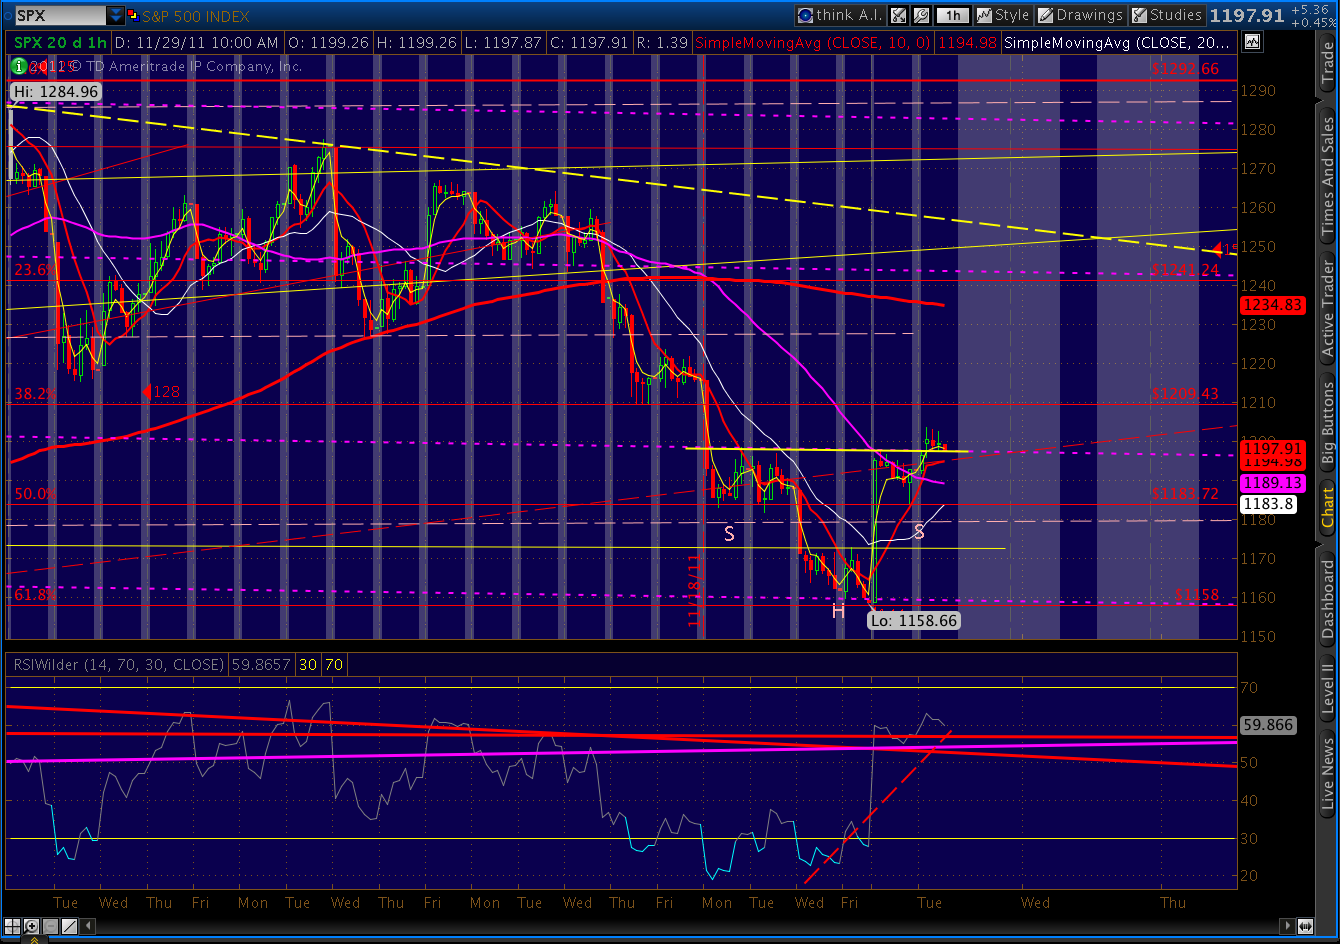
Just completed a perfectly-formed bullish Crab pattern on the futures at the 1.618 extension of 1167.25.
Yesterday, SPX came within 4 points of completing its own Crab (1181 v 1177.) So, it could be considered to have completed (96% of optimal AD.)
On the other hand, SPX closed at 1188 today. If the current decline in the futures market (-13) were to hold overnight, that would result in a more precise Crab pattern completion in the 1177 area — a gap down that immediately reverses if the pattern were to play out.
If the SPX Bat pattern plays out, the most common potential targets (depending on which Point D is valid) are:
1.618 — 1340
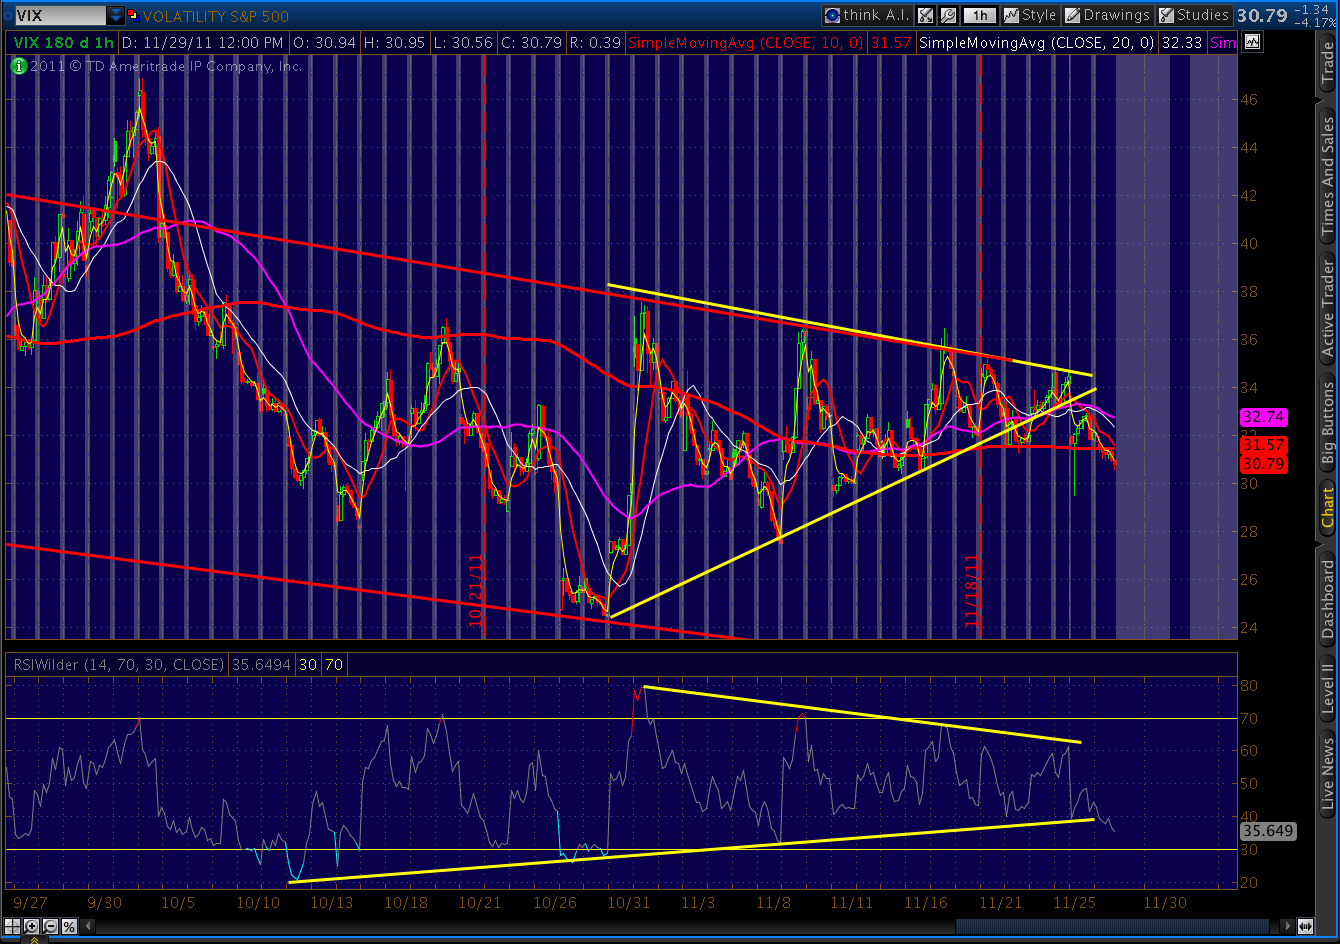
As mentioned yesterday, EUR/USD is very deep into a falling wedge and DX is very deep into a rising wedge. AUD/USD is also very deep into a falling wedge. Combined with the above patterns, conditions are ripe for a reversal of the past week’s weakness.
Does that mean the bear isn’t playing out yet? Not at all. In my opinion, there’s still at least a 50% chance that 1292 was the high and we’re on our way to huge losses. However, the flip side of that 50/50 equation is the possibility that wave 2 isn’t quite done.
It’s days are numbered, though. If it’s going to happen, it has to be pretty much immediately. So, be careful. Needless to say, a 100+ point rally between now and December 5 would trap an awful lot of bears.
Of course, if we get a garden variety .618 reversal up to 1239 or so, we’ll have a very nice spot at which to add to existing shorts. Such a move, BTW, would tag a TL off the Oct 27 (1292) and Nov 8 (1277) highs.
**************
Looking at the big picture, there is a possible road map taking shape on the daily chart.
The only problem is that this Harmonic pattern is neither fish nor fowl. It reverses at the .786, which would indicate a Butterfly pattern. That would also imply a completion at the 1.272 at 1433 or the 1.618 at 1530. I don’t consider either of those targets as even remotely possible at this juncture.
Bat patterns complete at the .886 Fibonacci, in this case 1324, which would also be in line with a trend line off the 1370 top through the Jul 7 high. But, Bat pattern points B aren’t supposed to exceed .618 of the XA distance. The .786 we see here should disqualify the pattern.
Another way of looking at it is the place Point X at the 1370 May 2 high, which results in a Point B at a little higher than the .618 Fib — making it a Gartley that completes at a .786 Fib — in this case 1307.
Of course, there needn’t be a harmonic pattern at play in order to identify a reversal target. Wave 2’s often retrace to the .618, .786 or .886 Fib levels. While the .618 ship has sailed, .786 and .886 in the 1307 – 1324 range are valid targets.
It’s also worth noting that the original Gartley pattern, first introduced by H.M. Gartley’s Profits in the Stock Market (1935), made no reference to specific Fibonacci levels. They’ve been added over the years by practitioners. In the meantime, patterns that don’t quite fit the mold, but which are based on common Fibonacci levels, can and do play out all the time. We’ll eventually find out what’s going on here, but for now we’ll just have to wait and wonder.