UPDATE: 11:45 PM
Very strange day in the markets… Earlier this morning I posted:
Worst case scenario for the bears is yet another false breakdown that bleeds off positive sentiment and overbought conditions, allowing a further melt up.
What did we get? Another false breakdown that bled off positive sentiment and overbought conditions, setting the stage for the melt up to continue. Really gotta learn to keep my big mouth shut!
It doesn’t bother me to have made a small gain on the day. It’s just that the reversal was, IMHO, another completely bogus move — made possible by a few rather lame news items on pathetic volume.
Pending home sales are up? Really? Check out the actual numbers published by the Realtors (as if they could possibly be taken seriously…)
Jan 2012 was up 2% from December, 8% from Jan 2011. As I always say, though, ignore the seasonally adjusted numbers. “Seasonally adjusted” is simply another term for “manipulated.” These people, even more so than most of the outfits who publish economic data, have an agenda. They want us to believe the real estate market is better. If we do, we’ll buy more homes, and they’ll get to keep their phoney baloney jobs, gentlemen. Hrumphhh.
The real numbers are labeled “not seasonally adjusted.” If we are to believe their raw data, January 2012 pending sales were indeed higher than December 2011, at 78.2 versus 63.8. But, the index was still lower than any other month in the past year — going all the way back to Jan 2011.
Wait, you say, index? What index? Oh, yeah… these numbers aren’t actual reported contracts on homes, but an index derived from a survey of 100 MLS’s and 60 large brokers — all of whom also have an agenda. An index of 100 relates to the average level of contract activity from 2001; so an index of 78.2…still pretty much sucks.
Then, there are the issues of quality of sales (foreclosures/REO versus traditional sales) and the lovely little ramp up in foreclosure activity just getting underway.
BTW, there’s a great piece over at Naked Capitalism on the scam foreclosure “fix” being offered by the OCC. Check it out.
UPDATE: 1:00 PM
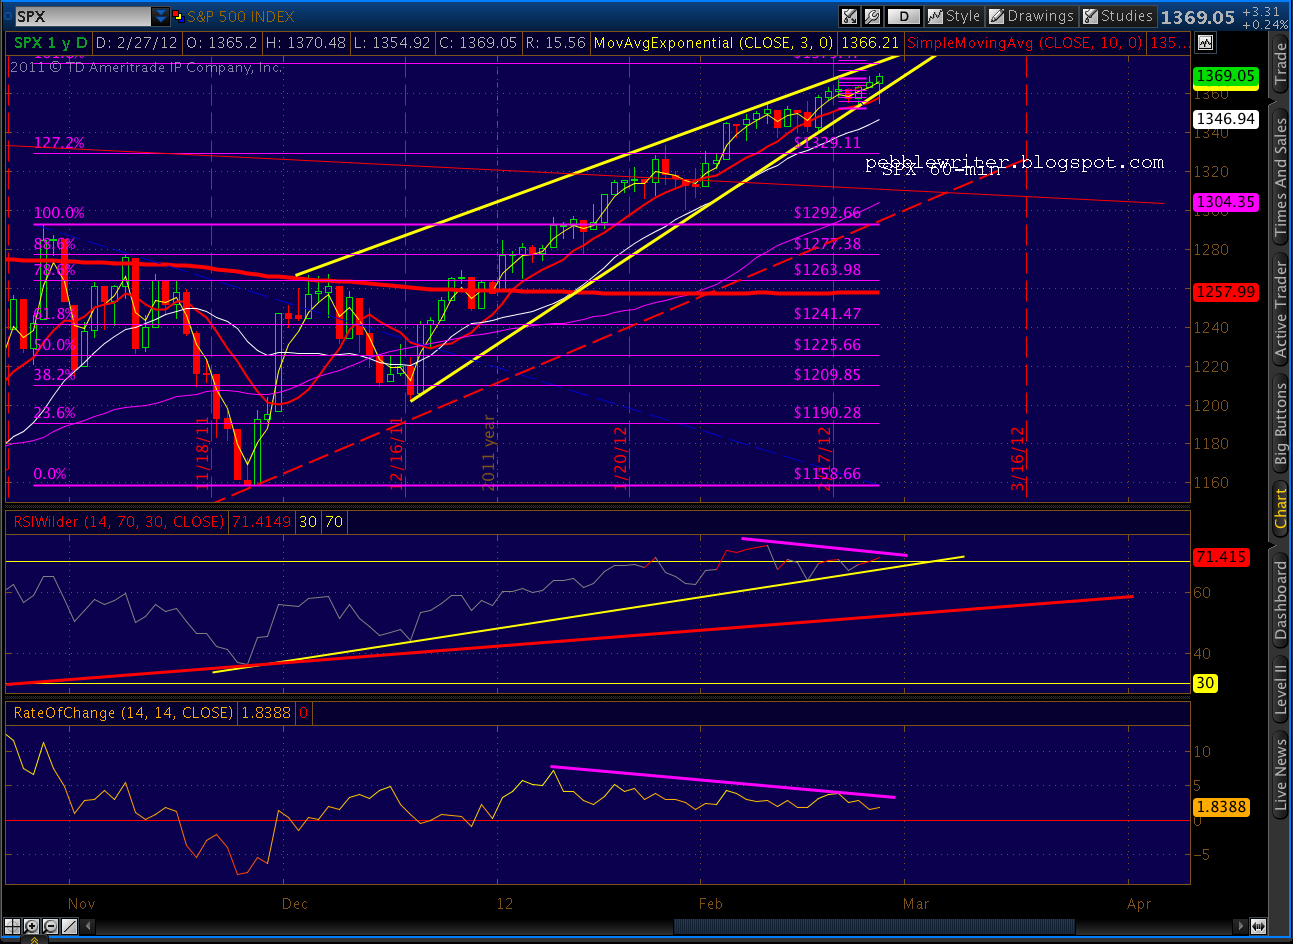
SPX up 4 on the day, 15 pts off this morning’s lows at 1370.48 for the day’s high. For anyone watching, this puts us only .10 way from where we started in May.
Now, like then, we have negative divergence on the daily and hourly charts — the purple TL on the RSI — and MACD that looks like it really wants to roll over.
The rising wedge, normally so reliable, managed to widen a little with this morning’s head fake. As I’ve discussed several times lately, these normally reliable patterns have been redrawn many times over the past two months, with dips that fail to follow through to the downside.
The net effect, however, is a gradually decreasing slope to the melt up — meaning that over time we will get to the top of a hill. The rate of change graph illustrates this phenomenon pretty clearly.
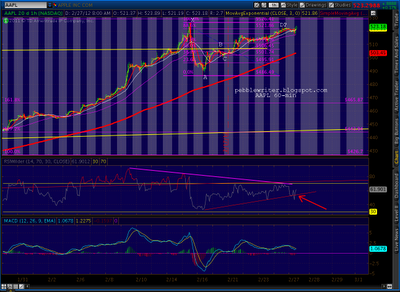
We got a double top on AAPL to go with the one on SPX — tagging the RSI TL on the 60-min chart as we discussed earlier. I’m putting on a little position (5 Mar 510 puts @ 5.95) in our portfolio with the intention of bailing on any follow-through to the strength, or adding to a pullback. I’ll put in a tight stop just above the previous high.
UPDATE: 11:45 AM
German Parliament approved the latest Greek bailout package. Markets reacted by soaring .00001% higher.
UPDATE: 10:45 AM
Closed out the rest of the AAPL puts on the break of the 60-min RSI TL — evidence it was more than a back test. Took a small loss on these, leaving me up about 1.1% on the day.
 |
| Before |
|
 |
| After |
I would be tempted to take the long side, but that purple RSI TL coming down off the recent highs is bothersome. From the looks of it, it’ll be tagged within the next couple of hours and could serve as another reversal point — probably marking at least a double top. The daily pattern shows no signs of a reversal, despite the fact that we’re well overbought and operating in nose bleed territory.
With SPX back in positive territory, I’ll look for new entry points with lots of dry powder. I don’t usually
UPDATE: 10:05 AM
The decline, which seemed to be pretty solid just after the opening, is fizzling. We saw a good bounce off the 60-min RSI, and haven’t seen the rising wedge break just yet. Worst case scenario for the bears is yet another false breakdown that bleeds off positive sentiment and overbought conditions, allowing a further melt up.
I closed most of my shorts, scalping an overall 2% daily gain on the portfolio — leaving half my AAPL position just in case the bounce is just a back test. BTW, AAPL is just a way for me to take the contrary position on the market’s overbought condition. I’ll jump back in if it appears we see a more significant break with a completed back test.
ORIGINAL POST:
On Friday, I constructed a $100,000 portfolio to track the actual trades I had been making. It doesn’t reflect my cost basis in my existing position, but it’ll allow us to follow specific positions on an ongoing basis. I’ll generally limit individual names to 5% or less of total equity.
This portfolio will be growth oriented, but significantly less aggressive and active than my usual trading style. I will utilize ETFs heavily, and options less so — so I have some adjustments to make. I’ll rarely put on anything that looks like a fixed income instrument, unless there’s a price move I’m trying to capture. I’ll try to update it daily with targets, stops and the like as appropriate and will post trades as they occur.
I continue to hold a short bias, with small put positions on AAPL, MSFT and SBUX, calls on VXX, a short position in GLD and a small spread on SPY. Current positions include:
- 10 AAPL Mar 510 puts @ 7.5
- -25 GLD ETF @ 172.13
- 25 MSFT Mar 32 puts @ .88
- 25 SBUX Mar 47 puts @.49
- 5 VXX Apr 20 calls @ 5.20
- 20 SPY Mar 136 calls @ 2.16
- -20 SPY Mar (Wkly) 136 calls @ 1.42
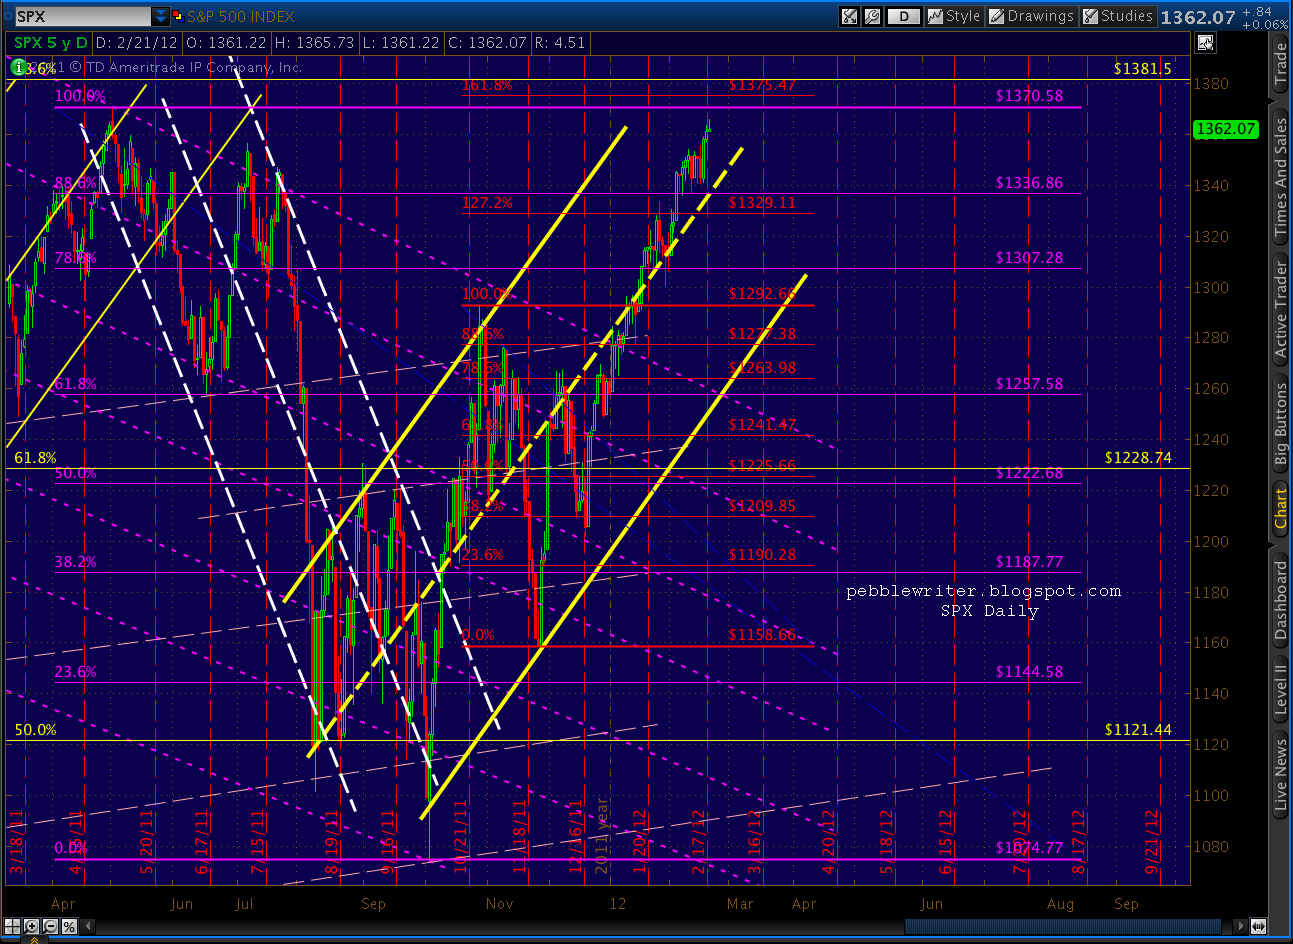
It’s a fairly non-committal portfolio at the moment – almost 90% cash. While I am still bearish on the market, I’m waiting for more confirmation before diving in more aggressively — particularly on SPX. A broken rising wedge would be a good start…
I’ll try to post charts on each of these positions throughout the day as time permits. My first task is to make a decision on gold. The daily chart is showing significant negative divergence, but the 60-min chart is threatening to break out of the little channel it’s been in. More later.
SBUX daily RSI broken trend line.
AAPL 60-min RSI broken TL and reversal off the .886 on the Bat pattern.
More later.