When Wells Fargo CEO John Stumpf sleeps, he dreams — like all good bankers — about numbers. He probably doesn’t dream about the number 600 — the number of foreclosure packages signed each day by his robosigners. He probably doesn’t dream about 14,420 — the number of conveyance claims fraudulently submitted to HUD in exchange for $1.7 billion from the FHA [Inspector General report.]
And, he almost certainly doesn’t dream about his share of the laughably small $25 billion penalty he and his fellow bankers might have to pay to slough off legal liability for the millions of Americans they’ve helped make homeless (don’t know why they’re bellyaching…they’re all getting $2,000!)
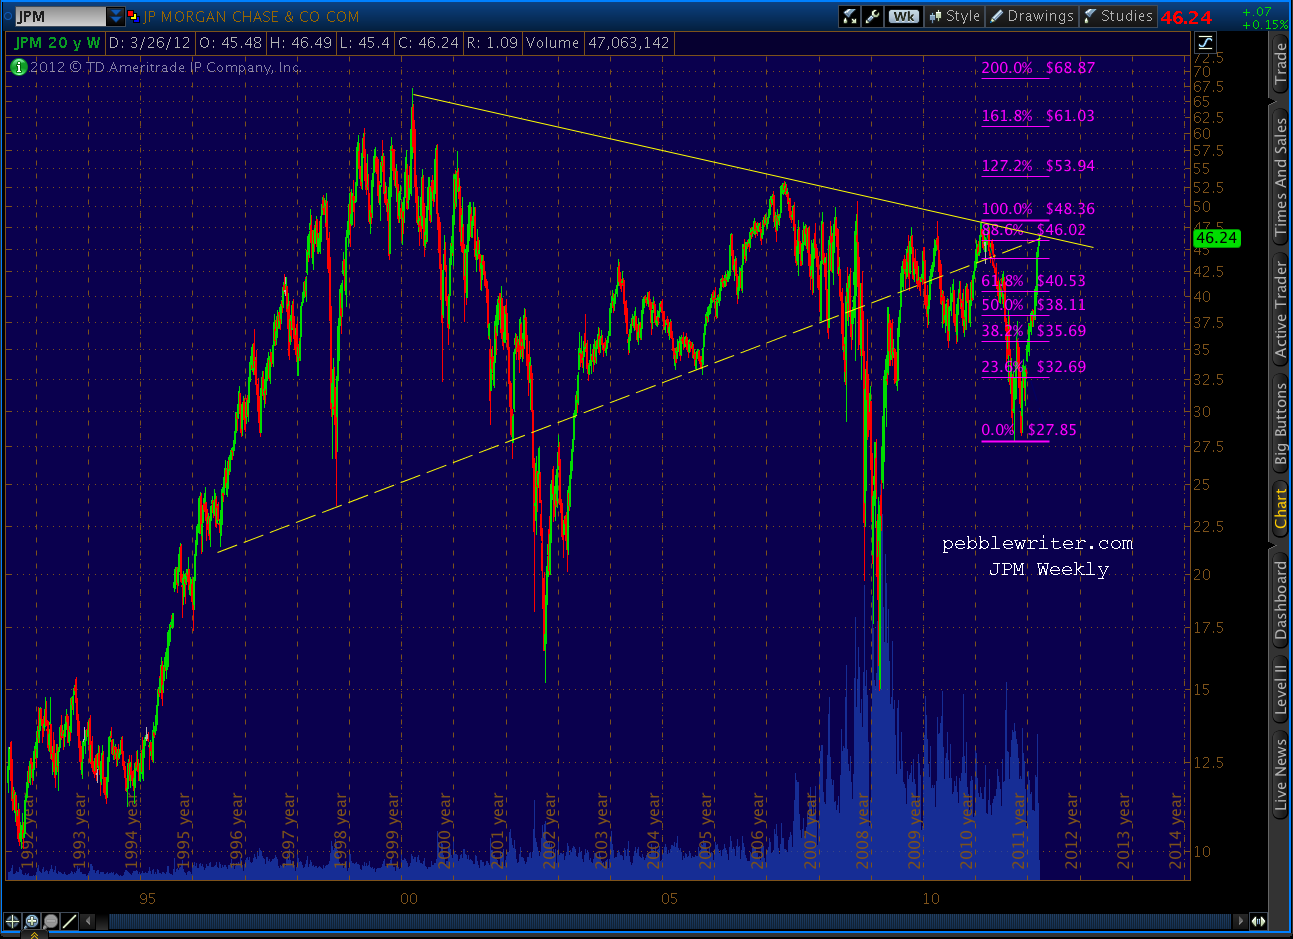
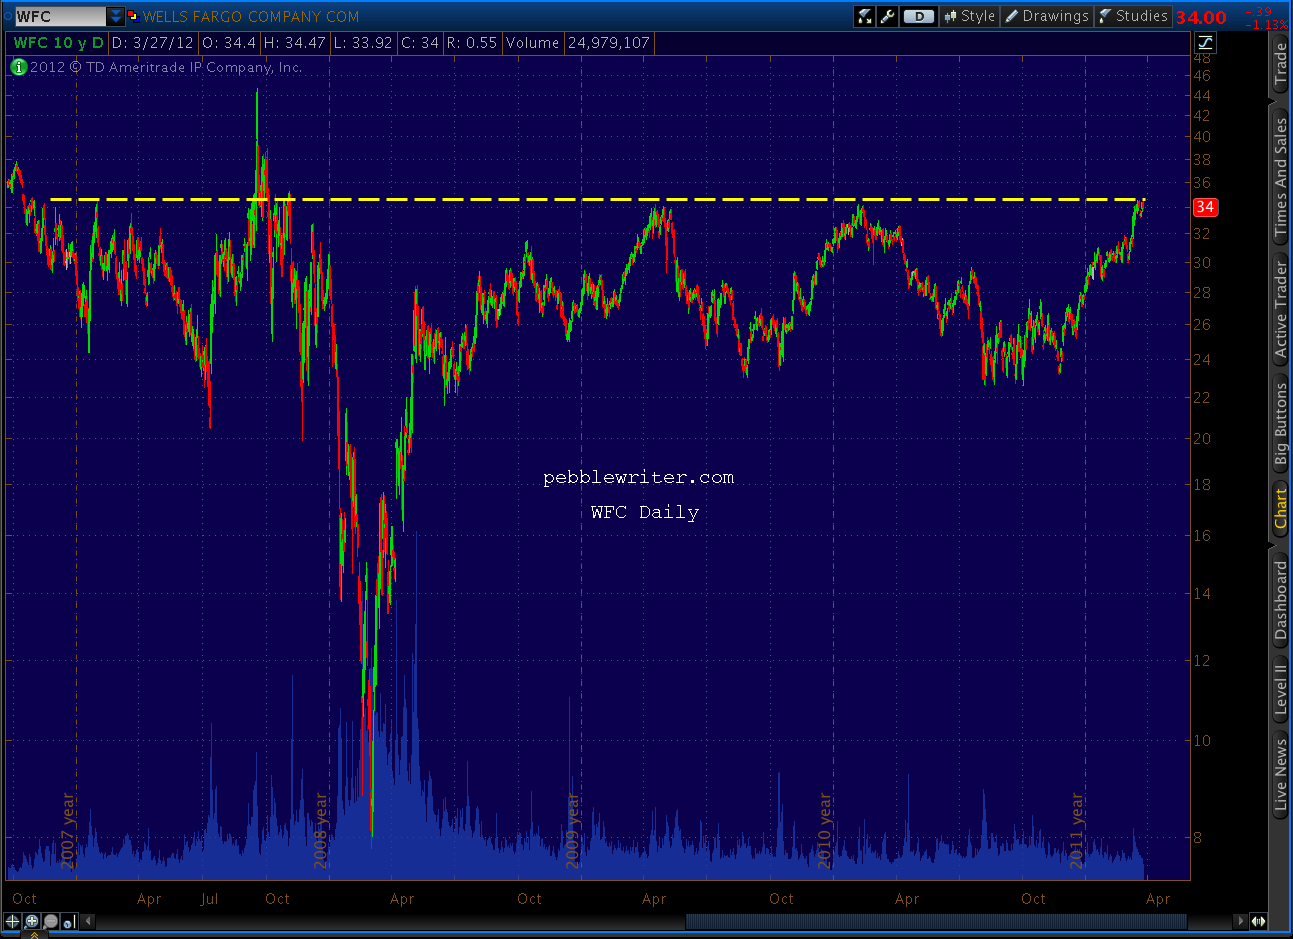
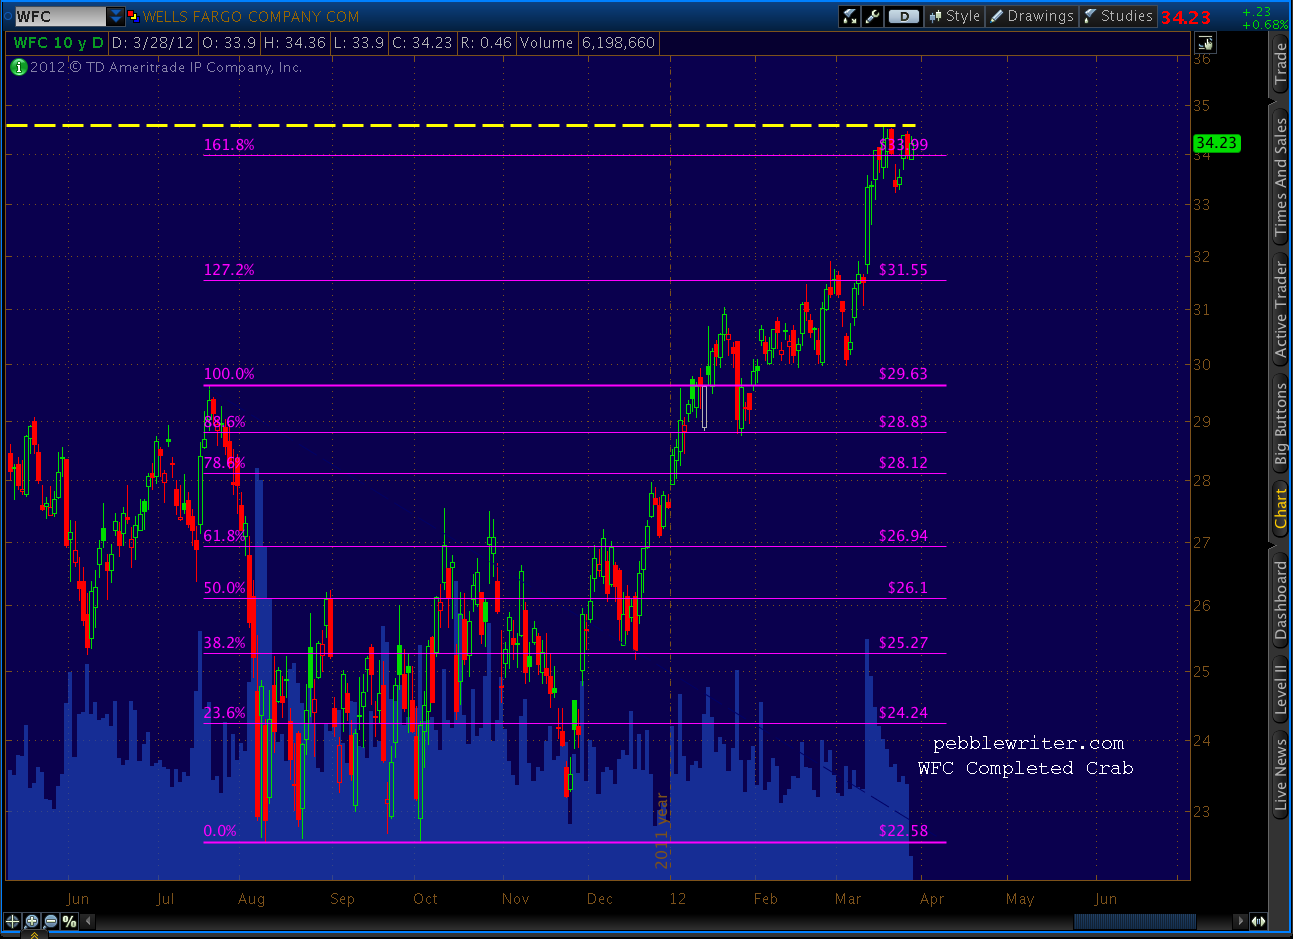
No, I imagine the number he fixates on is 35 — the third rail around which his stock seems to go into spasms every time it gets close. I’m exaggerating, of course; it’s only happened three of the last four times since November 2007. The other time, in September ’08, the stock soared right through 35 to nearly 45. That would be great — except it plunged to 7.80 six months later.
See that yellow resistance line? At least that’s what we call it. To Stumpf, it’s a 625-volt reminder of all the ugliness of the past five years: bailouts, Occupy Wall Street protests, and that humiliating testimony before Congress (what’s a fella gotta do to buy off a few Congressmen?)
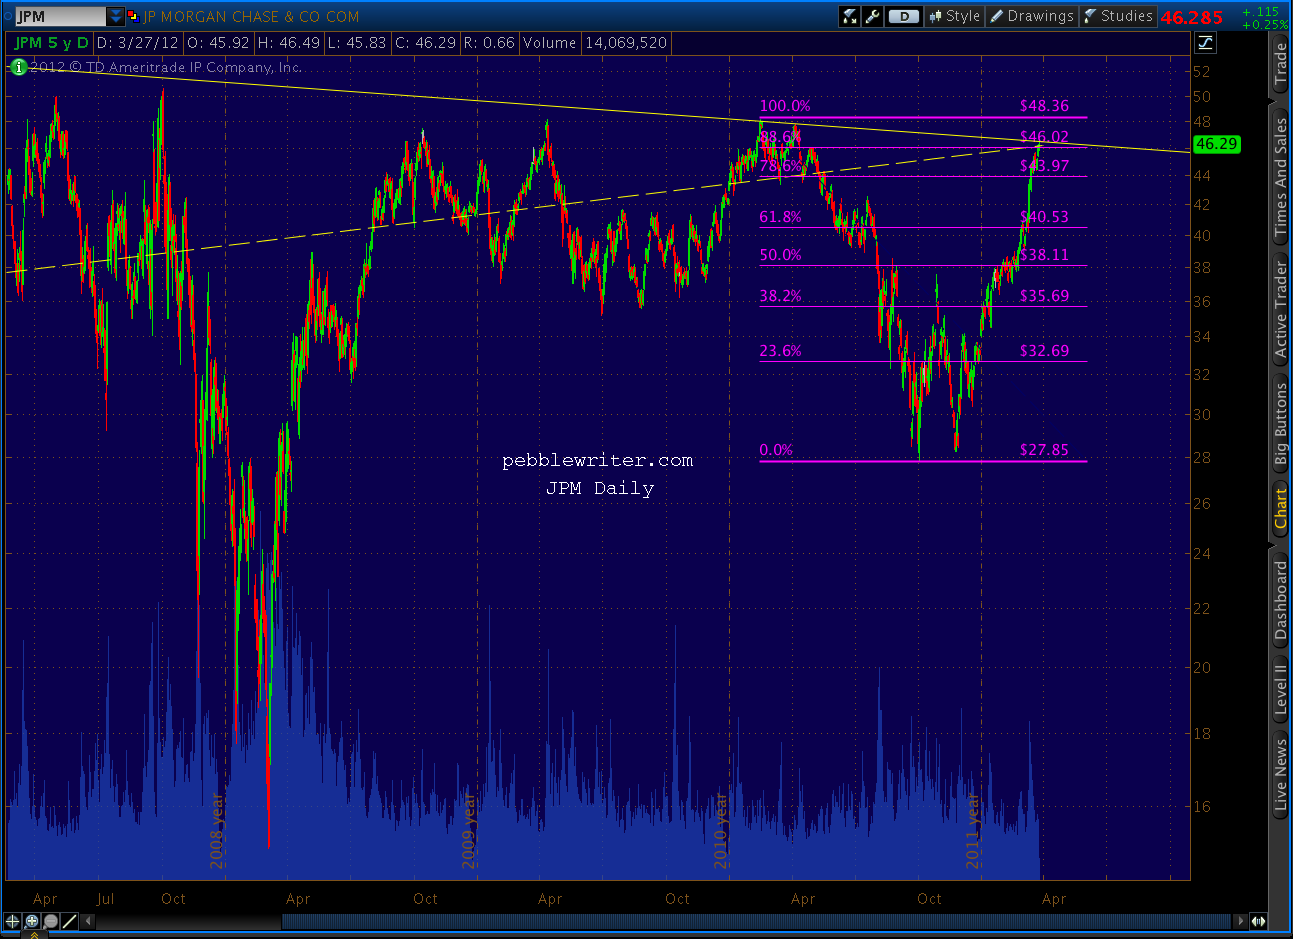
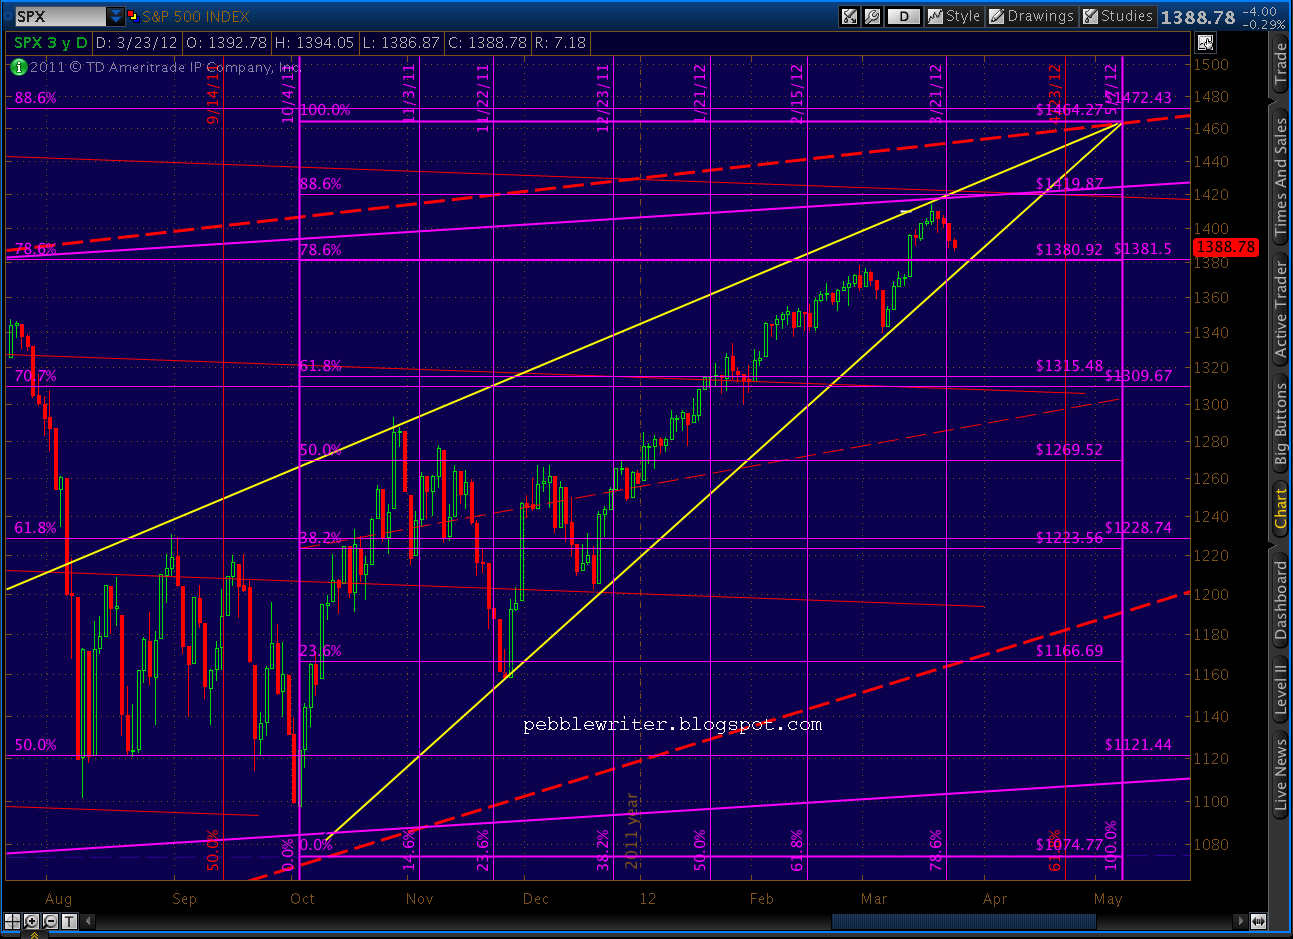
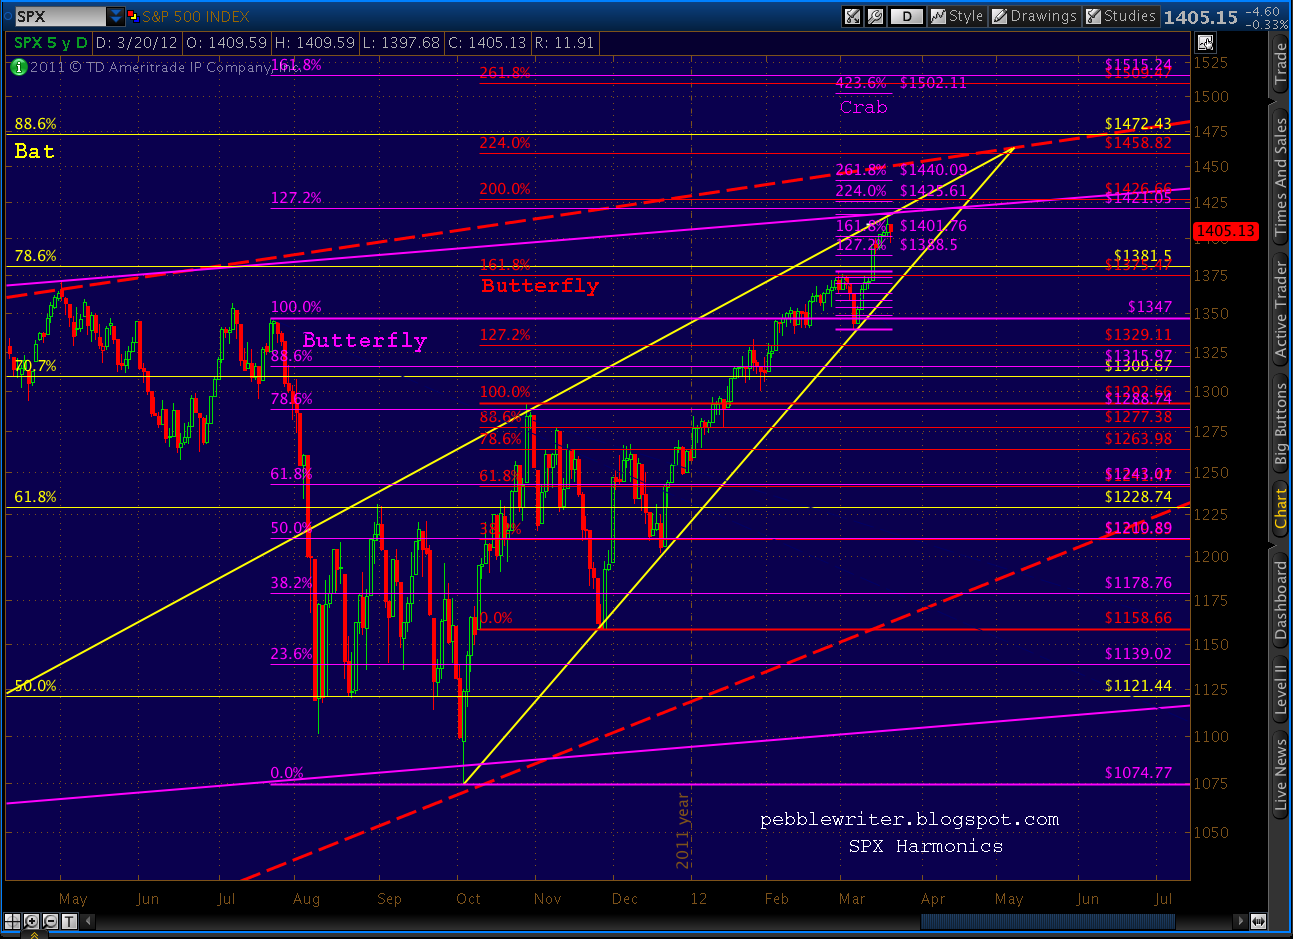
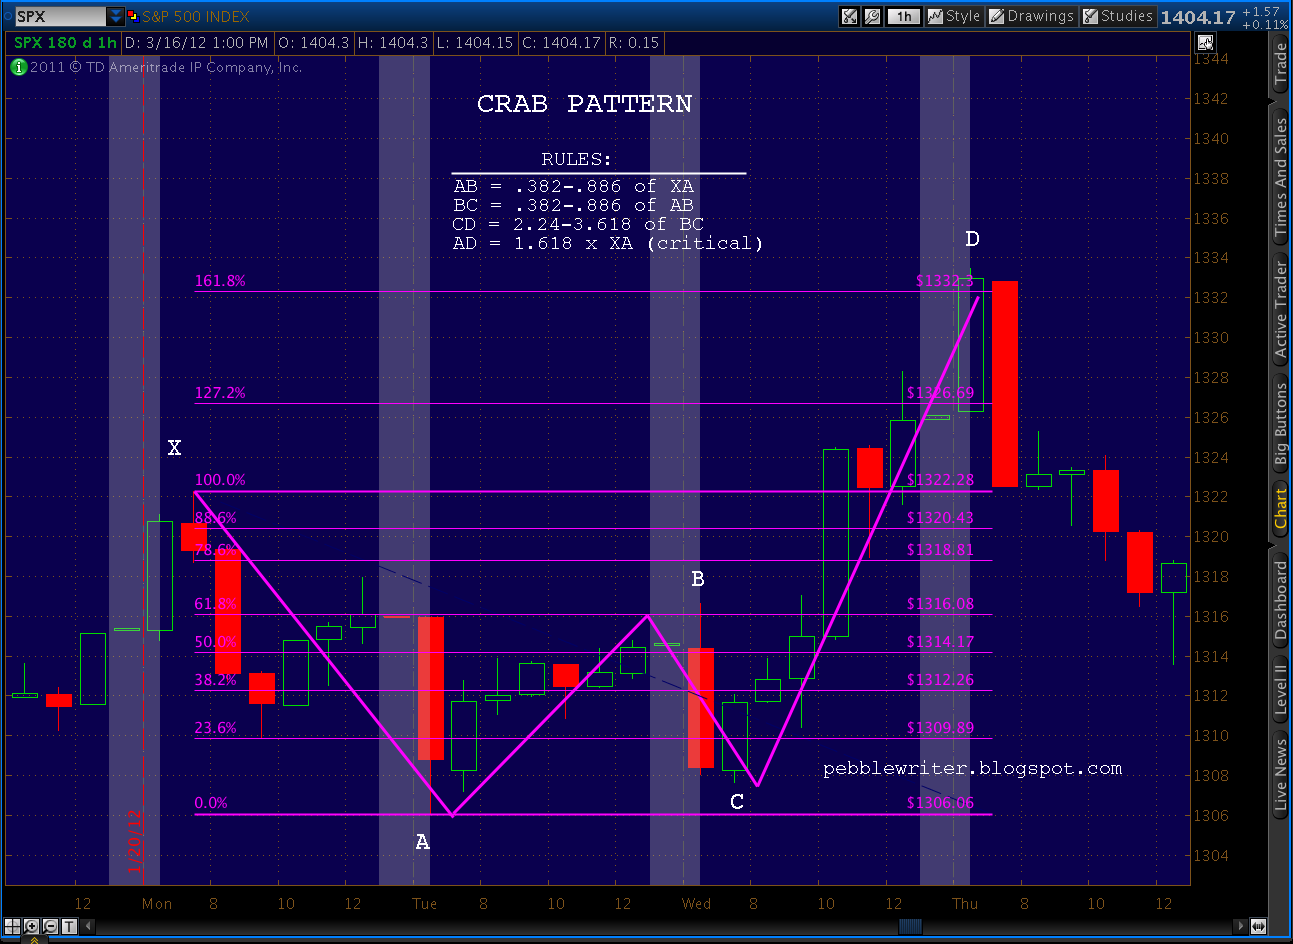
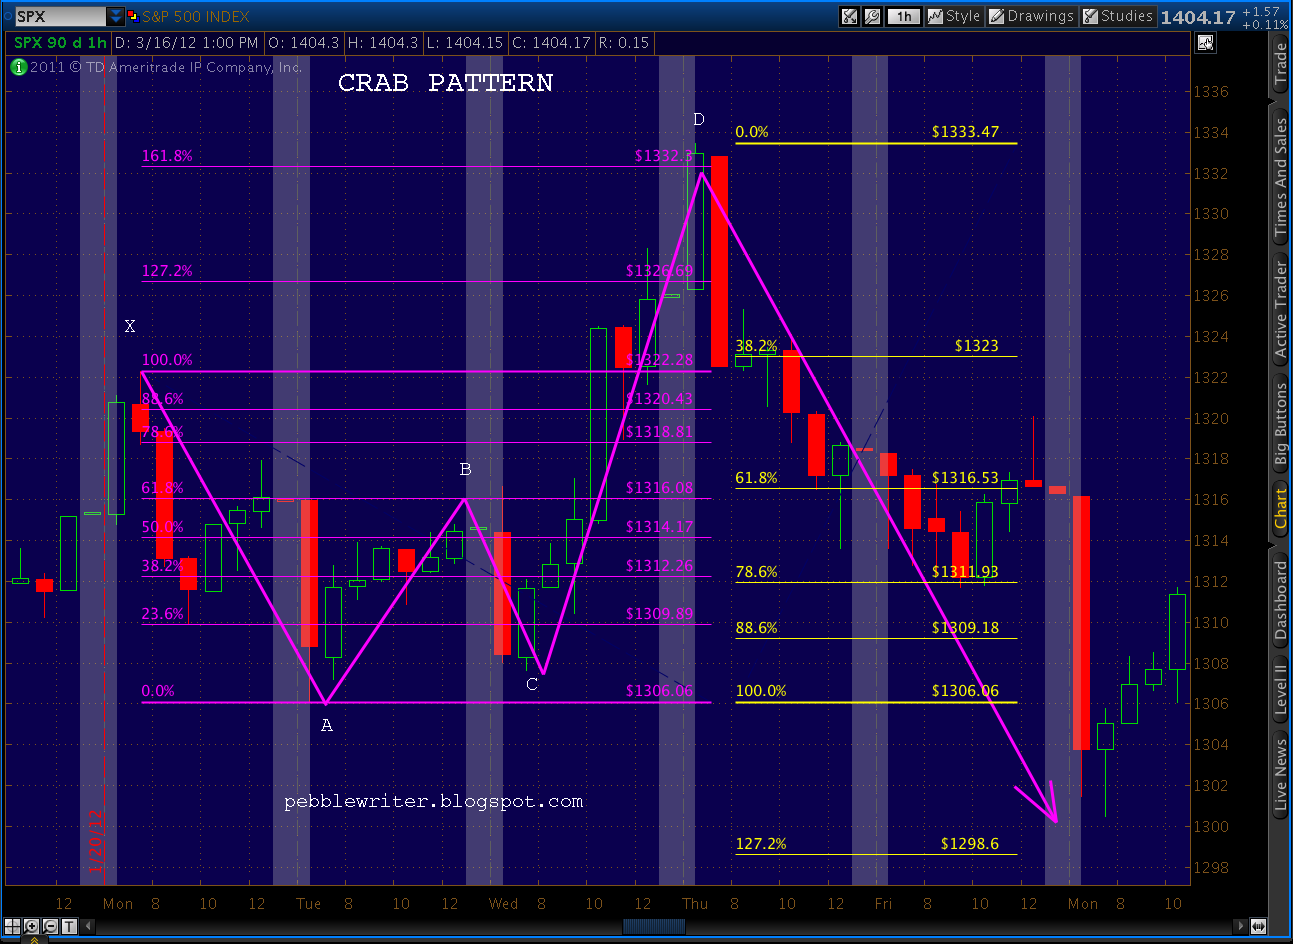
Stumpf might be dreaming about 35 a lot this week, as the stock’s edging toward that buzzing rail yet again. It’s really crummy timing for the stock to have completed a bearish Crab Pattern.
And, darn it, did the SEC have to pick this week to file that subpoena to compel him to hand over the documents he promised in regards to a $60 billion fraud investigation? Now, with earnings coming up in a couple of weeks?

That reminds me of another number, 13 — as in the number of times WFC got zapped after reporting earnings in the last 17 quarters. Earnings reports that came in the vicinity of that third rail have been particularly eventful.
Let’s not forget 6,867,990 — the number of shares of Stumpf’s WFC stock and options that’ll be worth considerably more if the 35 price point is breached. A 22 cent bump will make up for the horrendous pay cut he’s suffered over the past two years (from $21.3 million to $19.8 million, and we all know how tough it is to live on a lousy $54,000 a day!)
Hey, how about $85 million — the amount the Federal Reserve Bank fined Wells Fargo last year?
And, $25 billion — the low-interest loan the Fed slipped Wells Fargo a few years back when its survival seemed iffy.
Which brings to mind $29.4 million, the amount the money-center banks spent on lobbying in 2010 (not including the ABA.)
Then there’s $19.8 billion — the amount of hyper-hypothecation exposure on Wells Fargo’s books, 17% of Tier 1 capital?
Which reminds me — $1,274,000,000 in pre-tax trading losses for 2011.
And, lest we forget — $2.8 trillion notional in derivatives on the books.
I could go on all night, but I think you see where I’m going with this. We should all keep John Stumpf in our thoughts and prayers; with all those numbers to think about, the poor guy might have trouble getting a good night’s sleep. Somehow, I think he’ll manage as long as he sees $35 in the rear-view mirror…and soon.